Wolfram Function Repository
Instant-use add-on functions for the Wolfram Language
Function Repository Resource:
Make a weighted connectivity graph using circular embedding
ResourceFunction["ChordDiagram"][graph] generates a chord diagram using a weighted graph. |
| "Labels" | Automatic | choose the vertex labels |
| "Colors" | Automatic | choose the ribbon colors for each edge |
| "BackgroundOpacity" | 0.25 | set the background ribbon opacity |
| "Interactive" | False | include interactive mouseover |
| "TrimEdges" | 0 | trim edges with small weights |
A chord diagram with simple weighted graph:
| In[1]:= | ![wg = Graph[{1 \[DirectedEdge] 3, 1 \[DirectedEdge] 2, 2 \[DirectedEdge] 1, 3 \[DirectedEdge] 2, 3 \[DirectedEdge] 1}, EdgeWeight -> {1, 2, 1, 3, 2}];
ResourceFunction["ChordDiagram"][wg]](https://www.wolframcloud.com/obj/resourcesystem/images/8fa/8faa67f0-9c1c-45ca-81da-d3ce0924f559/77a5b4dad12e1e27.png) |
| Out[1]= |  |
By default, ChordDiagram uses VertexList as labels:
| In[2]:= | ![wg = Graph[{1 \[DirectedEdge] 3, 1 \[DirectedEdge] 2, 2 \[DirectedEdge] 1, 3 \[DirectedEdge] 2, 3 \[DirectedEdge] 1}, EdgeWeight -> {1, 2, 1, 3, 2}];](https://www.wolframcloud.com/obj/resourcesystem/images/8fa/8faa67f0-9c1c-45ca-81da-d3ce0924f559/5c18536ea5bea3f4.png) |
| In[3]:= | ![VertexList[wg]](https://www.wolframcloud.com/obj/resourcesystem/images/8fa/8faa67f0-9c1c-45ca-81da-d3ce0924f559/1e2ec06f3622c3cd.png) |
| Out[3]= |  |
| In[4]:= | ![ResourceFunction["ChordDiagram"][wg]](https://www.wolframcloud.com/obj/resourcesystem/images/8fa/8faa67f0-9c1c-45ca-81da-d3ce0924f559/4785c74eca1c160d.png) |
| Out[4]= |  |
Use an explicit list of strings to overwrite this:
| In[5]:= | ![wg = Graph[{1 \[DirectedEdge] 3, 1 \[DirectedEdge] 2, 2 \[DirectedEdge] 1, 3 \[DirectedEdge] 2, 3 \[DirectedEdge] 1}, EdgeWeight -> {1, 2, 1, 3, 2}];
ResourceFunction["ChordDiagram"][wg, "Labels" -> {"A", "B", "C"}]](https://www.wolframcloud.com/obj/resourcesystem/images/8fa/8faa67f0-9c1c-45ca-81da-d3ce0924f559/4be7cc479bff62ea.png) |
| Out[5]= |  |
For realistic datasets, many edges may suffer from small weights:
| In[6]:= | ![wg = ExampleData[{"NetworkGraph", "LesMiserables"}];
ResourceFunction["ChordDiagram"][wg]](https://www.wolframcloud.com/obj/resourcesystem/images/8fa/8faa67f0-9c1c-45ca-81da-d3ce0924f559/2f48d0b07bce53b1.png) |
| Out[6]= | 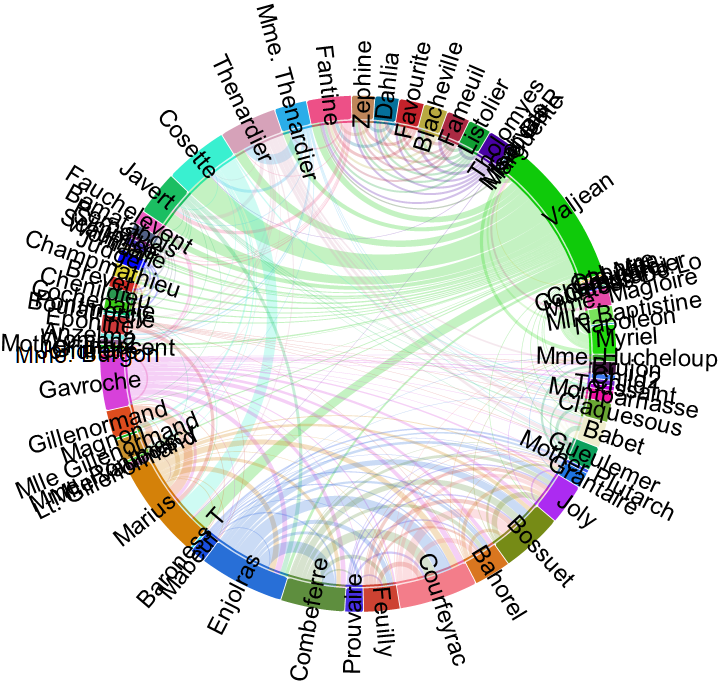 |
Use TrimEdges to drop the lowest edge weights:
| In[7]:= | ![ResourceFunction["ChordDiagram"][wg, "TrimEdges" -> 5]](https://www.wolframcloud.com/obj/resourcesystem/images/8fa/8faa67f0-9c1c-45ca-81da-d3ce0924f559/096c57421ebecddf.png) |
| Out[7]= | 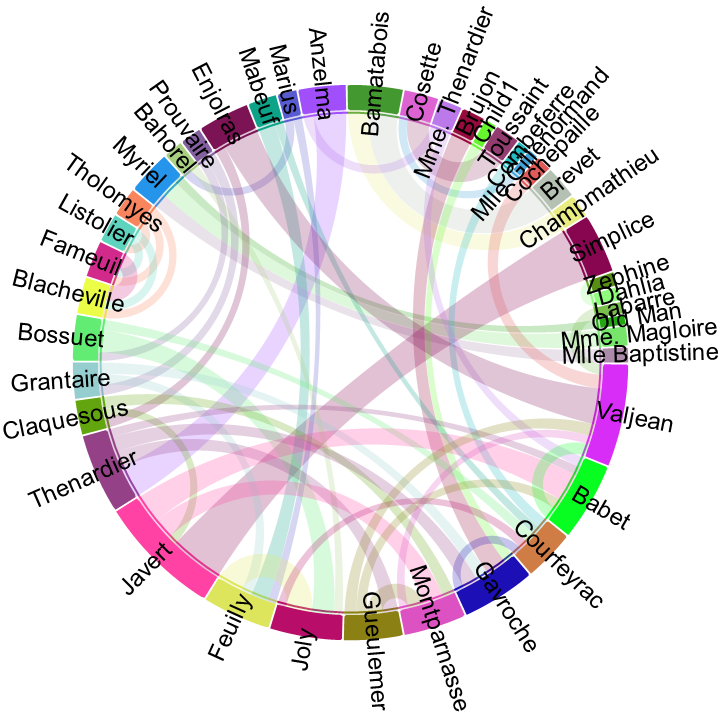 |
Add basic interactivity using mouseovers:
| In[8]:= | ![wg = ExampleData[{"NetworkGraph", "LesMiserables"}];
ResourceFunction["ChordDiagram"][wg, "TrimEdges" -> 5, "Interactive" -> True]](https://www.wolframcloud.com/obj/resourcesystem/images/8fa/8faa67f0-9c1c-45ca-81da-d3ce0924f559/7960cb0e7409d017.png) |
| Out[8]= | 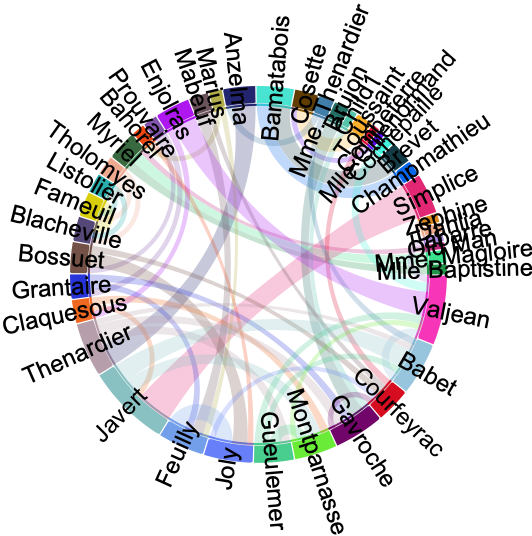 |
Using a directed graph to show asymmetric ribbon widths:
| In[9]:= | ![wg = ExampleData[{"NetworkGraph", "EurovisionVotes"}];](https://www.wolframcloud.com/obj/resourcesystem/images/8fa/8faa67f0-9c1c-45ca-81da-d3ce0924f559/33f6cfbd25a68fc0.png) |
Add custom colors and labels:
| In[10]:= | ![labels = CountryData[#, "CountryCode"] & /@ VertexList[wg];
flags = CountryData[#, "Flag"] & /@ VertexList[wg];
cols = Most@*Blend@*DominantColors /@ flags;](https://www.wolframcloud.com/obj/resourcesystem/images/8fa/8faa67f0-9c1c-45ca-81da-d3ce0924f559/7c8b78ff9d7ae0e5.png) |
| In[11]:= | ![ResourceFunction["ChordDiagram"][wg, "Labels" -> labels, "Colors" -> cols]](https://www.wolframcloud.com/obj/resourcesystem/images/8fa/8faa67f0-9c1c-45ca-81da-d3ce0924f559/7226dabf762282bf.png) |
| Out[11]= | 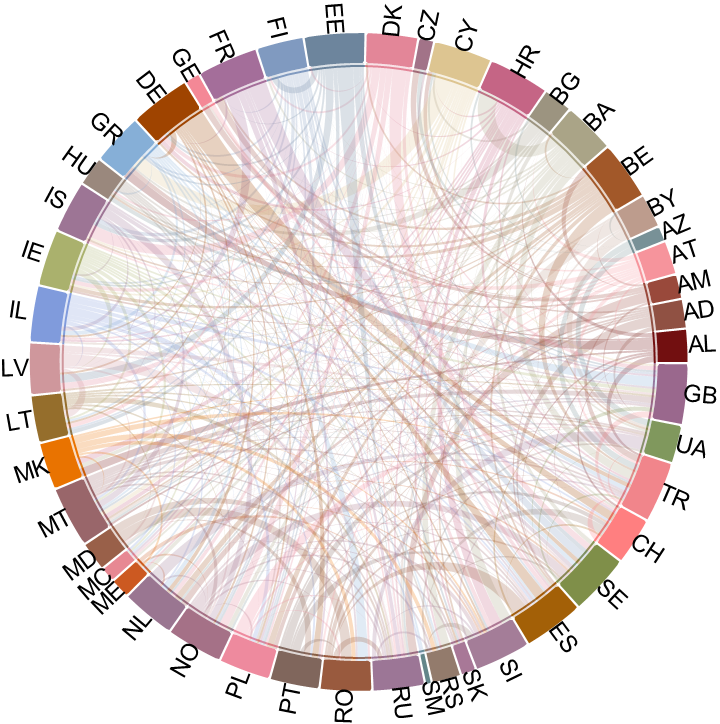 |
By default, the function accepts a weighted graph. If you instead have a weighted adjacency matrix, this can be converted to a weighted graph first:
| Out[25]= |  |
| In[26]:= | ![MatrixForm[
wam = ReplacePart[
RandomInteger[{0, 10}, {5, 5}], {i_, i_} :> \[Infinity]]]](https://www.wolframcloud.com/obj/resourcesystem/images/8fa/8faa67f0-9c1c-45ca-81da-d3ce0924f559/2f1a641ac310c769.png) |
| In[27]:= | ![wg = WeightedAdjacencyGraph[wam]](https://www.wolframcloud.com/obj/resourcesystem/images/8fa/8faa67f0-9c1c-45ca-81da-d3ce0924f559/74185ad216c78f43.png) |
| Out[27]= | 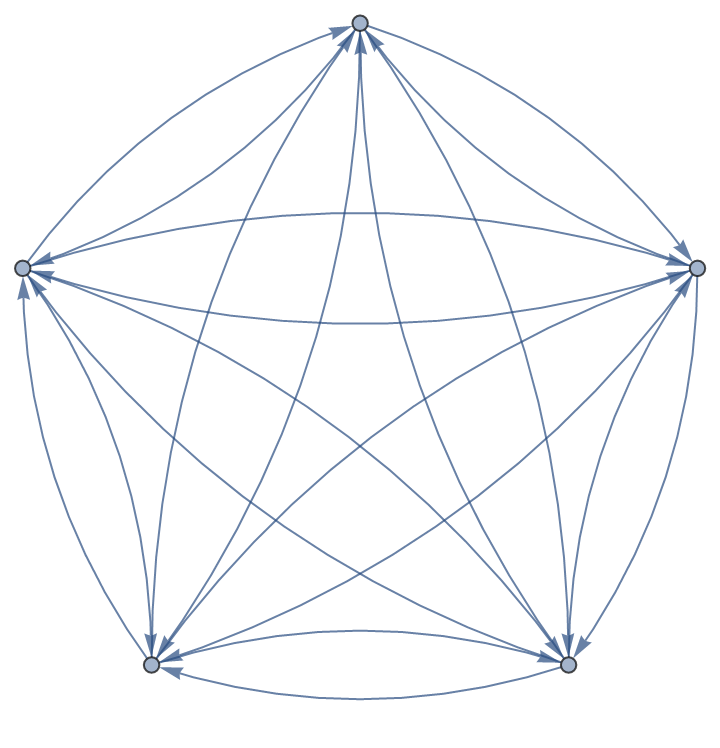 |
| In[28]:= | ![ResourceFunction["ChordDiagram"][wg]](https://www.wolframcloud.com/obj/resourcesystem/images/8fa/8faa67f0-9c1c-45ca-81da-d3ce0924f559/7cc7d5fb1421a7c8.png) |
| Out[28]= | 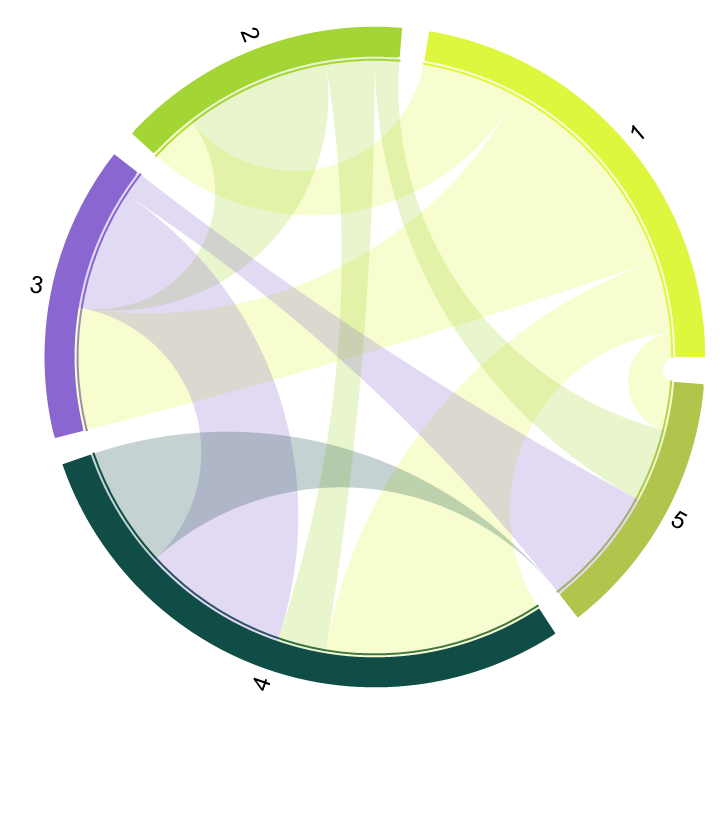 |
This work is licensed under a Creative Commons Attribution 4.0 International License