Wolfram Function Repository
Instant-use add-on functions for the Wolfram Language
Function Repository Resource:
Generate a swept-frequency sinusoidal function
ResourceFunction["ChirpFunction"][] generates a function for a chirp signal. |
| “InitialFrequency" | 1 | initial frequency in Hz |
| “FinalFrequency" | 100 | final frequency in Hz |
| "Duration" | 1 | final time in seconds |
| "Magnitude" | 1 | height of the sinusoidal peaks |
| "ChirpType" | "Logarithmic" | indicates how the frequency should change. Accepted values are "Logarithmic" and "Linear" |
| "Sinusoid" | Cos | Sin will give a smooth start. Cos will give an abrupt start. |
| "AmplitudeRampFraction" | 0 | fraction of window length for amplitude ramps. Accepts values from 0 to 0.5. |
ChirpFunction returns a compiled function:
| In[1]:= |
| Out[1]= |
The default cosine base sinusoid goes from 1 Hz to 100 Hz logarithmically over the a time of one second:
| In[2]:= |
| Out[2]= |  |
Adjust the frequency range for audibility and hear the result:
| In[3]:= |
| Out[4]= | 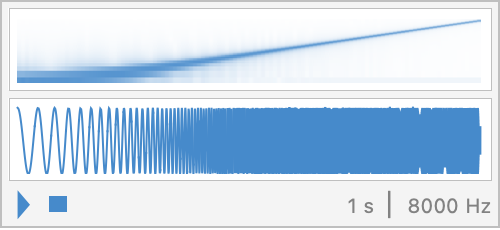 |
By varying the frequency linearly, the initial lower frequencies are deemphasized:
| In[5]:= |
| Out[6]= | 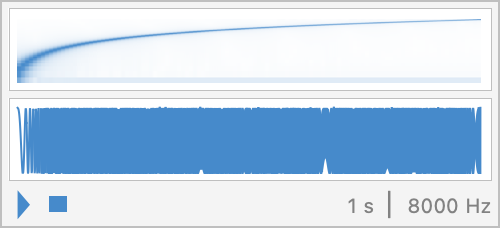 |
Start the signal at zero:
| In[7]:= |
| Out[8]= |  |
See the effect of amplitude ramps using the option "AmplitudeRampFraction":
| In[9]:= |
| Out[10]= |  |
Options can be provided as an Association:
| In[11]:= | ![f = ResourceFunction[
"ChirpFunction"][<|"InitialFrequency" -> .1, "FinalFrequency" -> 200, "Magnitude" -> 10, "Duration" -> 1|>];
Plot[f[t], {t, 0, 1}, AspectRatio -> 1/8]](https://www.wolframcloud.com/obj/resourcesystem/images/59c/59c57363-e07f-4c1e-b079-8c9a61f5b9ff/4dfa39e56d2e73b7.png) |
| Out[12]= |  |
Use a longer duration:
| In[13]:= | ![f = ResourceFunction[
"ChirpFunction"][<|"InitialFrequency" -> 1, "FinalFrequency" -> 200, "Magnitude" -> 10, "Duration" -> 2|>];
Plot[f[t], {t, 0, 2}, AspectRatio -> 1/8, ImageSize -> Full]](https://www.wolframcloud.com/obj/resourcesystem/images/59c/59c57363-e07f-4c1e-b079-8c9a61f5b9ff/4edf93d89195c3cd.png) |
| Out[14]= |  |
The following examples show the effect of the chirp configuration on the power spectrum:
| In[15]:= | ![chirpParams = <|"InitialFrequency" -> 50, "FinalFrequency" -> 1000, "Duration" -> 0.1|>;
sampleTime = .0001;
gOpts = {AspectRatio -> 1/8, ImageSize -> Full};
chirpPlot[data_] := Column[{ListLinePlot[data, gOpts, PlotLabel -> "Time Domain", AxesLabel -> {"t(s)", ""}], Periodogram[Last /@ data, SampleRate -> 1/sampleTime, gOpts, PlotLabel -> "Power Spectum", AxesLabel -> {"Hz", "dB"}]}];](https://www.wolframcloud.com/obj/resourcesystem/images/59c/59c57363-e07f-4c1e-b079-8c9a61f5b9ff/119b2927983c8ff3.png) |
Logarithmic chirp:
| In[16]:= |
| Out[17]= | 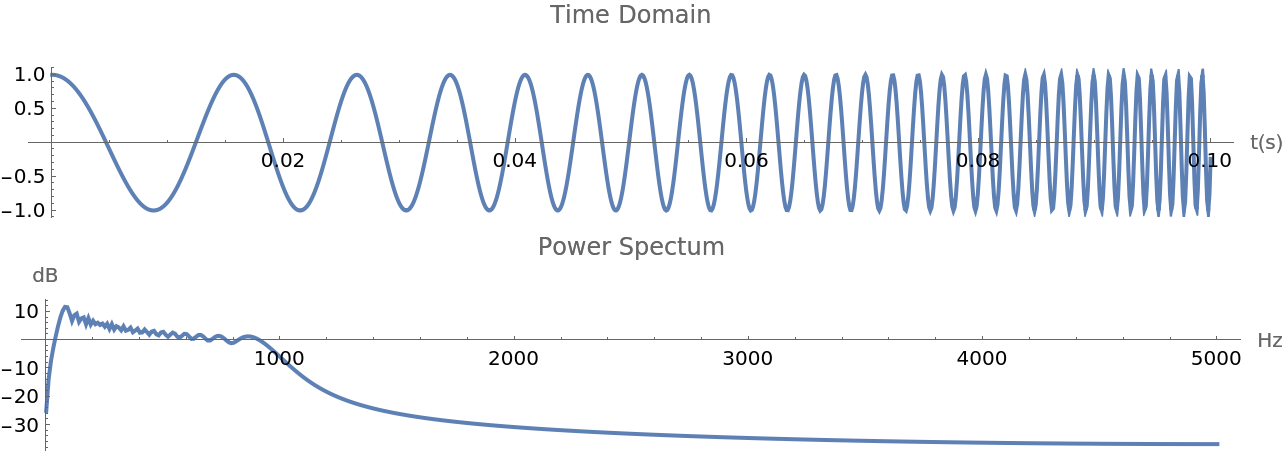 |
Linear chirp:
| In[18]:= |
| Out[19]= | 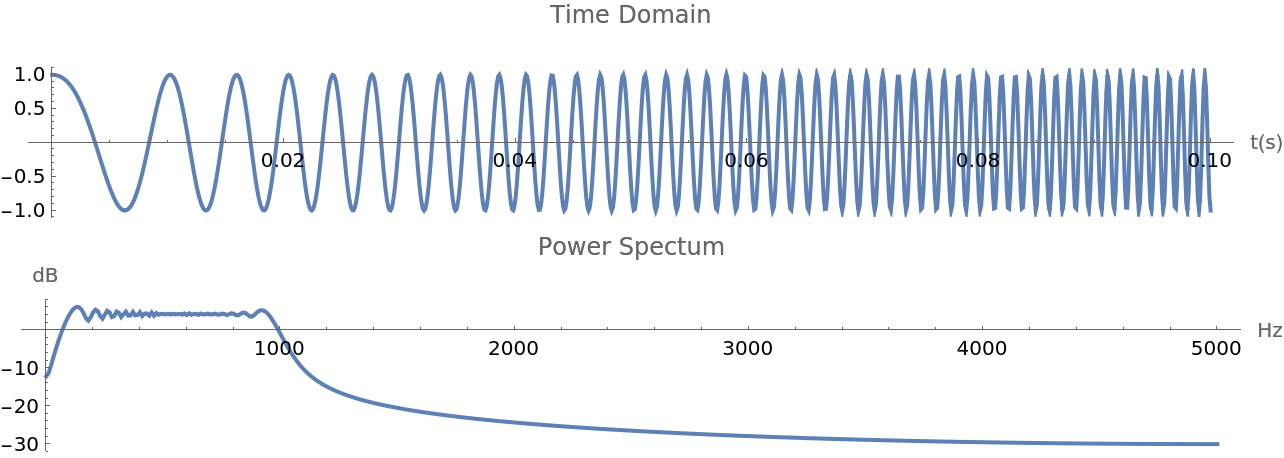 |
Amplitude adjusted linear chirp:
| In[20]:= | ![f = ResourceFunction["ChirpFunction"][
Append[chirpParams, {"ChirpType" -> "Linear", "AmplitudeRampFraction" -> .1}]];
chirpPlot[
Table[{t, f[t]}, {t, 0, chirpParams["Duration"], sampleTime}]]](https://www.wolframcloud.com/obj/resourcesystem/images/59c/59c57363-e07f-4c1e-b079-8c9a61f5b9ff/569fd4336b780bda.png) |
| Out[21]= | 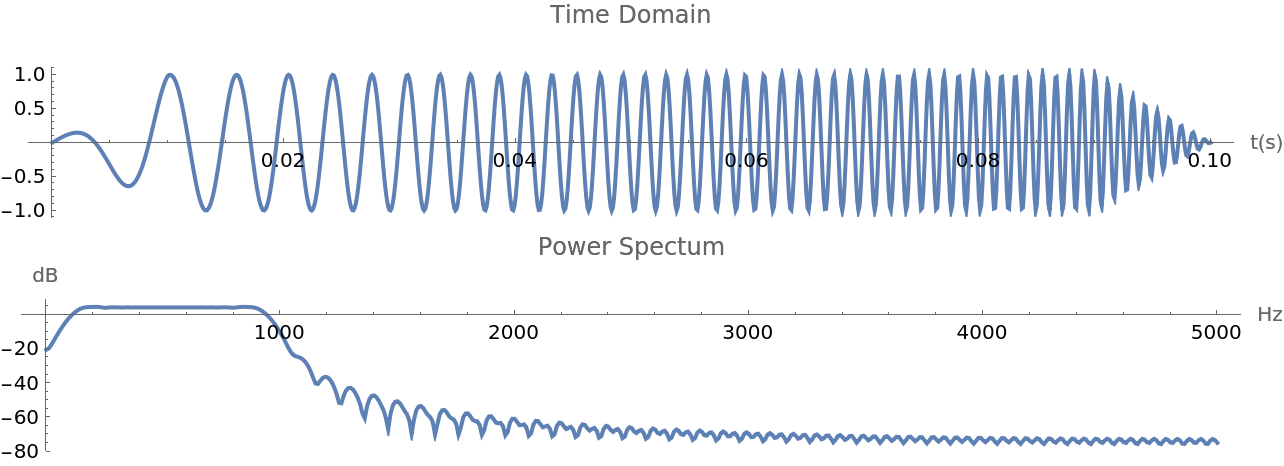 |
Amplitude adjusted logarithmic chirp:
| In[22]:= | ![f = ResourceFunction["ChirpFunction"][
Append[chirpParams, {"ChirpType" -> "Logarithmic", "AmplitudeRampFraction" -> .1}]];
chirpPlot[
Table[{t, f[t]}, {t, 0, chirpParams["Duration"], sampleTime}]]](https://www.wolframcloud.com/obj/resourcesystem/images/59c/59c57363-e07f-4c1e-b079-8c9a61f5b9ff/45b2e350a982395e.png) |
| Out[23]= | 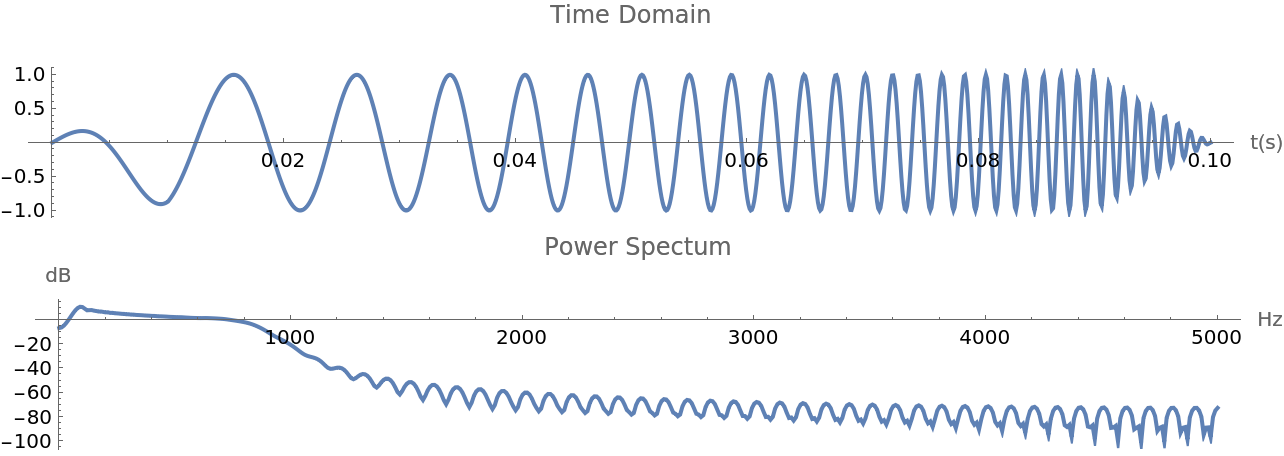 |
Change the initial frequency:
| In[24]:= | ![Column[Map[
With[{f = ResourceFunction["ChirpFunction"][{"InitialFrequency" -> #}]},
Plot[f[t], {t, 0, 1}, AspectRatio -> 1/8, ImageSize -> Full, PlotLabel -> StringTemplate["\"InitialFrequency\" \[Rule] ``"][#]]] &, {.1, 1, 10}]]](https://www.wolframcloud.com/obj/resourcesystem/images/59c/59c57363-e07f-4c1e-b079-8c9a61f5b9ff/7b9534d2a285131b.png) |
| Out[24]= | 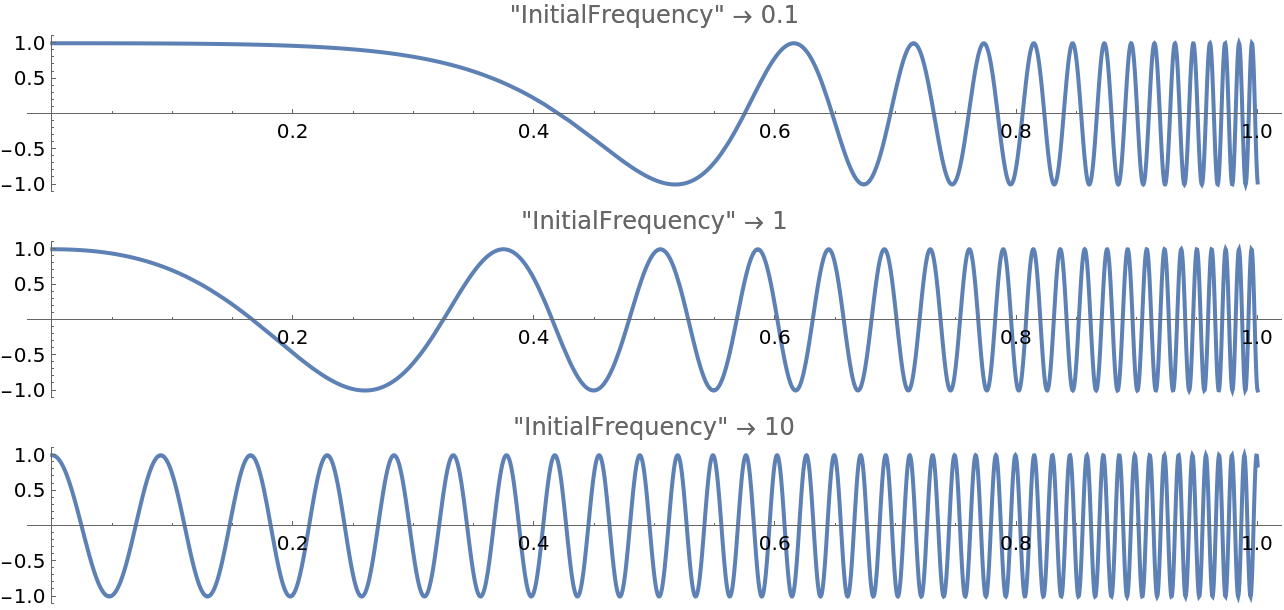 |
Change the final frequency:
| In[25]:= | ![Column[Map[
With[{f = ResourceFunction["ChirpFunction"][{"FinalFrequency" -> #}]},
Plot[f[t], {t, 0, 1}, AspectRatio -> 1/8, ImageSize -> Full, PlotLabel -> StringTemplate["\"FinalFrequency\" \[Rule] ``"][#]]] &, {10, 100, 1000}]]](https://www.wolframcloud.com/obj/resourcesystem/images/59c/59c57363-e07f-4c1e-b079-8c9a61f5b9ff/4246658dd0333e05.png) |
| Out[25]= | 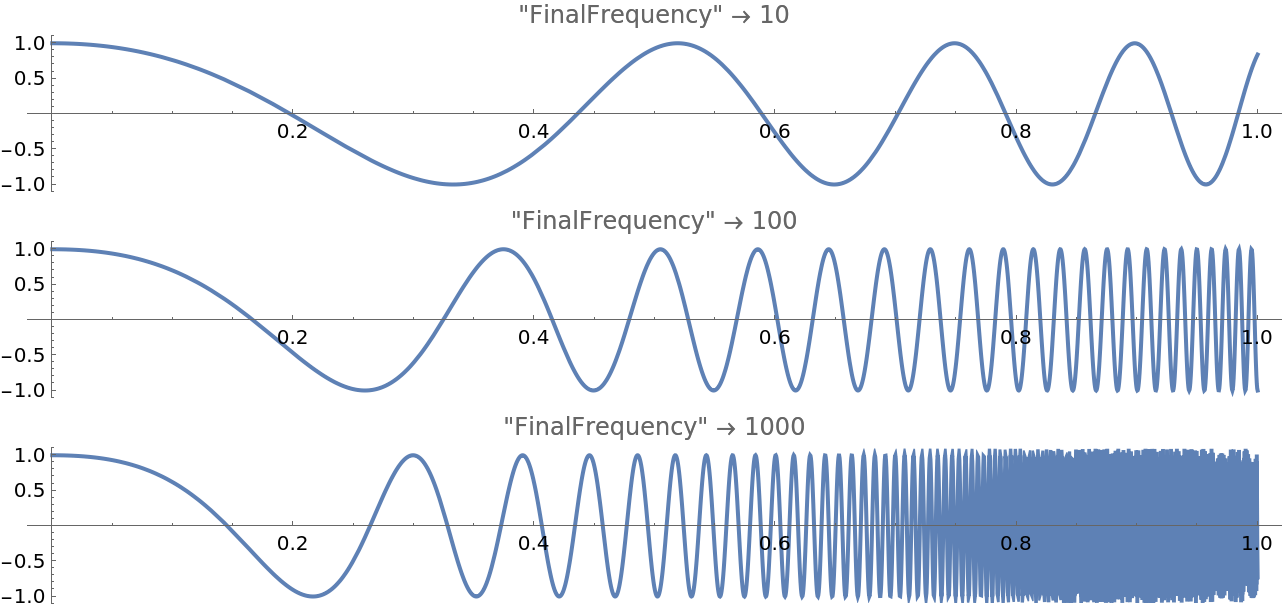 |
Change how long it takes to go from the initial to the final frequency:
| In[26]:= | ![Column[Map[
With[{f = ResourceFunction["ChirpFunction"][{"Duration" -> #}]},
Plot[f[t], {t, 0, #}, AspectRatio -> 1/8, ImageSize -> Full, PlotLabel -> StringTemplate["\"Duration\" \[Rule] ``"][#]]] &, {.5, 1, 2}]]](https://www.wolframcloud.com/obj/resourcesystem/images/59c/59c57363-e07f-4c1e-b079-8c9a61f5b9ff/59a6b0bcd3688762.png) |
| Out[26]= | 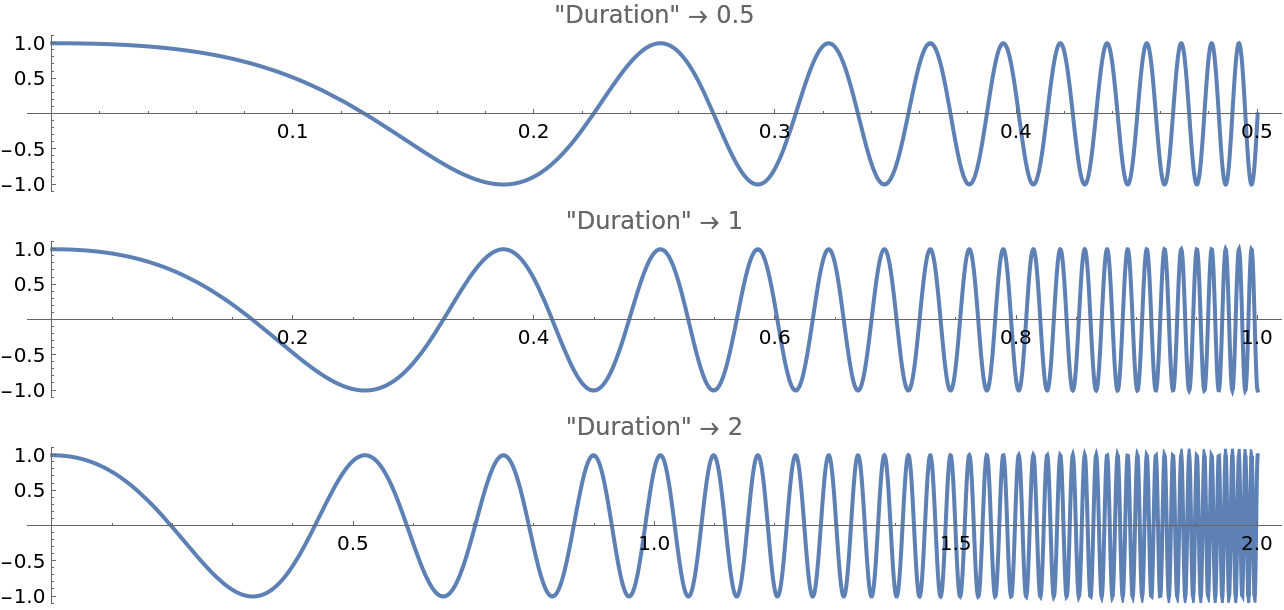 |
Change the magnitude (peak values):
| In[27]:= | ![Column[Map[
With[{f = ResourceFunction["ChirpFunction"][{"Magnitude" -> #}]},
Plot[f[t], {t, 0, 1}, AspectRatio -> 1/8, ImageSize -> Full, PlotRange -> {-3, 3}, PlotLabel -> StringTemplate["\"Magnitude\" \[Rule] ``"][#]]] &, {.25, 1, 3}]]](https://www.wolframcloud.com/obj/resourcesystem/images/59c/59c57363-e07f-4c1e-b079-8c9a61f5b9ff/13b50bf940e4d1f0.png) |
| Out[27]= | 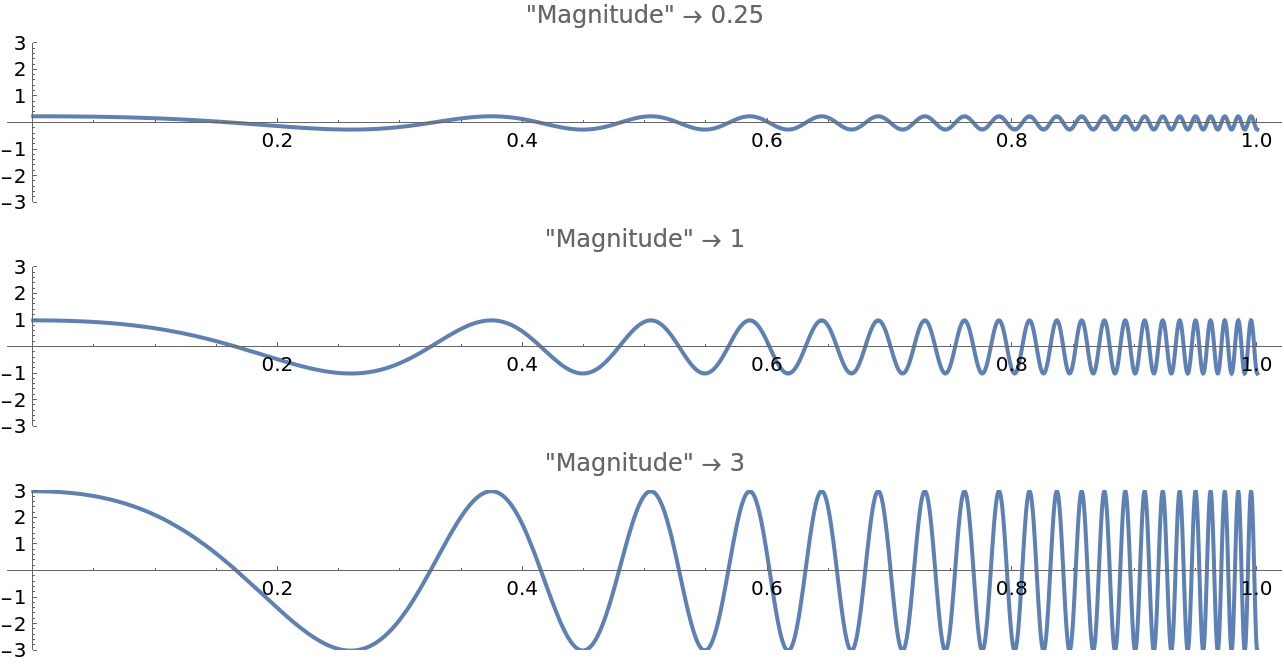 |
Change the function type used to vary the frequency:
| In[28]:= | ![Column[Map[
With[{f = ResourceFunction["ChirpFunction"][{"ChirpType" -> #}]},
Plot[f[t], {t, 0, 1}, AspectRatio -> 1/8, ImageSize -> Full, PlotLabel -> StringTemplate[
"\"ChirpType\" \[Rule] ``"][#]]] &, {"Logarithmic", "Linear"}]]](https://www.wolframcloud.com/obj/resourcesystem/images/59c/59c57363-e07f-4c1e-b079-8c9a61f5b9ff/3aa8b5dca6c2e739.png) |
| Out[28]= |  |
A Sin sinusoid results in a smooth rise whereas Cos starts high resembling a step:
| In[29]:= | ![Column[Map[
With[{f = ResourceFunction["ChirpFunction"][{"Sinusoid" -> #}]},
Plot[f[t], {t, 0, 1}, AspectRatio -> 1/8, ImageSize -> Full, PlotLabel -> StringTemplate["\"Sinusoid\" \[Rule] ``"][#]]] &, {Sin, Cos}]]](https://www.wolframcloud.com/obj/resourcesystem/images/59c/59c57363-e07f-4c1e-b079-8c9a61f5b9ff/6f0a0f28e61b5c85.png) |
| Out[29]= |  |
Amplitude ramps can help reduce transient response effects at the start and end:
| In[30]:= | ![Column[Table[
With[{f = ResourceFunction["ChirpFunction"][
"AmplitudeRampFraction" -> \[Rho], "InitialFrequency" -> 20]},
Plot[f[t], {t, 0, 1}, AspectRatio -> 1/8, ImageSize -> Full, PlotLabel -> StringTemplate["\"\[Rho]\" \[Rule] ``"][\[Rho]]]], {\[Rho], 0, .5, .1}]]](https://www.wolframcloud.com/obj/resourcesystem/images/59c/59c57363-e07f-4c1e-b079-8c9a61f5b9ff/7fd3847900e726b4.png) |
| Out[30]= | 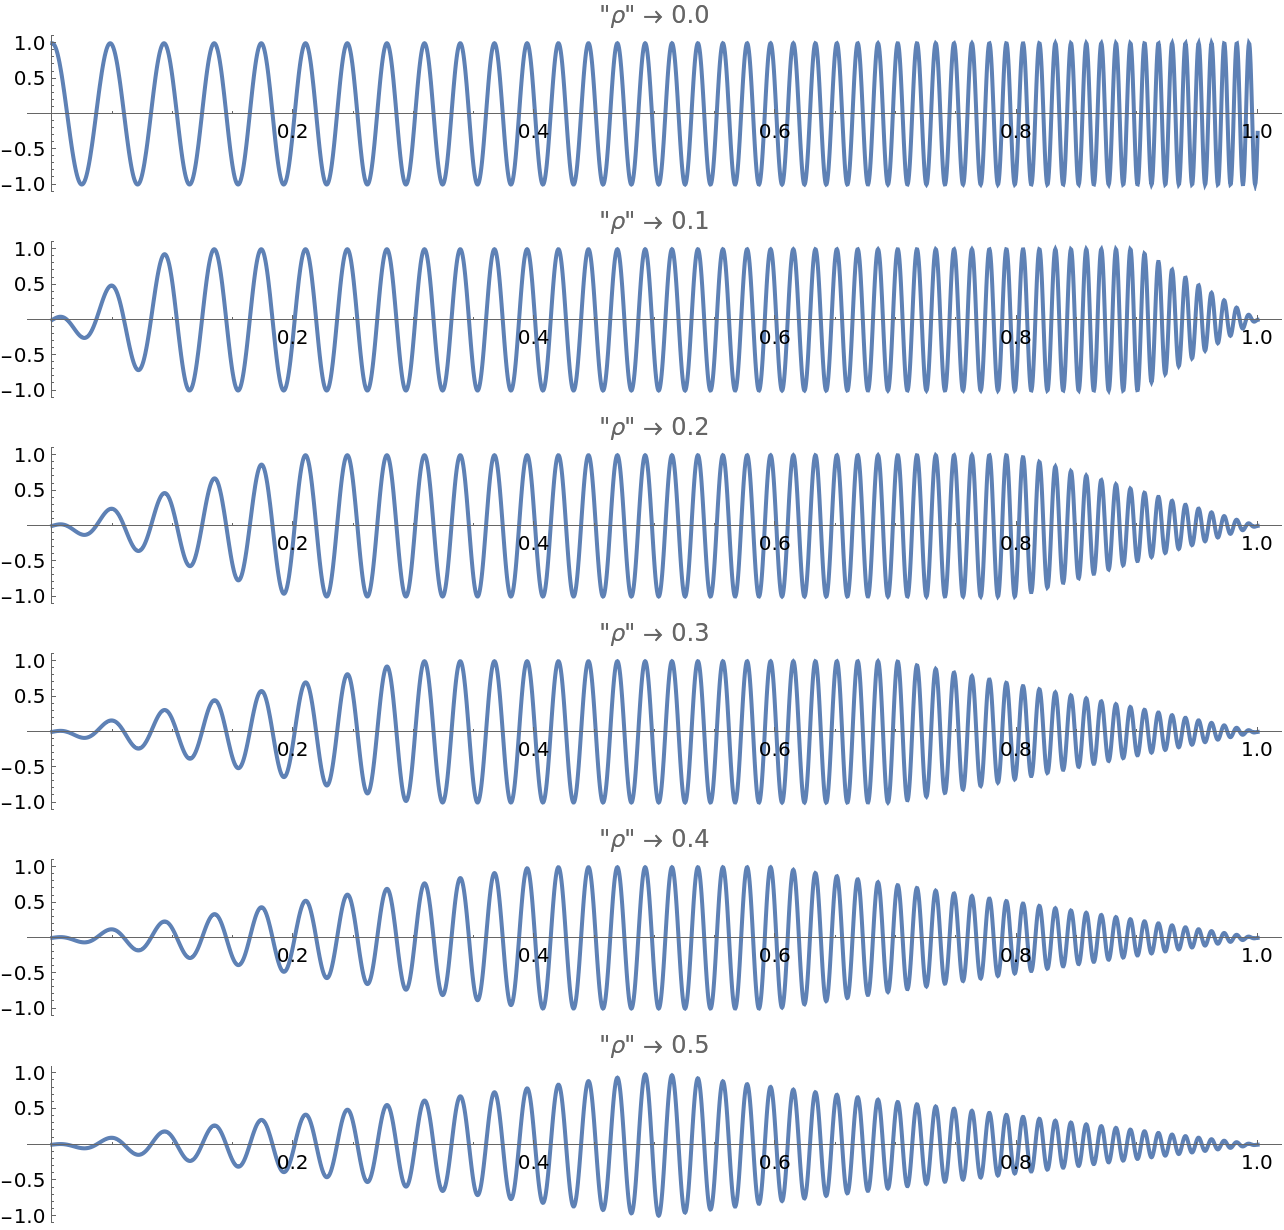 |
The resulting function is not intended to be evaluated for times greater than the specified duration. Doing so will produce unexpected results without warning:
| In[31]:= | ![f = ResourceFunction[
"ChirpFunction"][<|"InitialFrequency" -> 1, "FinalFrequency" -> 100, "Magnitude" -> 10, "Duration" -> 1, "AmplitudeRampFraction" -> .1|>];
Plot[f[t], {t, 0, 1.2}, AspectRatio -> 1/8, ImageSize -> Full]](https://www.wolframcloud.com/obj/resourcesystem/images/59c/59c57363-e07f-4c1e-b079-8c9a61f5b9ff/4aa994f965ae48eb.png) |
| Out[32]= |  |
Create an interactive chirp:
| In[33]:= | ![Manipulate[
With[{excitation = ResourceFunction["ChirpFunction"]["InitialFrequency" -> f0, "FinalFrequency" -> f1, "Duration" -> tmax, "ChirpType" -> type, "Sinusoid" -> f, "AmplitudeRampFraction" -> \[Rho]]},
Plot[excitation[t], {t, 0, tmax}, AspectRatio -> 1/GoldenRatio/4, ImageSize -> Full, PlotPoints -> 300]],
{type, {"Linear", "Logarithmic"}},
{{f, Sin, "Sinusoid Function"}, {Sin, Cos}},
{tmax, {0.1, 0.5, 1.0, 2.0, 10}},
{{f0, 100, "Initial f(Hz)"}, 1, 100, 1},
{{f1, 1000, "Final f(Hz)"}, 100, 5000, 100},
{{\[Rho], 0, "Ramp up fraction"}, 0, .5}]](https://www.wolframcloud.com/obj/resourcesystem/images/59c/59c57363-e07f-4c1e-b079-8c9a61f5b9ff/4338266c6bfc318c.png) |
| Out[33]= | 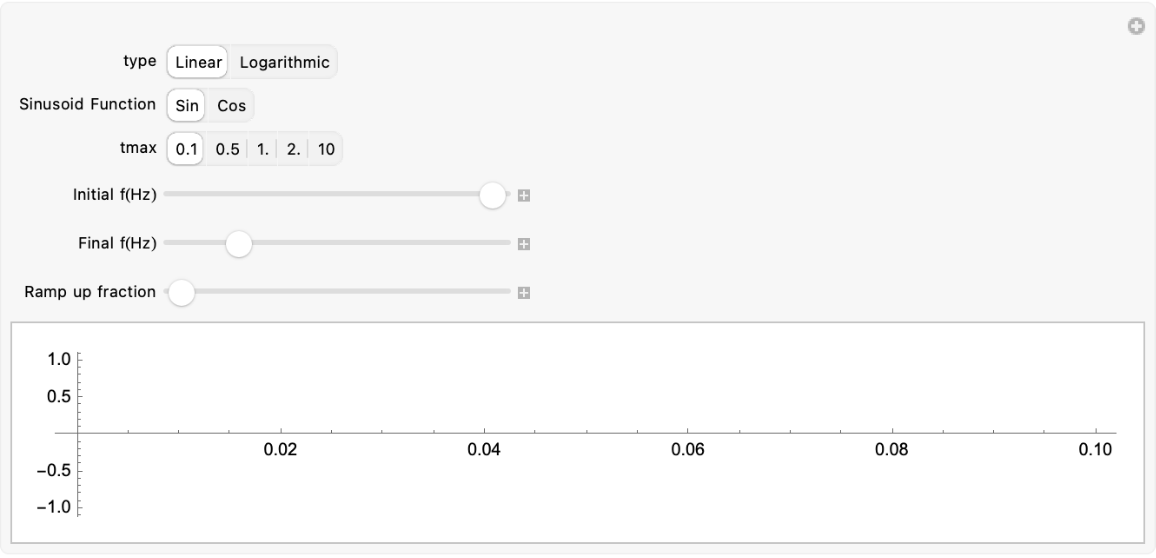 |
Wolfram Language 13.0 (December 2021) or above
This work is licensed under a Creative Commons Attribution 4.0 International License