Wolfram Function Repository
Instant-use add-on functions for the Wolfram Language
Function Repository Resource:
Make Chernoff face diagrams
ResourceFunction["ChernoffFace"][vec] makes a Chernoff face diagram for the numeric vector vec. | |
ResourceFunction["ChernoffFace"][asc] makes a Chernoff face diagram for an Association asc of facial features to numeric values. | |
ResourceFunction["ChernoffFace"][matrix] makes a list of Chernoff face diagrams corresponding to the rows of matrix. | |
ResourceFunction["ChernoffFace"][listOfAssociations] makes a list of Chernoff face diagrams corresponding to the elements of listOfAssociations. | |
ResourceFunction["ChernoffFace"][data,opts] makes Chernoff face diagrams using specified options opts. |
| ColorFunction | None |
| "MakeSymmetric" | Automatic |
| "RescaleRangeFunction" | MinMax |
| "FaceColor" | cf@vec[[1]] |
| "FaceColor" | cf@vec[[1]] |
| "IrisColor" | cf@vec[[2]] |
| "FaceColor" | cf@Mean@vec[[1;;2]] |
| "MouthColor" | cf@Mean@vec[[1;;3]] |
| "IrisColor" | cf@Mean@vec[[4;;6]] |
| "NoseColor" | cf@Mean@vec[[7;;-1]] |
Here is a Chernoff face diagram with a list of random numbers:
| In[1]:= |
| Out[2]= | 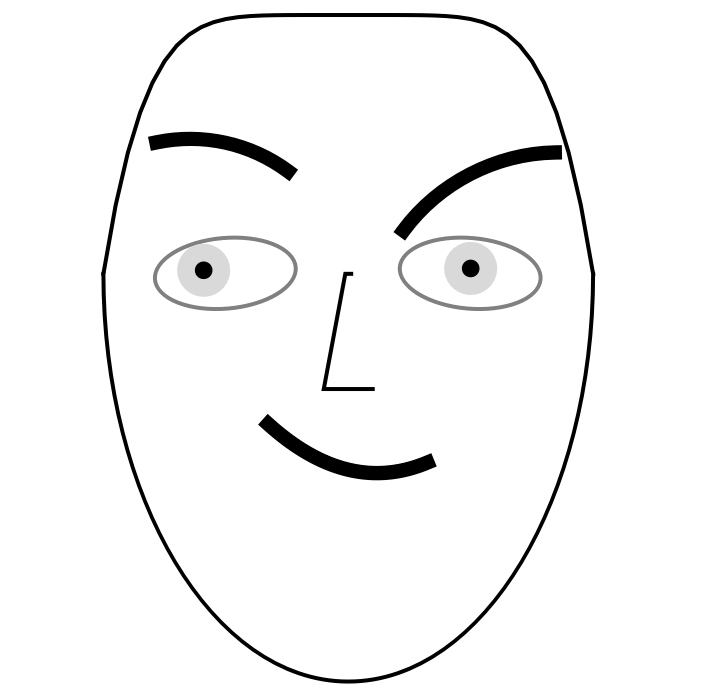 |
Here is another Chernoff face constructed from random data:
| In[3]:= | ![SeedRandom[232];
rvec = RandomReal[{-10, 10}, 12];
ResourceFunction["ChernoffFace"][rvec]](https://www.wolframcloud.com/obj/resourcesystem/images/257/257481ee-f5a4-41a1-8158-ddc47d4af4ae/4d3e0759980a9688.png) |
| Out[5]= | 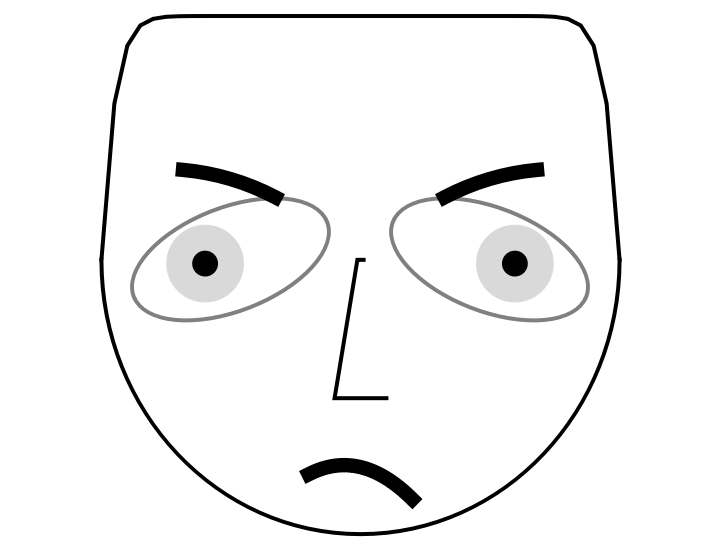 |
If the length of the vector argument is larger than the number of facial features, only the first 17 elements are taken:
| In[6]:= | ![SeedRandom[232];
rvec = RandomReal[{-10, 10}, 300];
ResourceFunction[
"ChernoffFace"] /@ {rvec, Take[rvec, Length[ResourceFunction["ChernoffFace"]["FaceParts"]]]}](https://www.wolframcloud.com/obj/resourcesystem/images/257/257481ee-f5a4-41a1-8158-ddc47d4af4ae/68af2ad07a43376b.png) |
| Out[8]= | 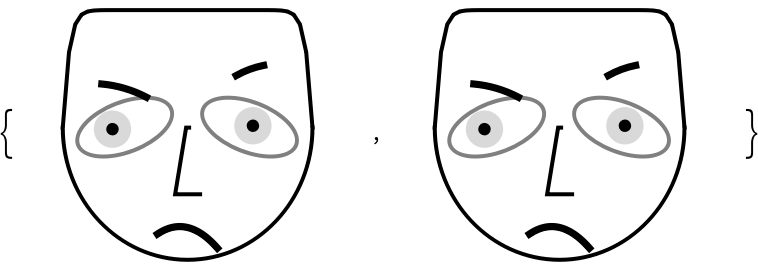 |
| In[9]:= | ![SeedRandom[232];
rvec = RandomReal[{0, 1}, 30];
ResourceFunction["ChernoffFace"][rvec]](https://www.wolframcloud.com/obj/resourcesystem/images/257/257481ee-f5a4-41a1-8158-ddc47d4af4ae/782be31f19df1de5.png) |
| Out[11]= | 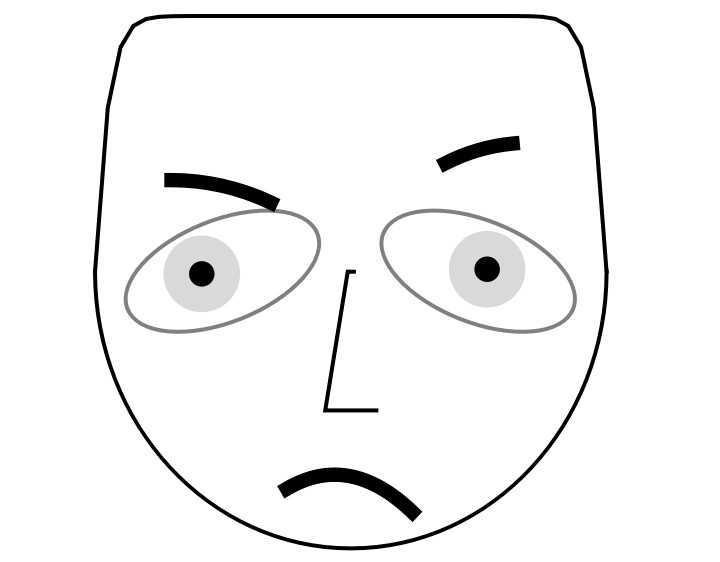 |
Here is a random numeric matrix (a list of vectors):
| In[12]:= |
Visualize the random matrix with Chernoff face diagrams:
| In[13]:= |
| Out[13]= | 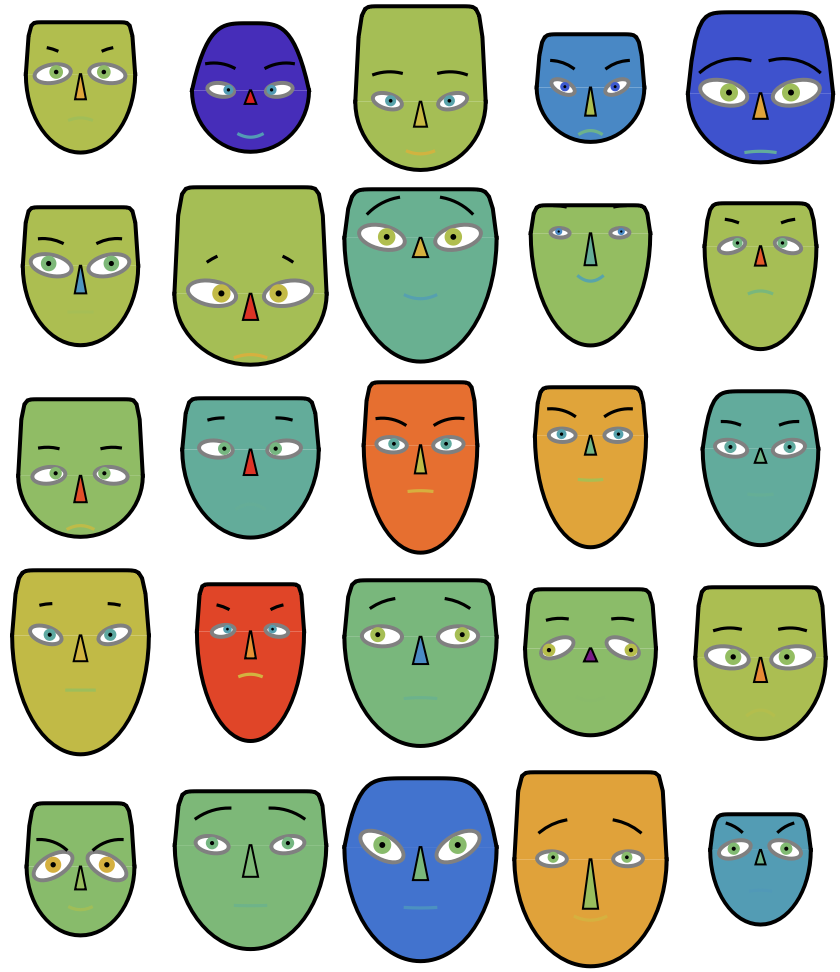 |
Visualize a summary legend that helps the reading of the table of diagrams above:
| In[14]:= |
| Out[14]= | 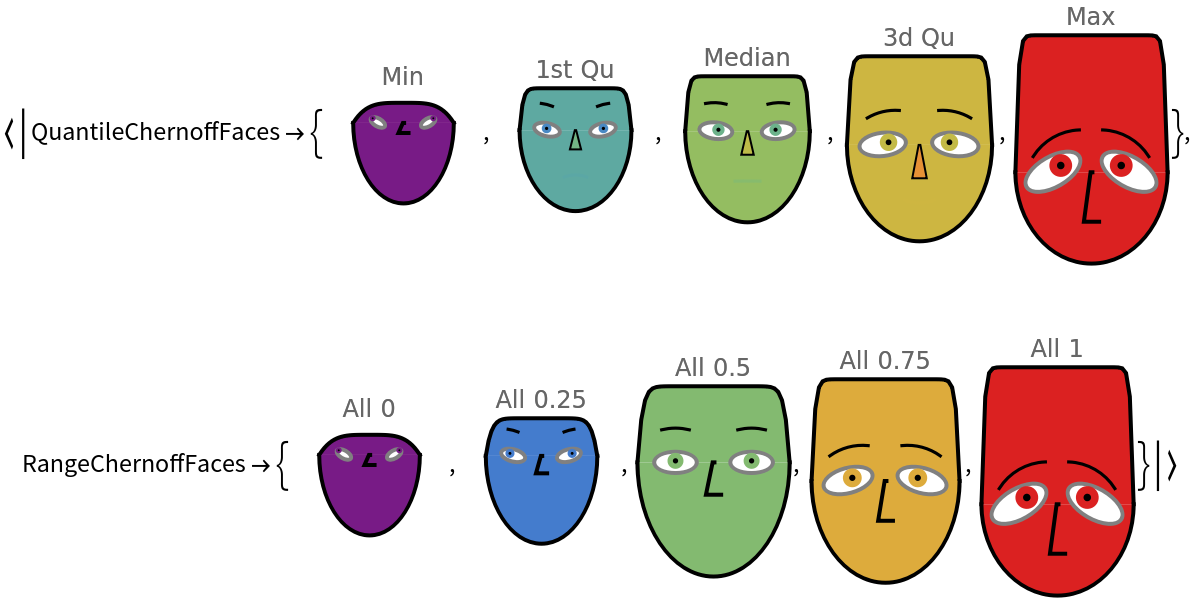 |
The main signature of ChernoffFace is using an association that specifies numerical values for different face parts of the diagram:
| In[15]:= | ![ResourceFunction[
"ChernoffFace"][<|"FaceLength" -> 0.9, "ForeheadShape" -> 0.3, "EyesVerticalPosition" -> 0.1, "EyeSize" -> 0.2, "EyeSlant" -> 1, "LeftEyebrowSlant" -> 0, "LeftIris" -> 0.9|>, ImageSize -> Small]](https://www.wolframcloud.com/obj/resourcesystem/images/257/257481ee-f5a4-41a1-8158-ddc47d4af4ae/37608f300fa3d4d5.png) |
| Out[15]= | 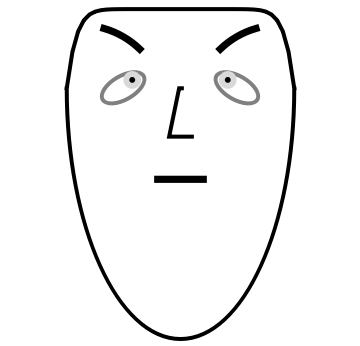 |
The argument association can have specifications for the face part colors and face symmetry:
| In[16]:= | ![ResourceFunction[
"ChernoffFace"][<|"FaceLength" -> 0.9, "ForeheadShape" -> 0.3, "EyesVerticalPosition" -> 0.1, "EyeSize" -> 0.2, "EyeSlant" -> 1, "LeftEyebrowSlant" -> 0, "LeftIris" -> 0.9, "FaceColor" -> LightGreen, "IrisColor" -> Pink, "EyeBallColor" -> Yellow, "MakeSymmetric" -> False|>, ImageSize -> Small]](https://www.wolframcloud.com/obj/resourcesystem/images/257/257481ee-f5a4-41a1-8158-ddc47d4af4ae/05c6abd2395ce728.png) |
| Out[16]= | 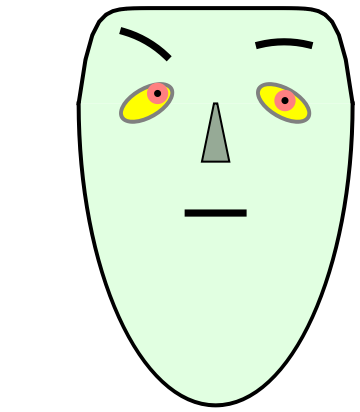 |
The order of the face parts is based on research on which diagram features influence most influence how Chernoff face diagrams are perceived and comprehended.
Given the argument "Properties", a default association for making Chernoff face diagrams is retrieved:
| In[17]:= |
| Out[17]= |  |
Use "FaceParts" or "FacePartsProperties" to get an association with only the face parts:
| In[18]:= |
| Out[18]= |  |
Here are the additional, non-numerical properties (face parts colors and symmetry):
| In[19]:= |
| Out[19]= |
Here is a list of face-part-to-value associations:
| In[20]:= |
| Out[20]= |  |
| In[21]:= |
| Out[21]= | 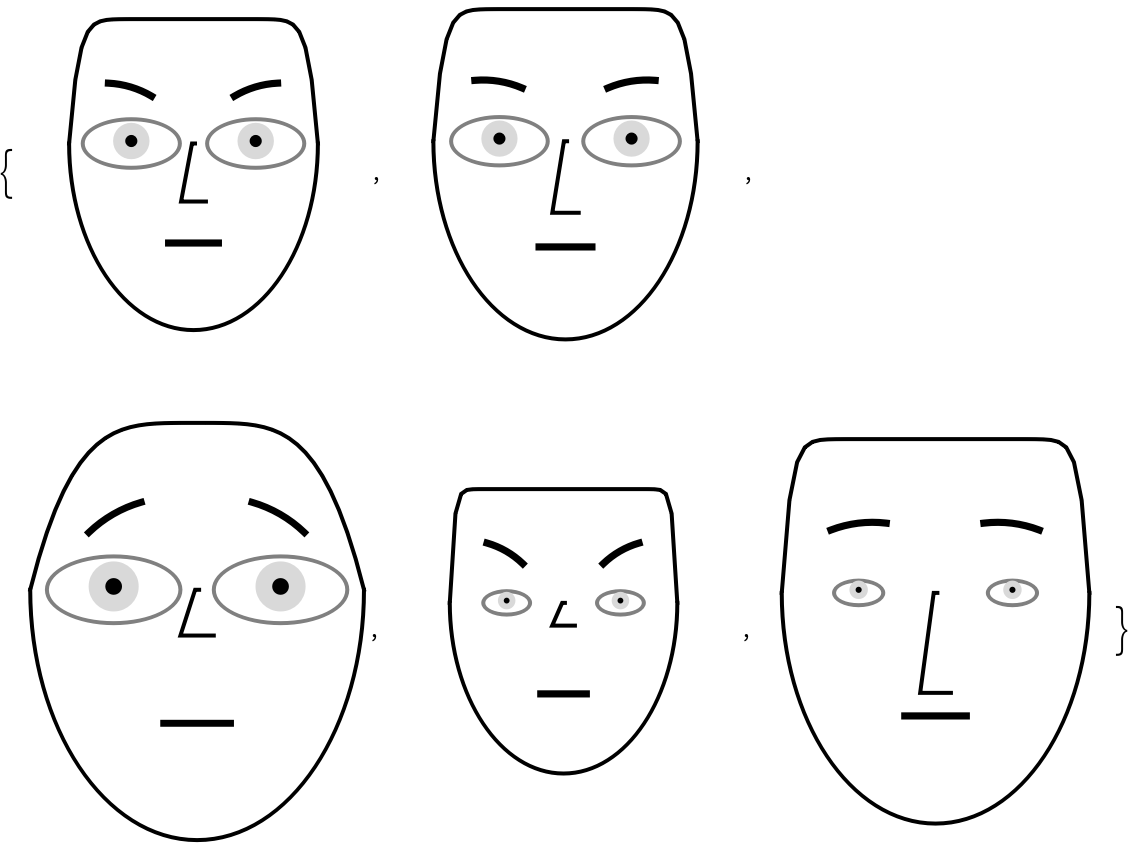 |
Using the option ColorFunction, we can produce different colorings:
| In[22]:= | ![SeedRandom[15];
rvec = RandomReal[{0, 1}, 11];
# -> ResourceFunction["ChernoffFace"][rvec, ColorFunction -> #] & /@ {None, Automatic, "Pastel", ColorData["GrayTones"], ColorData["Rainbow"]}](https://www.wolframcloud.com/obj/resourcesystem/images/257/257481ee-f5a4-41a1-8158-ddc47d4af4ae/33ba608fe564c1f0.png) |
| Out[19]= | 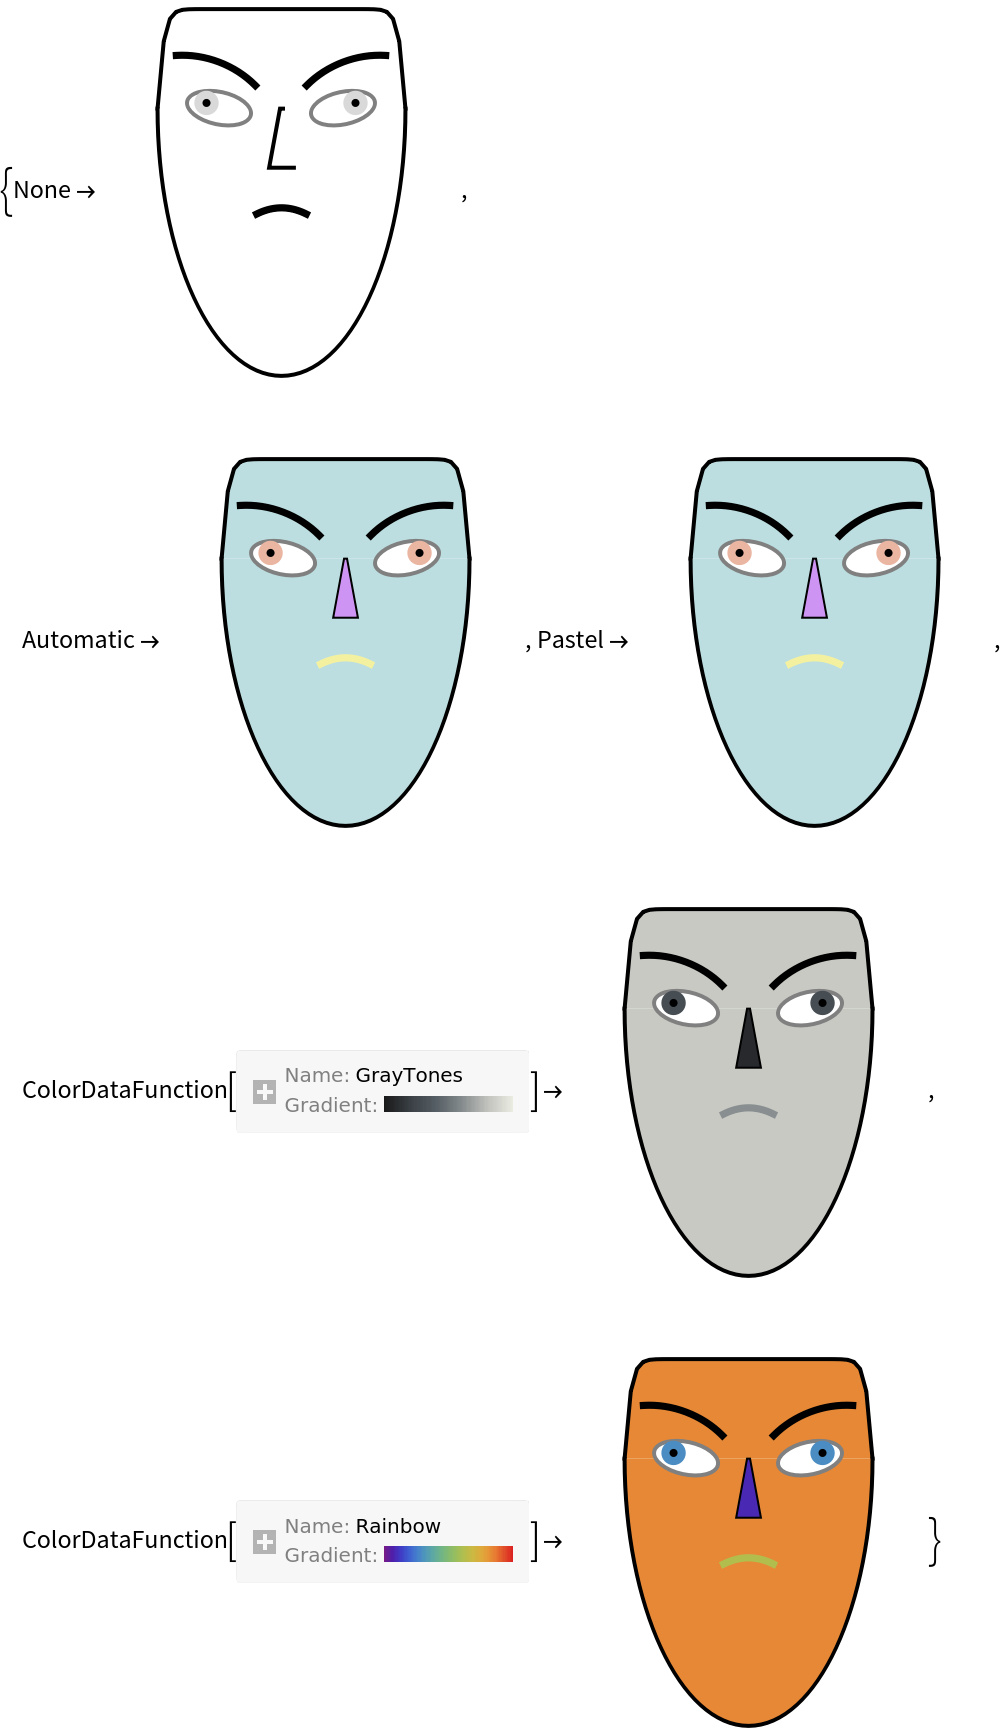 |
The option ColorFunction assigns automatic colors to argument's association keys:
| In[23]:= |
| Out[23]= |
The faces can be made symmetric for shorter records.
Here is a random numeric vector:
| In[24]:= |
Here are diagrams produced with different values for the option "MakeSymmetric":
| In[25]:= |
| Out[25]= |  |
The option "MakeSymmetric" overrides the argument's association value of "MakeSymmetric":
| In[26]:= |
| Out[26]= |
| In[27]:= |
| Out[27]= | 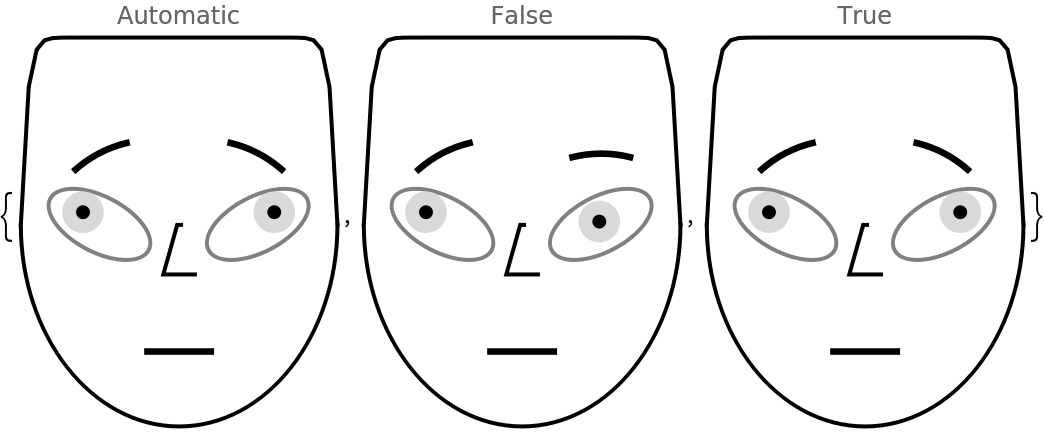 |
If the data argument is a numeric matrix or a list of associations with numeric values, then the data columns are rescaled to run between 0 and 1. The rescaling is done with Rescale using a data-range-finding function specified as a value to the option "RescaleRangeFunction" (the default of which is MinMax).
Here is a random numerical matrix:
| In[28]:= | ![SeedRandom[18];
With[{m = 20, n = 8},
rdata = Transpose[
Table[RandomVariate[
SkewNormalDistribution[RandomReal[{-10, 10}], RandomReal[{3, 10}], RandomReal[{0, 1}]], m], n]]
];](https://www.wolframcloud.com/obj/resourcesystem/images/257/257481ee-f5a4-41a1-8158-ddc47d4af4ae/29a28849488ed586.png) |
Here is a summary of the matrix:
| In[29]:= |
| Out[29]= | 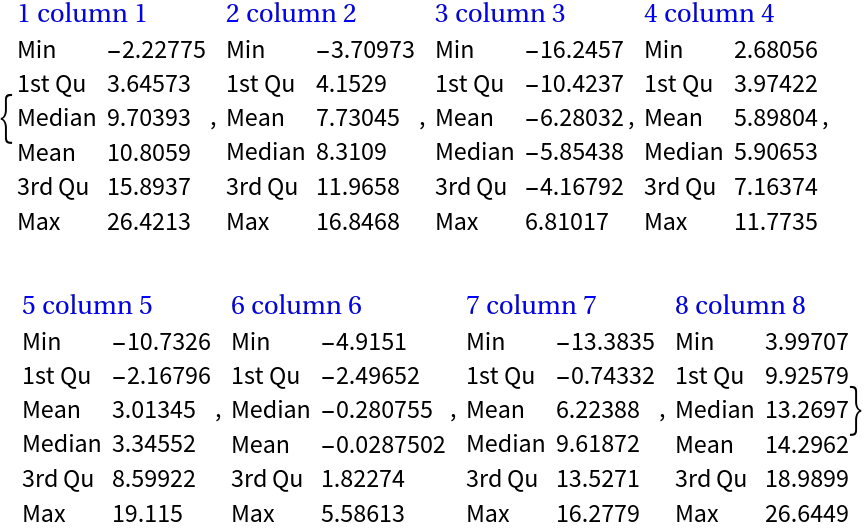 |
Here is a list of Chernoff face diagrams produced with the default value for the option "RescaleRangeFunction":
| In[30]:= |
| Out[30]= | 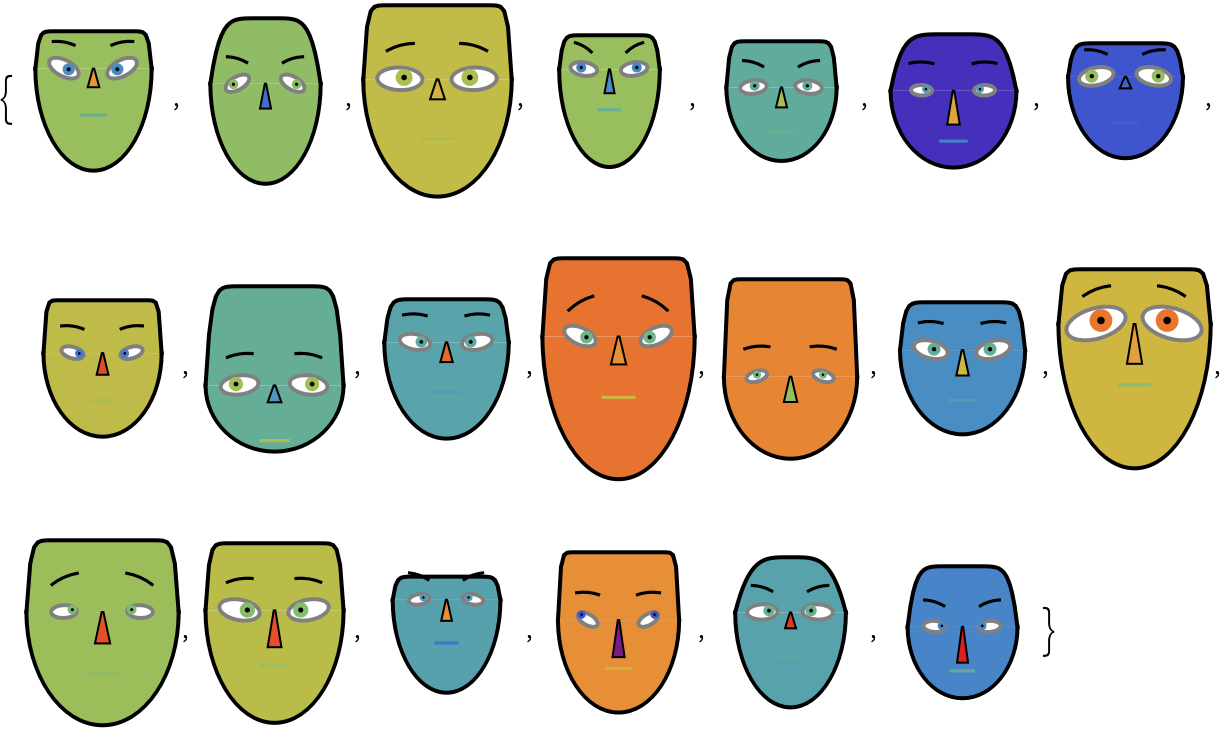 |
Here is a list of Chernoff face diagrams produced by making the ranges of the matrix columns slightly wider than they are:
| In[31]:= |
| Out[31]= | 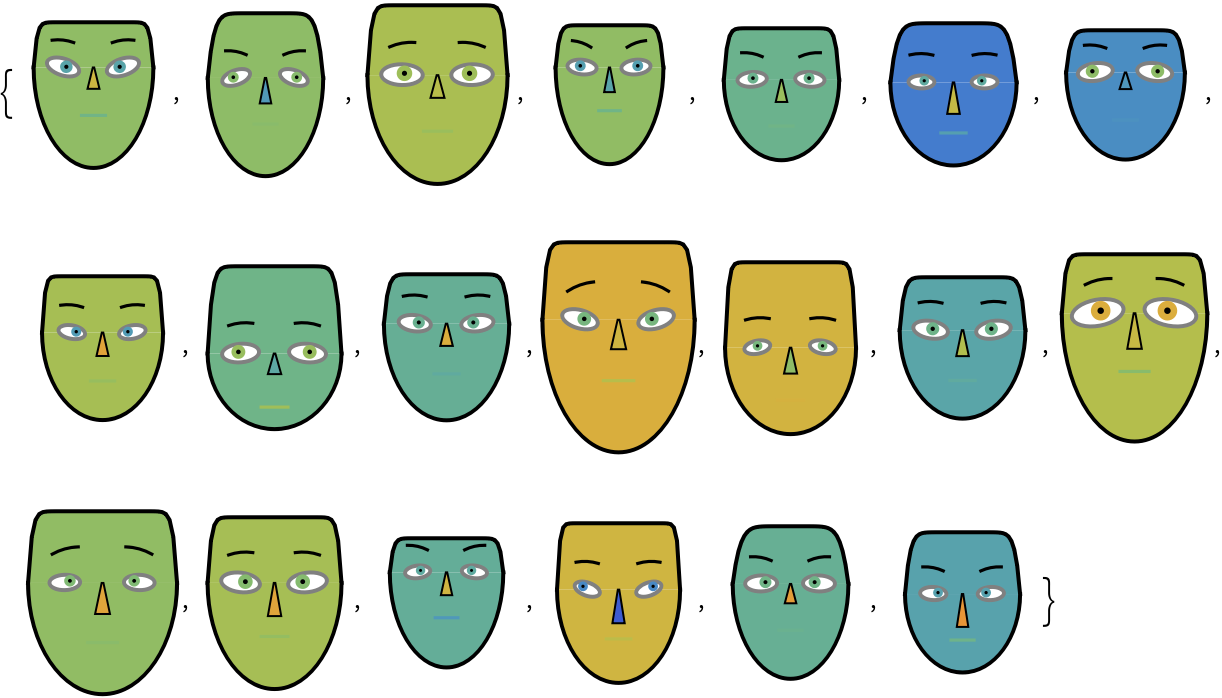 |
In order to study a dataset with Chernoff face diagrams, we have to provide: (1) a list of Chernoff face diagrams; (2) a legend that shows how the face features are mapped to dataset's columns; and (3) a legend that shows Chernoff face diagrams for easy-to-understand instances of the dataset.
Get the "EmployeeAttitude" data:
| In[32]:= |
| Out[21]= |
Get the corresponding column names:
| In[33]:= |
| Out[33]= |
Here is a summary of the dataset:
| In[34]:= |
| Out[34]= | 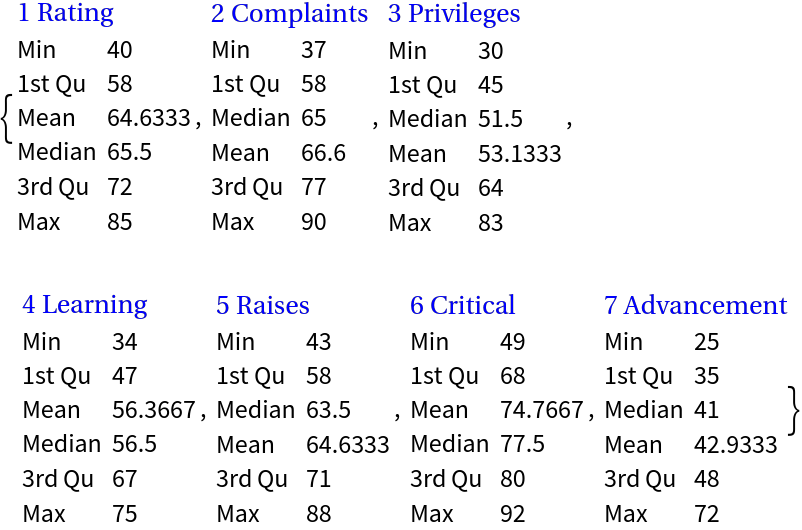 |
Visualize with Chernoff faces:
| In[35]:= | ![Legended[
Grid[Partition[
ResourceFunction["ChernoffFace"][data, ColorFunction -> "Rainbow", ImageSize -> 100], 6], Dividers -> All],
Placed[Framed[
Grid[Thread[{Take[
Keys@ResourceFunction["ChernoffFace"]["FaceParts"], Length[dataColumnNames]], dataColumnNames}], Alignment -> {{Right, Left}}]], "Right"]]](https://www.wolframcloud.com/obj/resourcesystem/images/257/257481ee-f5a4-41a1-8158-ddc47d4af4ae/5a01e211323cdf24.png) |
| Out[35]= | 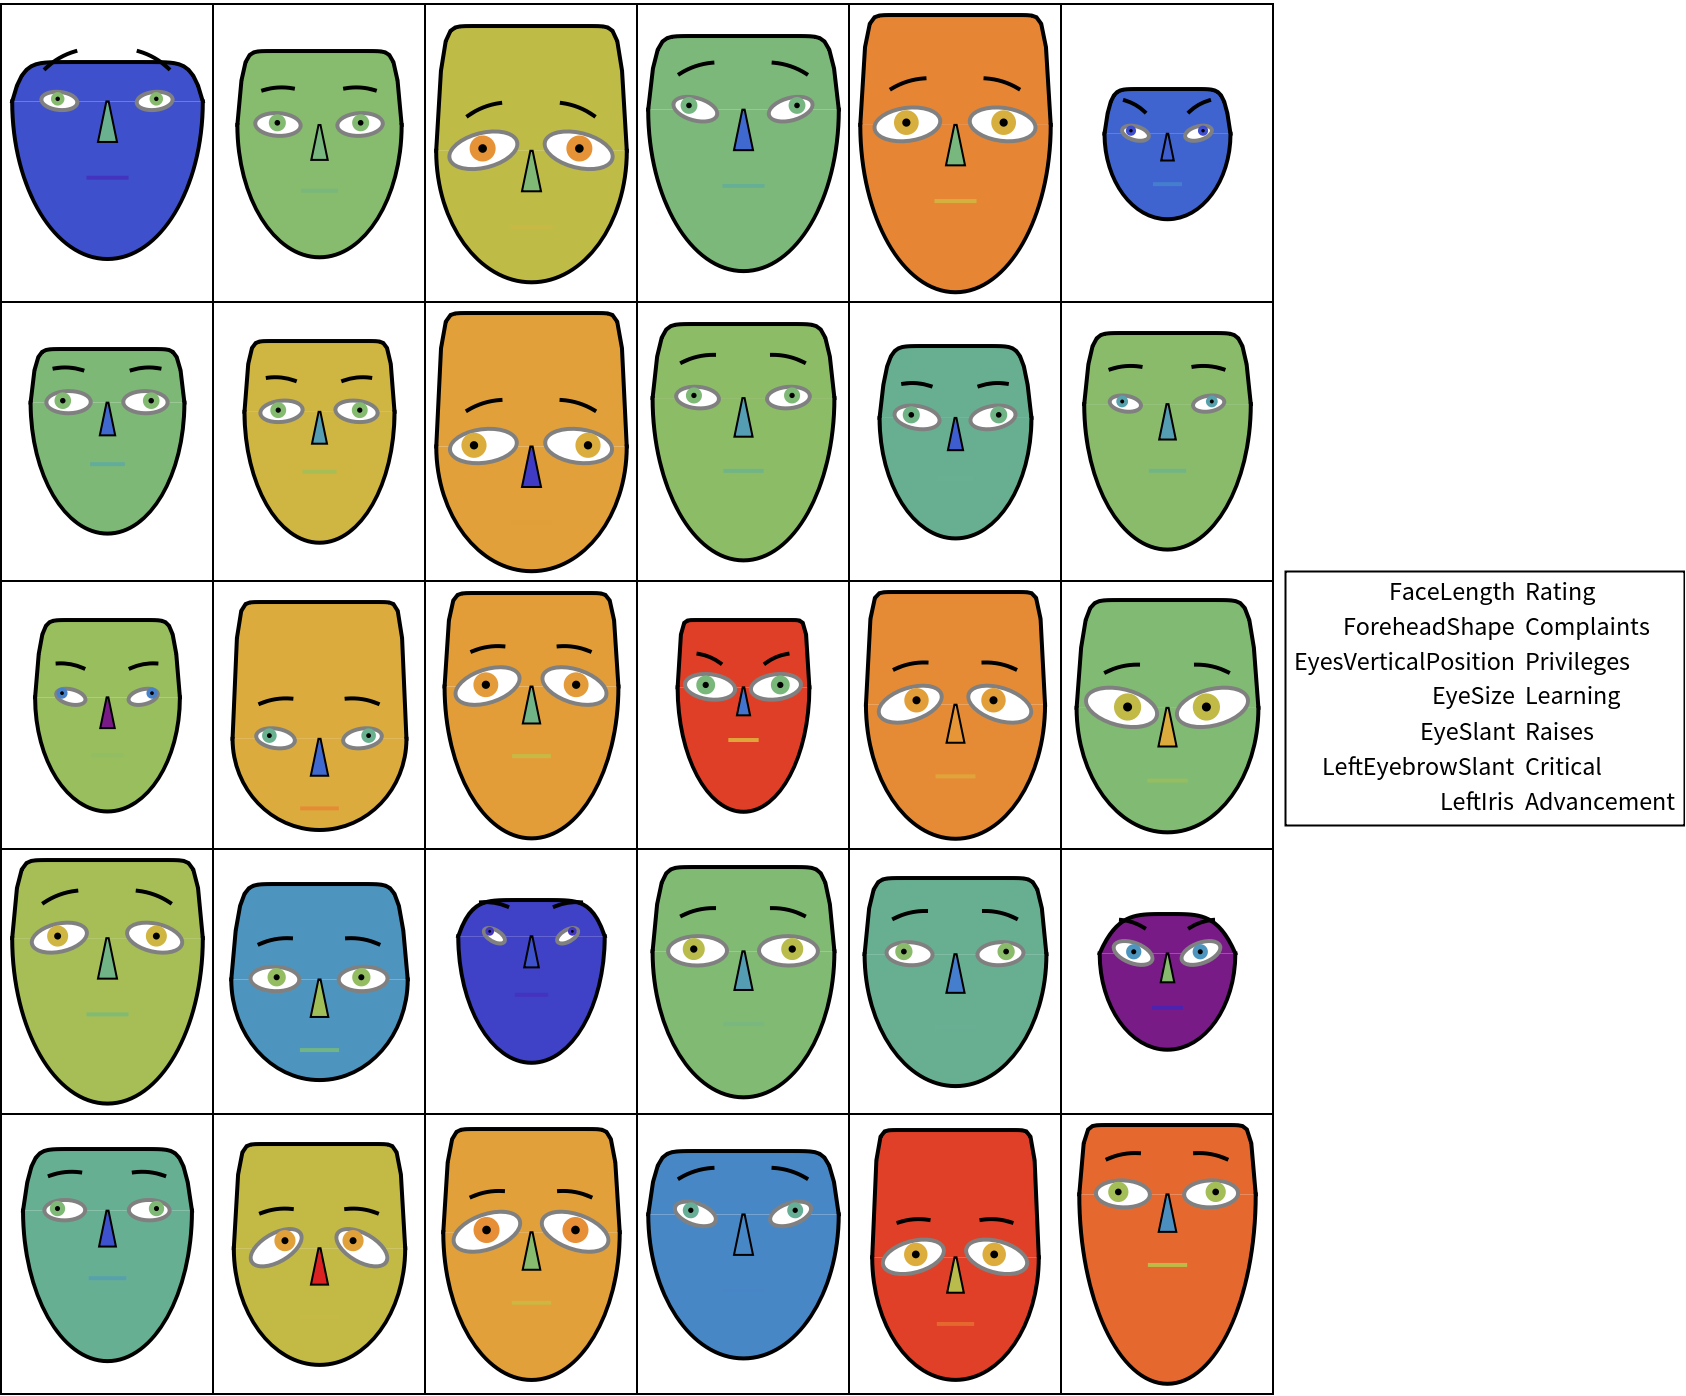 |
Make a table of records summary diagrams:
| In[36]:= | ![Grid[Flatten@*List @@@ Normal[ResourceFunction["ChernoffFace"][data, "RecordsSummary", ImageSize -> 80, ColorFunction -> "Rainbow"]], Dividers -> All]](https://www.wolframcloud.com/obj/resourcesystem/images/257/257481ee-f5a4-41a1-8158-ddc47d4af4ae/3e17dfd2d5f8f14e.png) |
| Out[36]= | 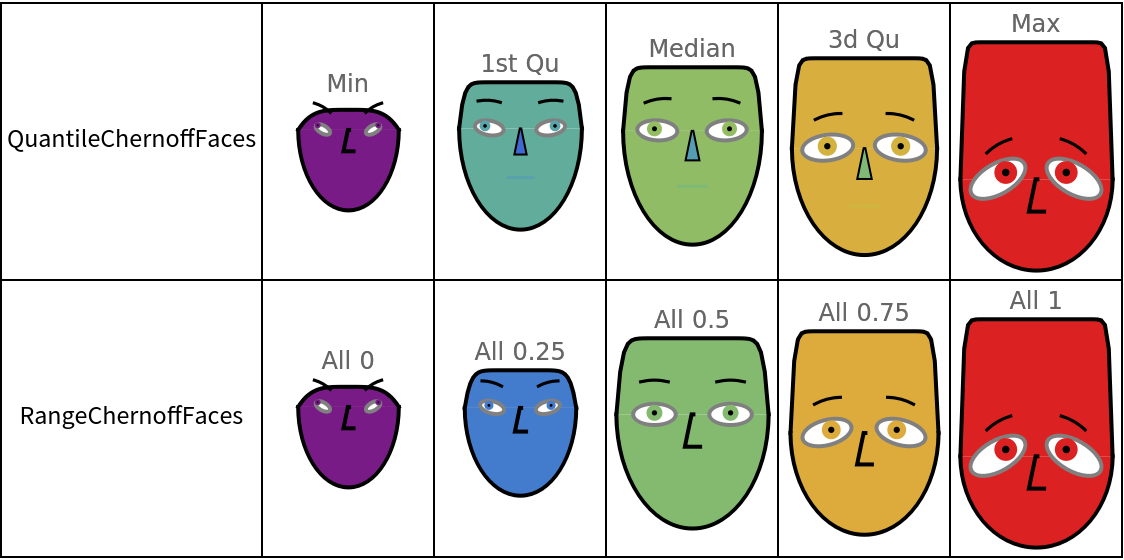 |
We can see that: (1) higher learning is associated with higher ratings; (2) the higher the privileges, the higher the ratings. Other observations can also be made.
It is a good idea to compare the diagrams made with ChernoffFace to diagrams made with SectorChart:
| In[37]:= | ![SeedRandom[1612]
rmat = Transpose@
Table[RandomVariate[
SkewNormalDistribution[RandomReal[{1, 10}], RandomReal[{1, 4}], RandomReal[{0.2, 0.8}]], 12], 5];
Multicolumn[
Map[Row[{Image[
ResourceFunction["ChernoffFace"][#, ColorFunction -> "Pastel"], ImageSize -> 80], Image[SectorChart[Transpose[{Range[Length[#]], #}], ChartLabels -> Placed[Range[Length[#]], "RadialOutside"]], ImageSize -> 120]}] &, Rescale /@ rmat], 4, Dividers -> All]](https://www.wolframcloud.com/obj/resourcesystem/images/257/257481ee-f5a4-41a1-8158-ddc47d4af4ae/748d72ef37014bb3.png) |
| Out[33]= | 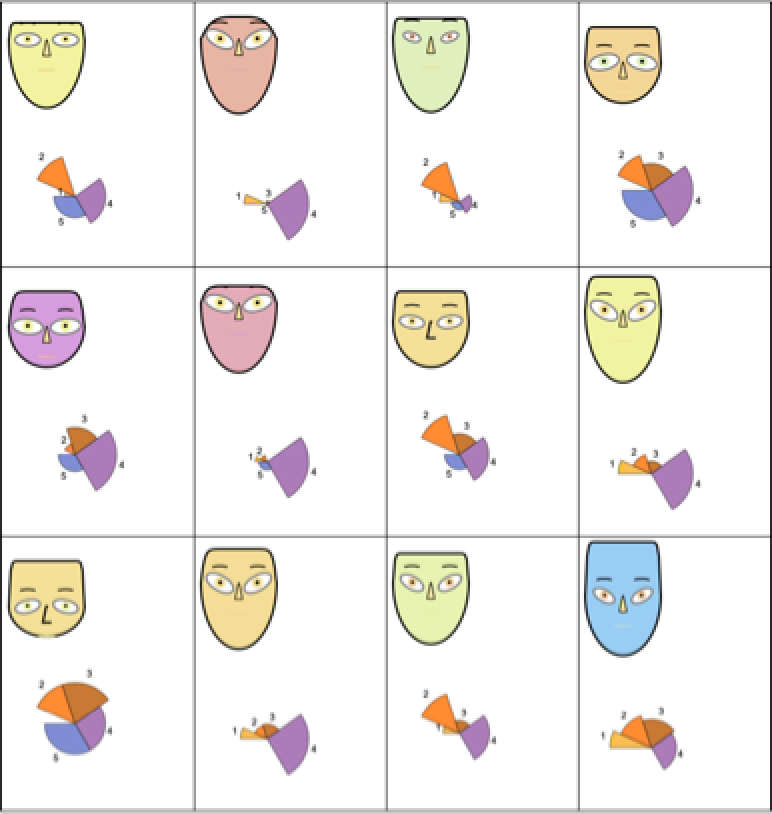 |
ChernoffFace invoked over an association or a list of numbers rescales the values of the argument data to run from 0 to 1 over the range Min[data]to Max[data]. ChernoffFace called on a list of associations or a matrix rescales the columns of the corresponding full array. Hence, in general, the diagrams produced by invoking ChernoffFace record-wise over a list of records are different from the diagrams produced by invoking ChernoffFace over the whole data set of records.
Here is a random numeric matrix (list of records):
| In[38]:= |
Here are Chernoff face diagrams made separately for each record:
| In[39]:= |
| Out[39]= | 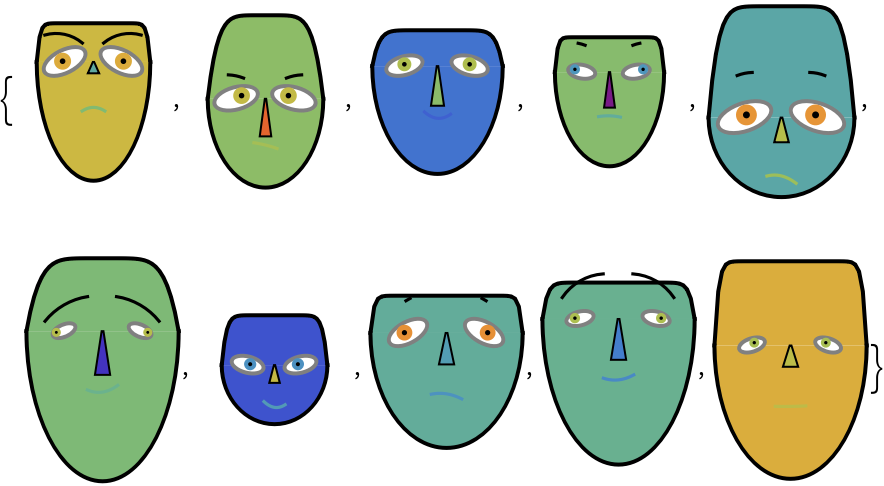 |
Here are Chernoff face diagrams made for the whole array:
| In[40]:= |
| Out[40]= | 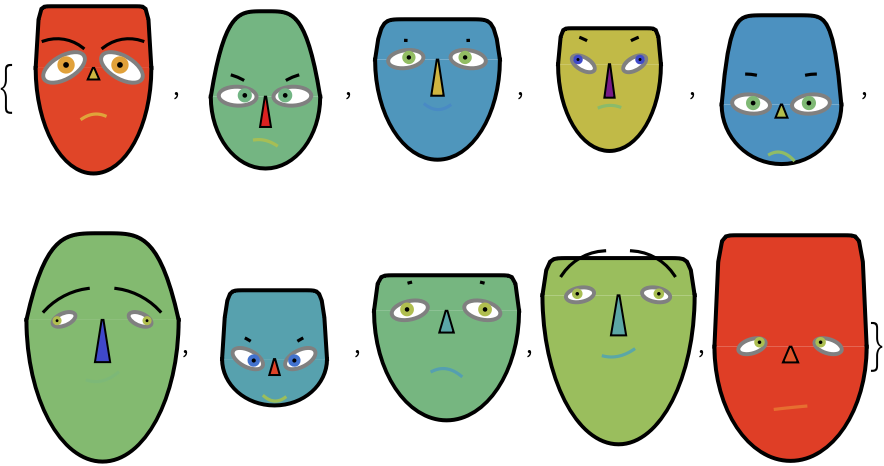 |
We see that although the diagrams from the two lists are similar, they also have notable differences. With different data distributions, the differences will be greater or smaller.
The same data visualized with different color schemes might make certain items or features more obscure or more prominent.
Using the "BrightBands" color scheme makes all diagrams to look unique:
| In[41]:= |
| Out[41]= | 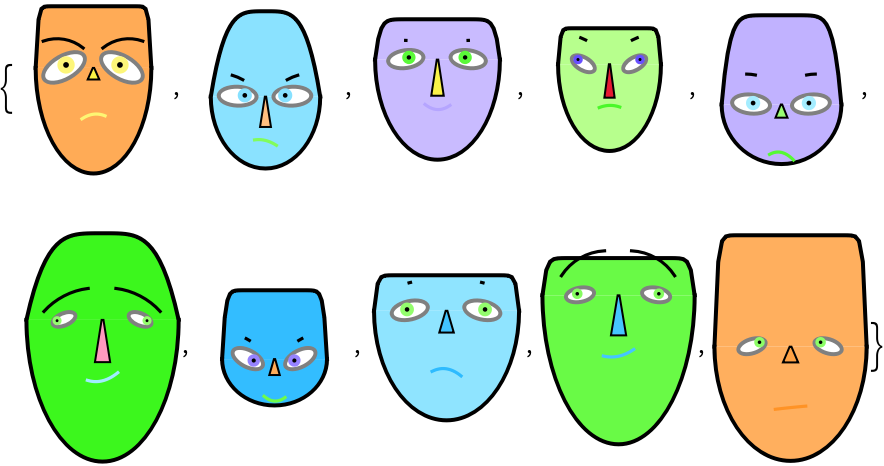 |
Using the "WatermelonColors" color scheme over the same data makes the first and the last diagram to stand out:
| In[42]:= |
| Out[42]= | 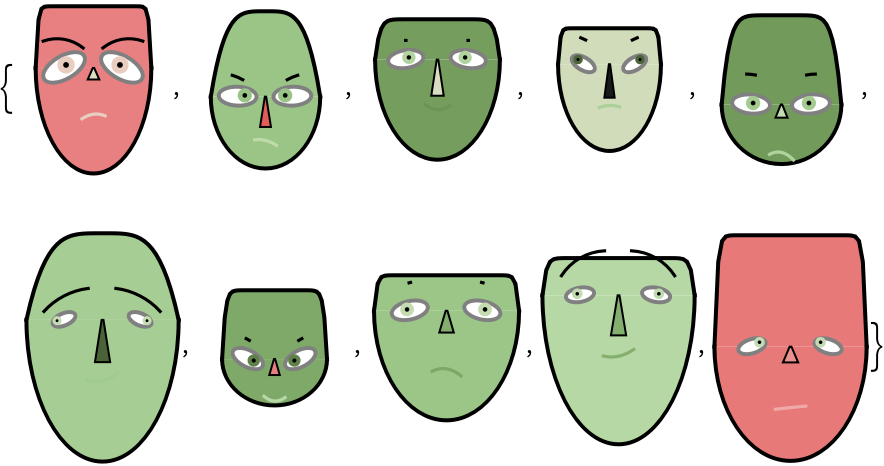 |
A table of random Chernoff faces:
| In[43]:= | ![SeedRandom[7783];
Grid[Table[
ResourceFunction["ChernoffFace"][
ColorFunction -> RandomChoice[{"Rainbow", "BrightBands", "WatermelonColors", "TemperatureMap"}], "MakeSymmetric" -> RandomChoice[{True, False}], ImageSize -> Tiny], {6}, {6}]]](https://www.wolframcloud.com/obj/resourcesystem/images/257/257481ee-f5a4-41a1-8158-ddc47d4af4ae/549165ebfe113389.png) |
| Out[42]= | 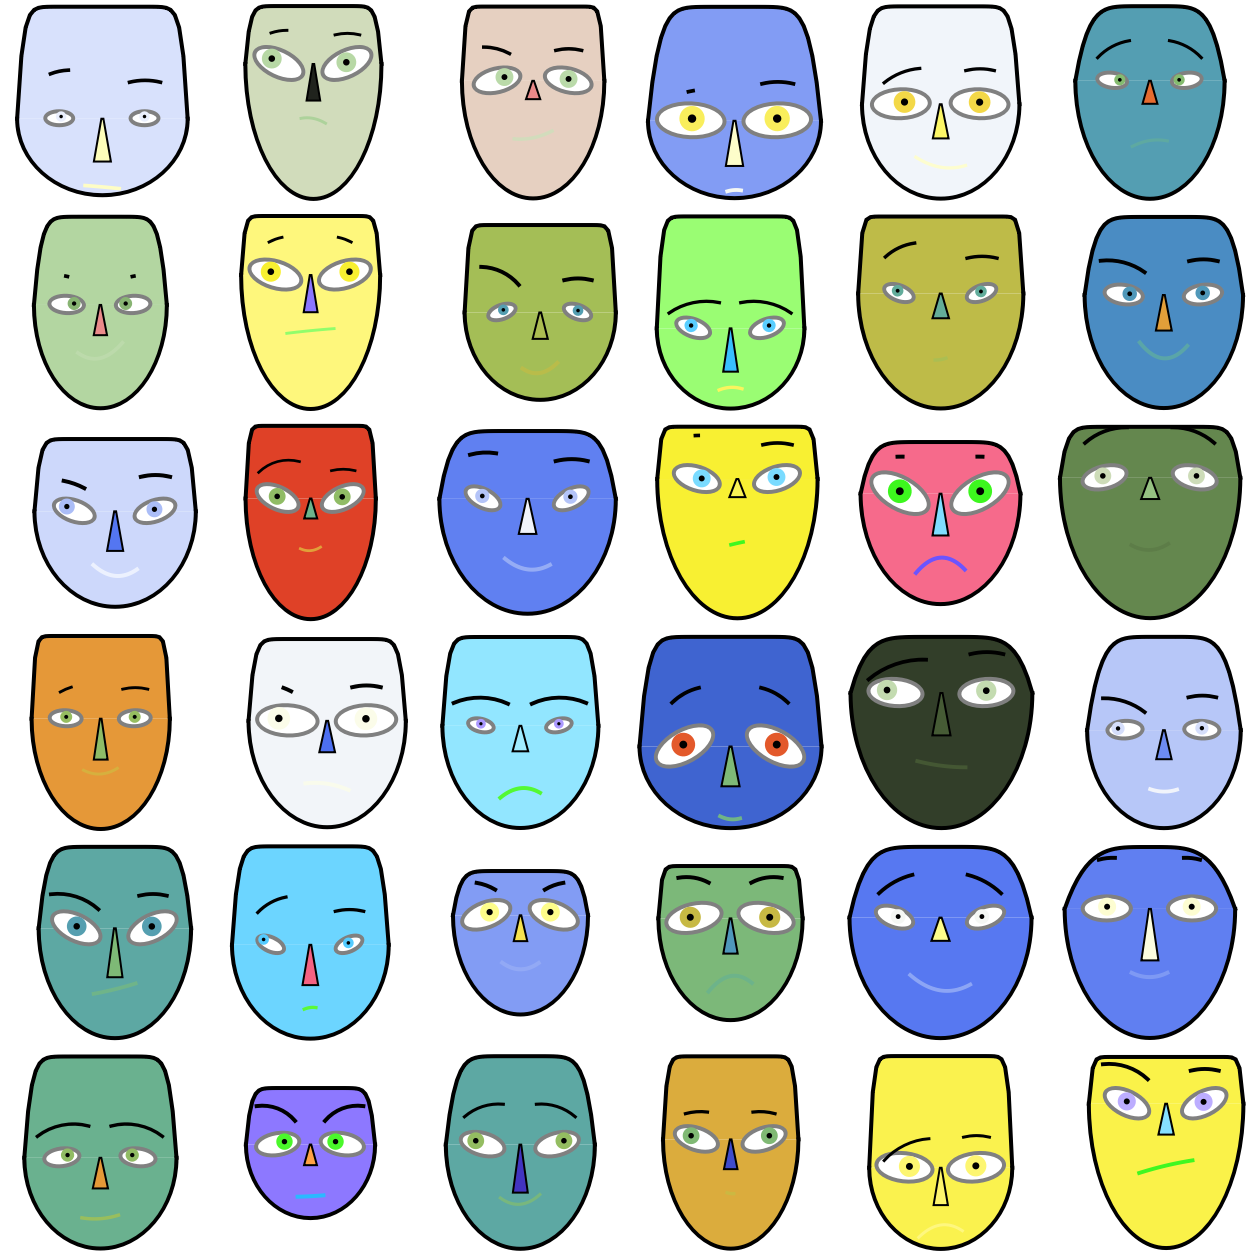 |
This work is licensed under a Creative Commons Attribution 4.0 International License