Wolfram Function Repository
Instant-use add-on functions for the Wolfram Language
Function Repository Resource:
Add a legend with checkboxes to a plot that toggles individual datasets on and off dynamically
ResourceFunction["CheckboxLegended"][func[<|lbl1→ item1,lbl2→item2,…|>,…]] returns the plot generated by func with plot legends that include checkboxes for showing and hiding individual plotted items. | |
ResourceFunction["CheckboxLegended"][func[…],Dynamic[var]] links the visibility of the datasets to variable var. |
Add a Checkbox legend to a ListPlot:
| In[1]:= | ![dataset = <|"Dataset1" -> Range[10], "Dataset2" -> Range[10, 1, -1]|>;
ResourceFunction["CheckboxLegended"][
ListPlot[dataset]
]](https://www.wolframcloud.com/obj/resourcesystem/images/858/858ee8bf-0a9f-4c40-bd5f-43b11f51cc78/4eaf5ab788d35dfc.png) |
| Out[2]= | 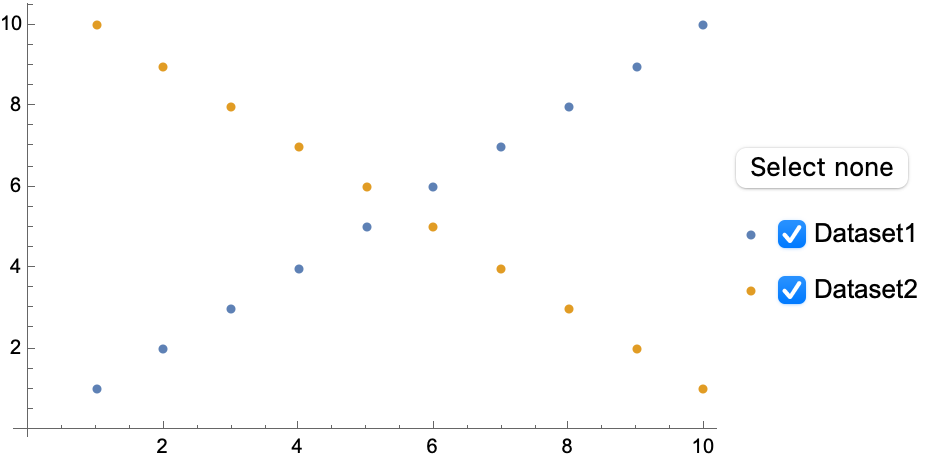 |
The options of ListPlot can still be used to specify your own styles:
| In[3]:= | ![ResourceFunction["CheckboxLegended"][
ListPlot[dataset, PlotStyle -> {Red, Blue}]
]](https://www.wolframcloud.com/obj/resourcesystem/images/858/858ee8bf-0a9f-4c40-bd5f-43b11f51cc78/65367c1609bcc776.png) |
| Out[3]= | 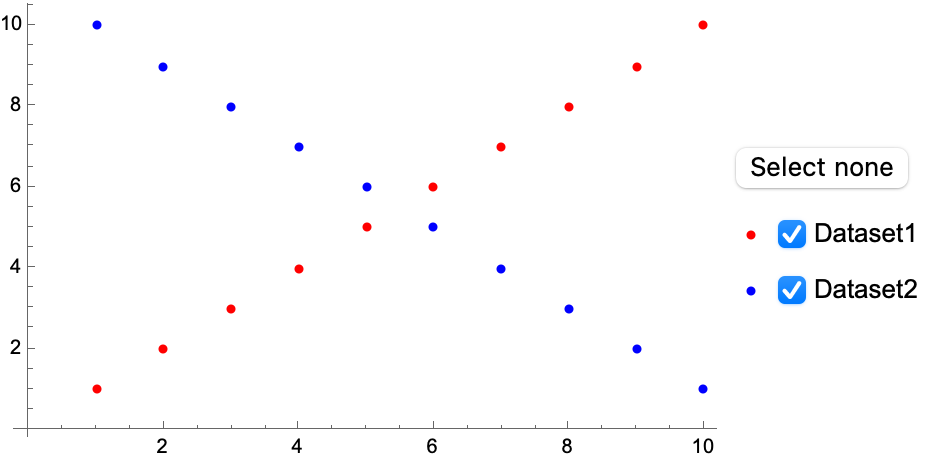 |
Use it with Plot:
| In[4]:= | ![ResourceFunction["CheckboxLegended"][
Plot[<|HoldForm[x] -> x, HoldForm[x^2] -> x^2, HoldForm[Sin[x]] -> Sin[x] |>, {x, 0, Pi}]
]](https://www.wolframcloud.com/obj/resourcesystem/images/858/858ee8bf-0a9f-4c40-bd5f-43b11f51cc78/7b362b9114a4e3a1.png) |
| Out[4]= | 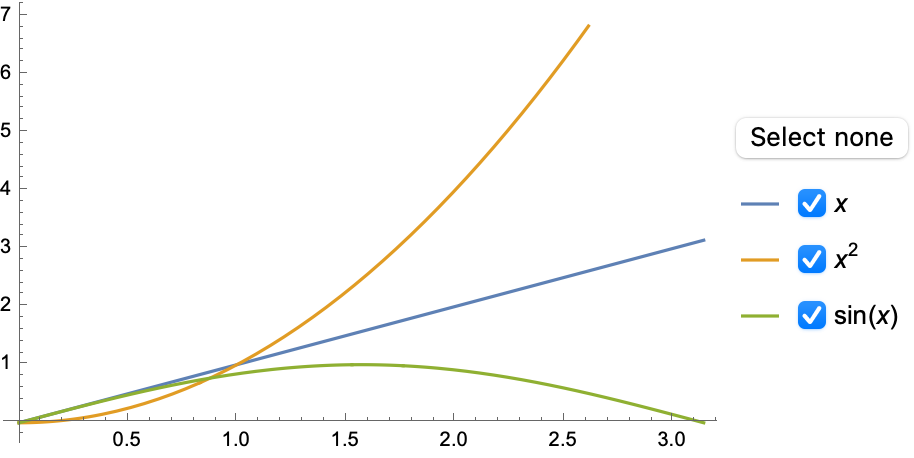 |
With BubbleChart:
| In[5]:= | ![ResourceFunction["CheckboxLegended"][
BubbleChart[
AssociationThread[Range[Length[#]], #] &@RandomReal[1, {5, 7, 3}]
]
]](https://www.wolframcloud.com/obj/resourcesystem/images/858/858ee8bf-0a9f-4c40-bd5f-43b11f51cc78/389e2489d84a1959.png) |
| Out[5]= | 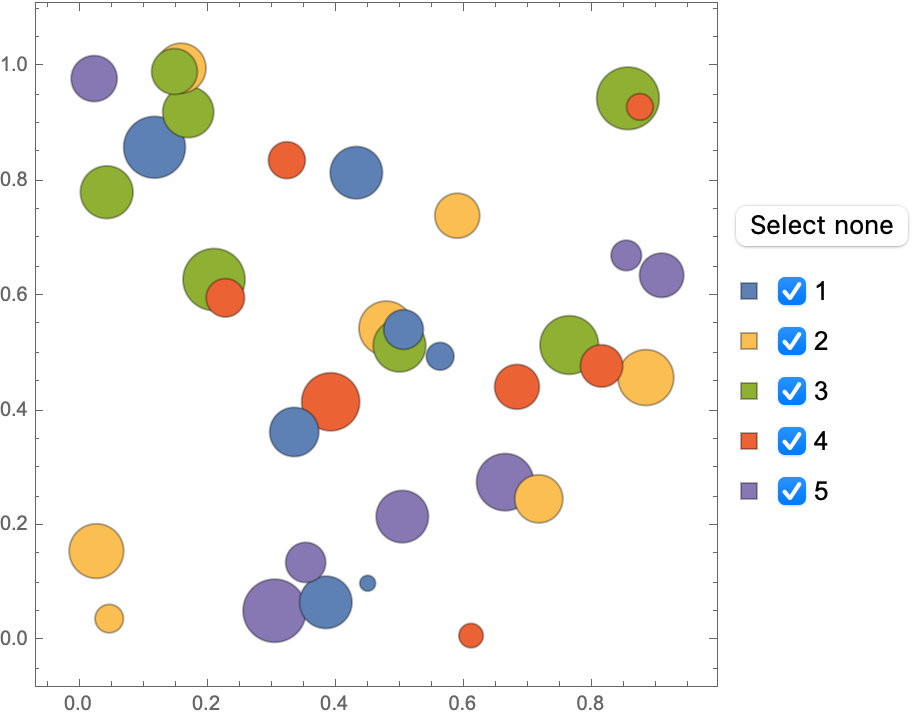 |
Link the visibility of datasets to a variable:
| In[6]:= | ![DynamicModule[{plotActive},
Column[{
ResourceFunction["CheckboxLegended"][
BubbleChart[
AssociationThread[Range[Length[#]], #] &@
RandomReal[1, {5, 7, 3}]
],
Dynamic[plotActive]
],
Dynamic[plotActive]
}
]
]](https://www.wolframcloud.com/obj/resourcesystem/images/858/858ee8bf-0a9f-4c40-bd5f-43b11f51cc78/6b4fd9cb7de38da1.png) |
| Out[6]= | 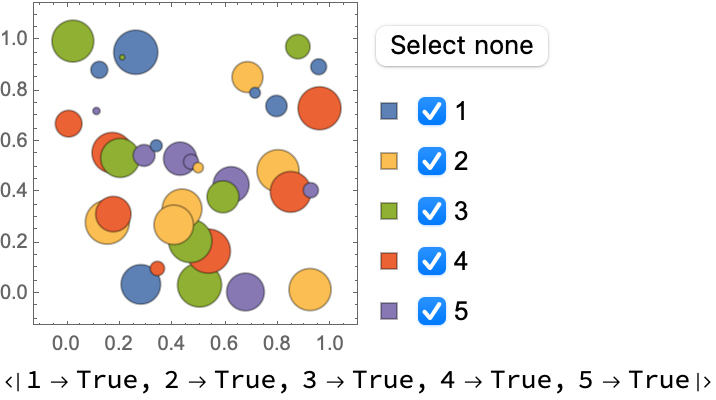 |
Other data wrappers will remain functional:
| In[7]:= | ![Clear[x];
ResourceFunction["CheckboxLegended"][
Plot[<|HoldForm[x] -> Callout[x, "x", Above], HoldForm[x^2] -> Style[x^2, Red] |>, {x, 0, 1}]
]](https://www.wolframcloud.com/obj/resourcesystem/images/858/858ee8bf-0a9f-4c40-bd5f-43b11f51cc78/6a1789450dedf4d4.png) |
| Out[8]= | 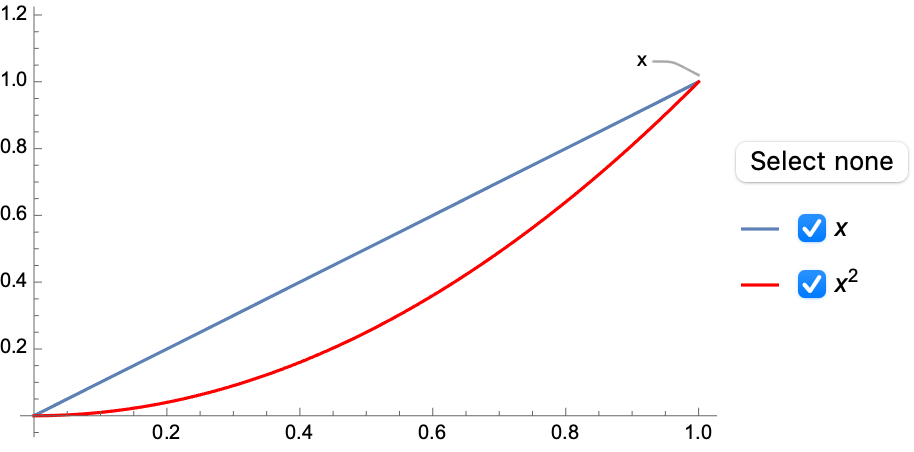 |
Use the "LegendLayoutFunction" option to style the legend:
| In[9]:= | ![ResourceFunction["CheckboxLegended"][
BubbleChart[
AssociationThread[Range[Length[#]], #] &@RandomReal[1, {5, 7, 3}]
],
"LegendLayoutFunction" -> Function[{checkbox, label}, Framed[Column[{label, checkbox }]]]
]](https://www.wolframcloud.com/obj/resourcesystem/images/858/858ee8bf-0a9f-4c40-bd5f-43b11f51cc78/665f0220c4f067c4.png) |
| Out[9]= | 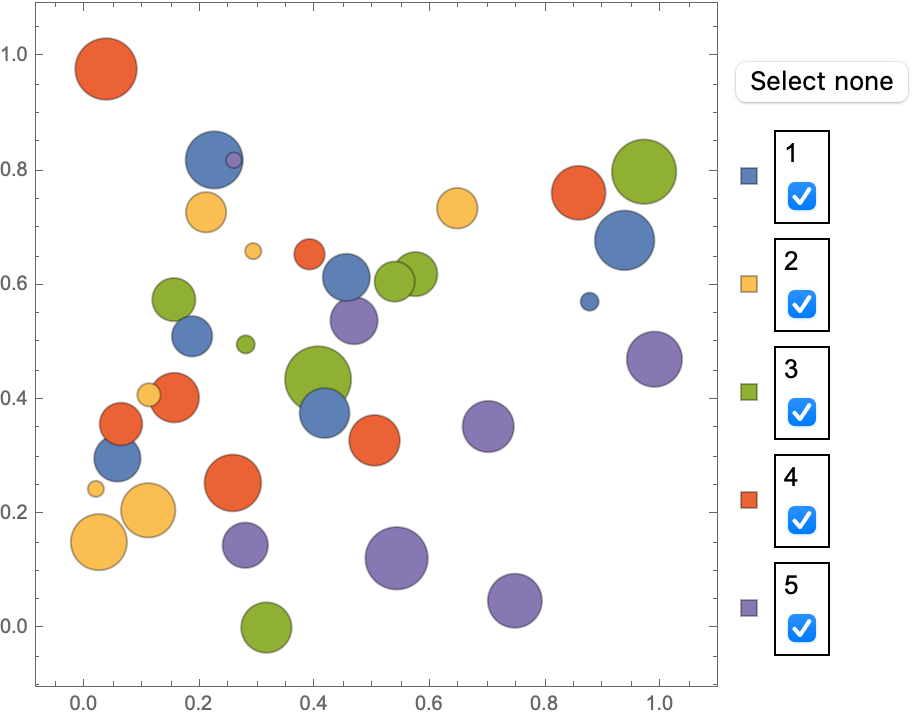 |
Normally, Plot localizes variables:
| In[10]:= |
| Out[11]= | 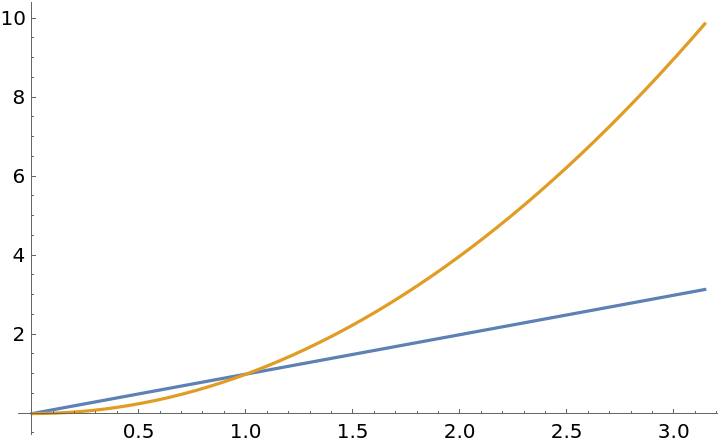 |
CheckboxLegended evaluates the plotting data before Plot, thereby undoing the localization:
| In[12]:= | ![x = 1;
ResourceFunction["CheckboxLegended"][
Plot[<|HoldForm[x] -> x, HoldForm[x^2] -> x^2 |>, {x, 0, Pi}]
]](https://www.wolframcloud.com/obj/resourcesystem/images/858/858ee8bf-0a9f-4c40-bd5f-43b11f51cc78/41cb19ba28c23241.png) |
| Out[13]= | 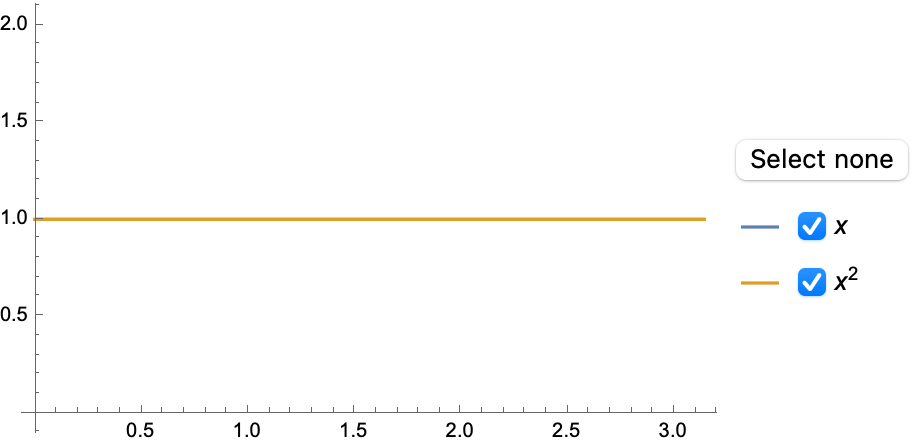 |
Use Block to circumvent this issue:
| In[14]:= | ![x = 1;
Block[{x}, ResourceFunction["CheckboxLegended"][
Plot[<|HoldForm[x] -> x, HoldForm[x^2] -> x^2 |>, {x, 0, Pi}]
]
]](https://www.wolframcloud.com/obj/resourcesystem/images/858/858ee8bf-0a9f-4c40-bd5f-43b11f51cc78/0e511ad84aa2150f.png) |
| Out[15]= | 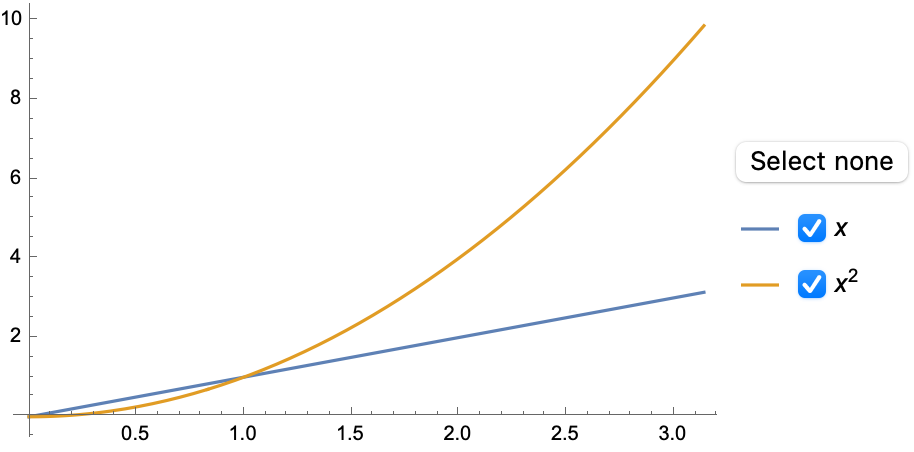 |
If you don’t specify the linking variable, CheckboxLegended will return a DynamicModule that cannot be combined with other graphics using Show:
| In[16]:= | ![ResourceFunction["CheckboxLegended"][
ListPlot[<|1 -> Range[5]|>]
]](https://www.wolframcloud.com/obj/resourcesystem/images/858/858ee8bf-0a9f-4c40-bd5f-43b11f51cc78/39a0a0cb76fe760b.png) |
| Out[16]= | 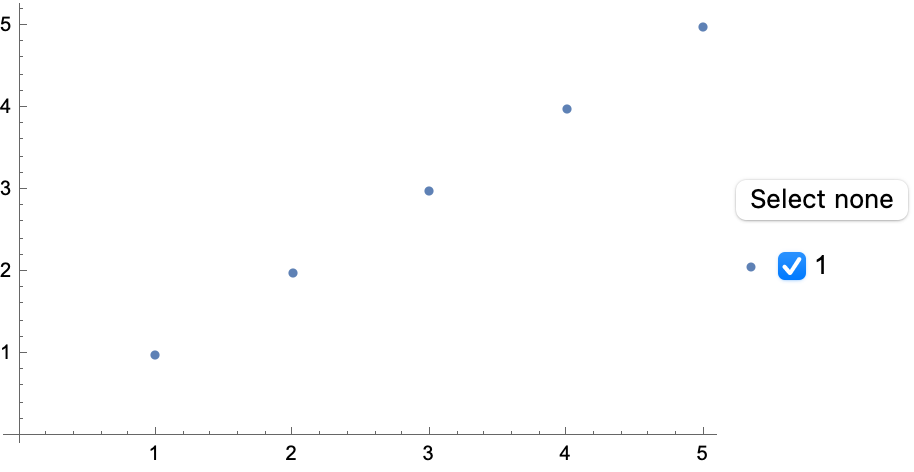 |
The output is a DynamicModule:
| In[17]:= |
| Out[17]= |
Therefore, Show cannot combine it with other graphics:
| In[18]:= |
| Out[18]= | 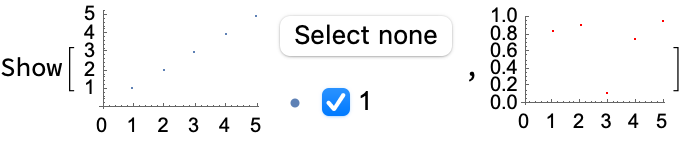 |
To combine graphics, use the optional second argument:
| In[19]:= | ![DynamicModule[{
visibleQ
},
Show[
ResourceFunction["CheckboxLegended"][
ListPlot[<|1 -> Range[5]|>],
Dynamic[visibleQ]
],
ListPlot[Abs@Sin[Range[5]], PlotStyle -> Red]
]
]](https://www.wolframcloud.com/obj/resourcesystem/images/858/858ee8bf-0a9f-4c40-bd5f-43b11f51cc78/172d611c62c33d2c.png) |
| Out[19]= | 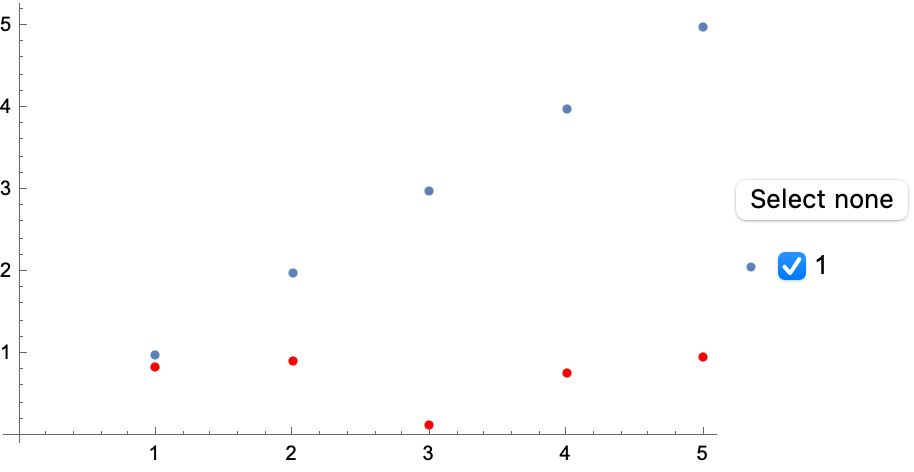 |
When combining multiple wrappers, make sure that Style is on the outside. The checkboxes will not work if the Style wrapper is deeper inside:
| In[20]:= | ![Clear[x]
ResourceFunction["CheckboxLegended"][
Plot[<|HoldForm[x] -> Callout[x, "x", Above], HoldForm[x^2] -> Callout[Style[x^2, Red], ("x")^2, Right] |>, {x, 0, 1},
PlotLabel -> "Checkbox broken"]
]](https://www.wolframcloud.com/obj/resourcesystem/images/858/858ee8bf-0a9f-4c40-bd5f-43b11f51cc78/19ae97af8df6728f.png) |
| Out[21]= |  |
It will work when it’s the outermost wrapper:
| In[22]:= | ![ResourceFunction["CheckboxLegended"][
Plot[<|HoldForm[x] -> Callout[x, "x", Above], HoldForm[x^2] -> Style[Callout[x^2, ("x")^2, Right], Red] |>, {x, 0, 1},
PlotLabel -> "Checkboxes work"
]
]](https://www.wolframcloud.com/obj/resourcesystem/images/858/858ee8bf-0a9f-4c40-bd5f-43b11f51cc78/2b77212324df6fb7.png) |
| Out[22]= | 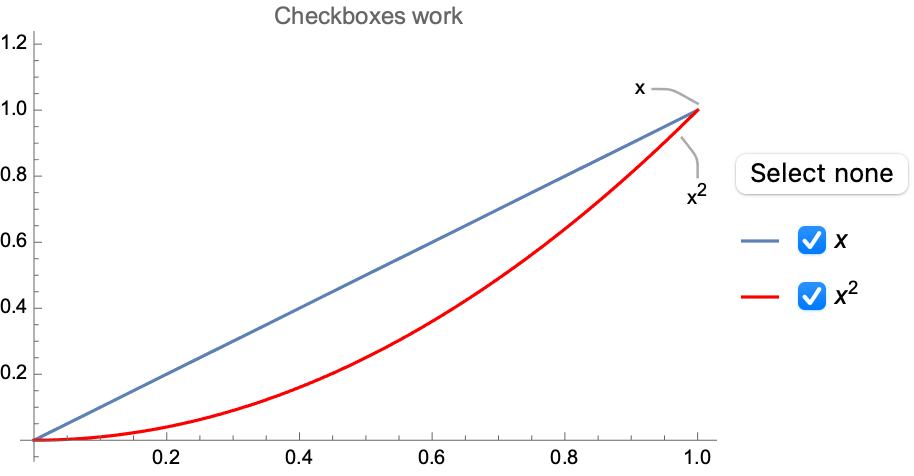 |
Wolfram Language 11.3 (March 2018) or above
This work is licensed under a Creative Commons Attribution 4.0 International License