Wolfram Function Repository
Instant-use add-on functions for the Wolfram Language
Function Repository Resource:
Generate geometrically distorted maps, where the distortion conveys information derived from the input data
ResourceFunction["Cartogram"][reg] generates a plot of width 100 in which geographic region reg specified in the form of an Entity object are displayed after 30 iterations; the destortion is based on equalising the population densities by default. | |
ResourceFunction["Cartogram"][{reg1→val1,reg2→val2,…}] generates a plot in which geographic regions reg1 and reg2 specified in the form of Entity objects are displayed after 30 iterations, where the distortion is based on the values val1 and val2. | |
ResourceFunction["Cartogram"][reg,iterations] generates a plot in which geographic region reg is displayed after the specified number of iterations. | |
ResourceFunction["Cartogram"][reg,iterations,res] generates a plot of width res. | |
ResourceFunction["Cartogram"][reg,iterations,res,plotAll] generates a list of plots of width res from the undistorted map to the specified number of iterations. |
Cartogram works with a single geographic entity:
| In[1]:= |
| Out[1]= | 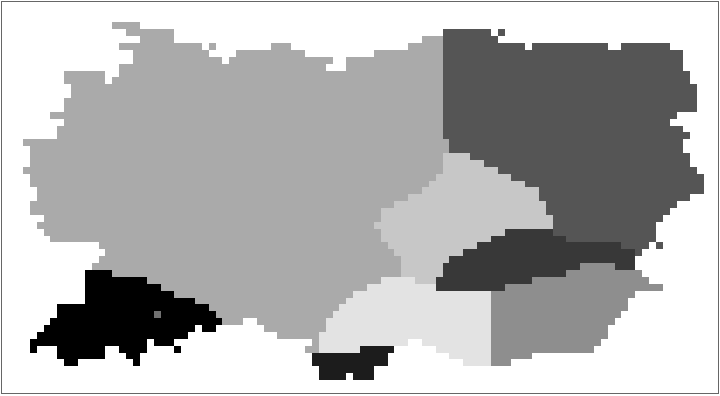 |
A list of countries:
| In[2]:= |
| Out[2]= | 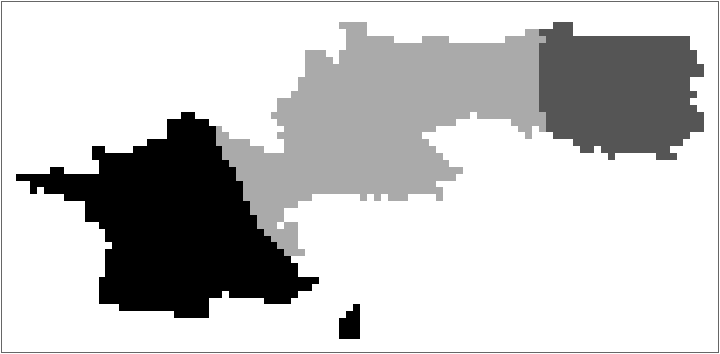 |
A list of countries using user-input values:
| In[3]:= | ![ResourceFunction[
"Cartogram"][{Entity["Country", "Germany"] -> 100, Entity["Country", "Poland"] -> 101, Entity["Country", "France"] -> 150}]](https://www.wolframcloud.com/obj/resourcesystem/images/a29/a2917966-bce2-4188-8bc0-fb05ae17acdb/76c267db1357e750.png) |
| Out[3]= | 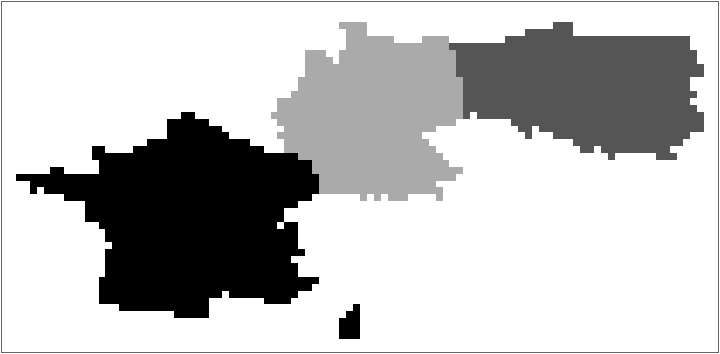 |
Run Cartogram for just one iteration:
| In[4]:= | ![ResourceFunction[
"Cartogram"][{Entity["Country", "Germany"] -> 100, Entity["Country", "Poland"] -> 101, Entity["Country", "France"] -> 150}, 1]](https://www.wolframcloud.com/obj/resourcesystem/images/a29/a2917966-bce2-4188-8bc0-fb05ae17acdb/2b2524af4b43a3d8.png) |
| Out[4]= | 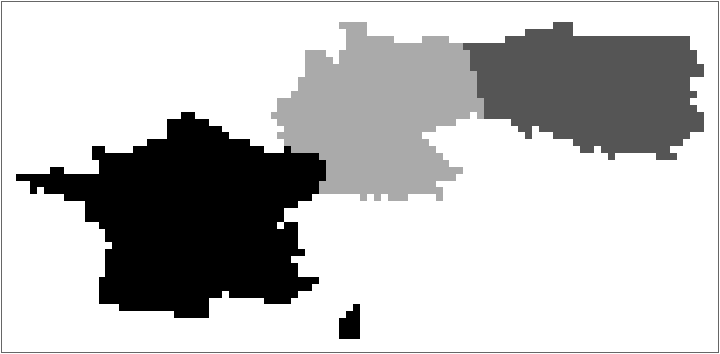 |
Run it for five iterations with a width of 400 pixels.
| In[5]:= | ![ResourceFunction[
"Cartogram"][{Entity["Country", "Germany"] -> 100, Entity["Country", "Poland"] -> 101, Entity["Country", "France"] -> 150}, 5, 400]](https://www.wolframcloud.com/obj/resourcesystem/images/a29/a2917966-bce2-4188-8bc0-fb05ae17acdb/6ac0527e7b3c5126.png) |
| Out[5]= | 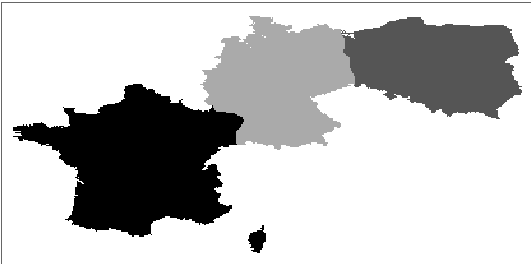 |
Return all steps of first five iterations:
| In[6]:= | ![ResourceFunction[
"Cartogram"][{Entity["Country", "Germany"] -> 100, Entity["Country", "Poland"] -> 101, Entity["Country", "France"] -> 101}, 5, 200, True]](https://www.wolframcloud.com/obj/resourcesystem/images/a29/a2917966-bce2-4188-8bc0-fb05ae17acdb/0fe6715b312cfd9a.png) |
| Out[6]= | 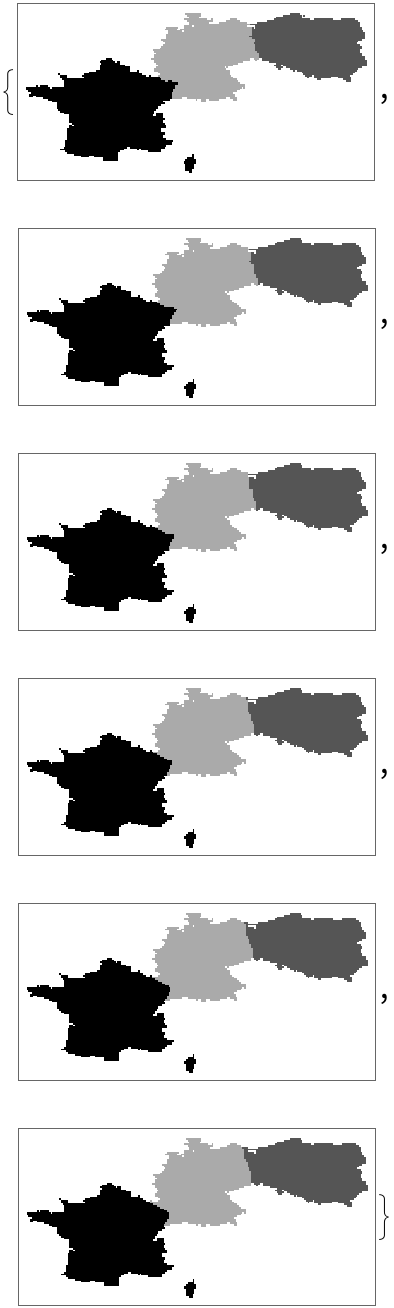 |
This work is licensed under a Creative Commons Attribution 4.0 International License