Wolfram Function Repository
Instant-use add-on functions for the Wolfram Language
Function Repository Resource:
Obtain an annotated state transition graph for any CellularAutomaton rule
ResourceFunction["CATransducerGraph"][rule,k,r] returns a directed adjacency graph over k(k2r+1) states, where each edge is annotated with an input value 0, 1, …, k and each vertex is annotated with an output value determined by rule. |
The CATransducerGraph for Rule 86:
| In[1]:= |
| Out[1]= | 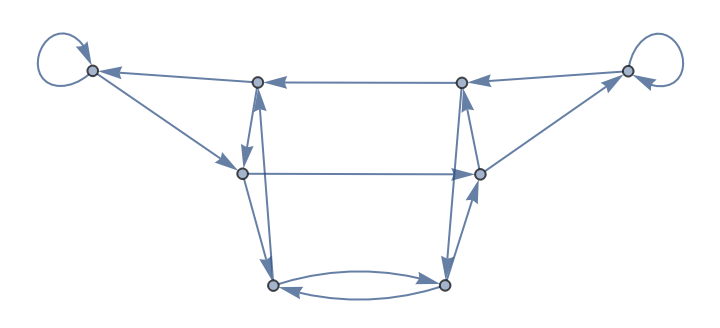 |
Obtain the definition of rule 86 from Annotation data:
| In[2]:= |
| Out[2]= |
Prove that rule 86 allows any bit vector in its range of outputs:
| In[3]:= |
| Out[3]= |
Map a two-state CA with CATransducerGraph over different radius values:
| In[4]:= |
| Out[4]= | 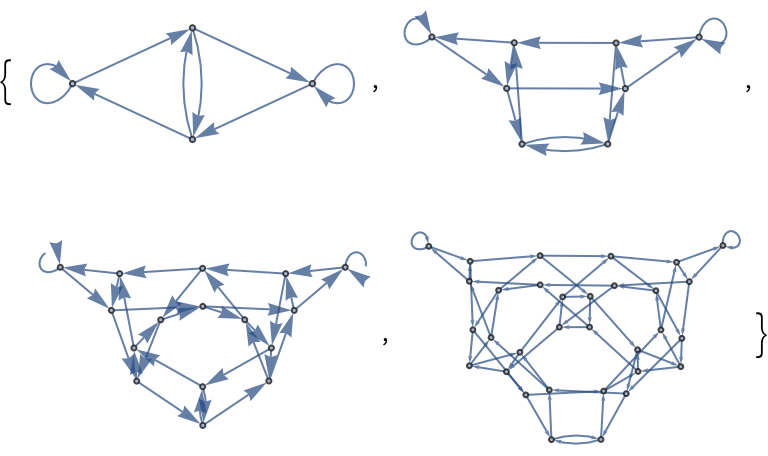 |
Color a CATransducerGraph according to its Annotation data:
| In[5]:= | ![With[{graph = ResourceFunction["CATransducerGraph"][90, 2, 1]},
Graph[graph, VertexSize -> Large, VertexStyle -> Map[
# -> Association[0 -> Darker[Green, .1], 1 -> Darker[Yellow, .1]][
AnnotationValue[{graph, #}, VertexWeight]] &, VertexList[graph]],
EdgeStyle -> Map[# -> Association[0 -> Red, 1 -> Blue][
AnnotationValue[{graph, #}, EdgeWeight]] &, EdgeList[graph]]]
]](https://www.wolframcloud.com/obj/resourcesystem/images/ebc/ebc9239b-a7fc-4842-8764-fa139e490070/40f60f3eaa71850b.png) |
| Out[5]= | 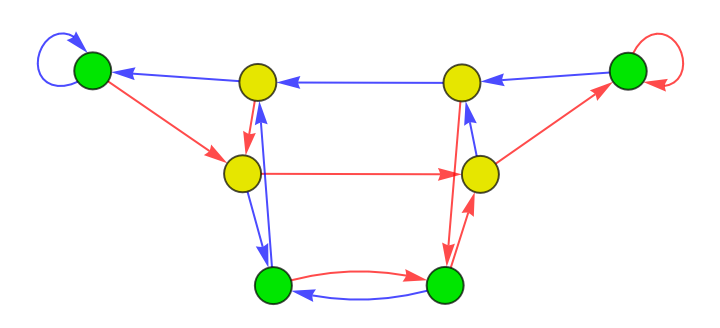 |
Map a three-state with CATransducerGraph over different radius values:
| In[6]:= |
| Out[6]= | 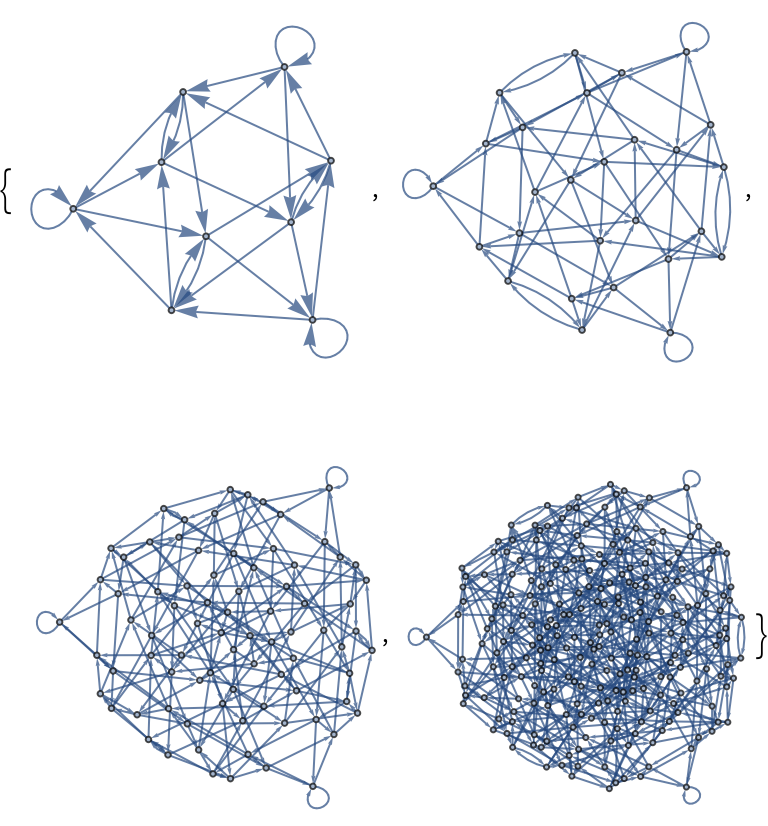 |
Obtain the CATransducerGraph for a totalistic rule:
| In[7]:= |
| Out[7]= | 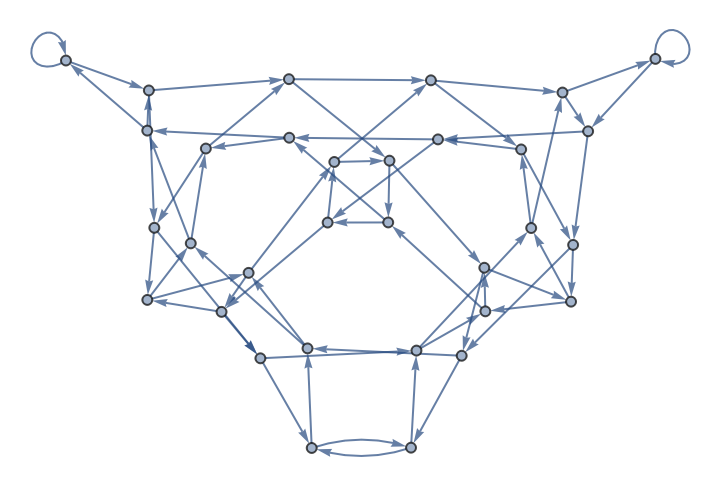 |
Color vertices according to the transduced output value:
| In[8]:= | ![ResourceFunction["CATransducerGraph"][{10, {2, 1}, 2}, 2, 2, "VertexFigures" -> Automatic, VertexSize -> Large,
ColorRules -> {1 -> Darker[Orange, .2], 0 -> Lighter[Blend[{Yellow, Orange}]], _ -> LightGray}
]](https://www.wolframcloud.com/obj/resourcesystem/images/ebc/ebc9239b-a7fc-4842-8764-fa139e490070/103fcb0cea152742.png) |
| Out[8]= | 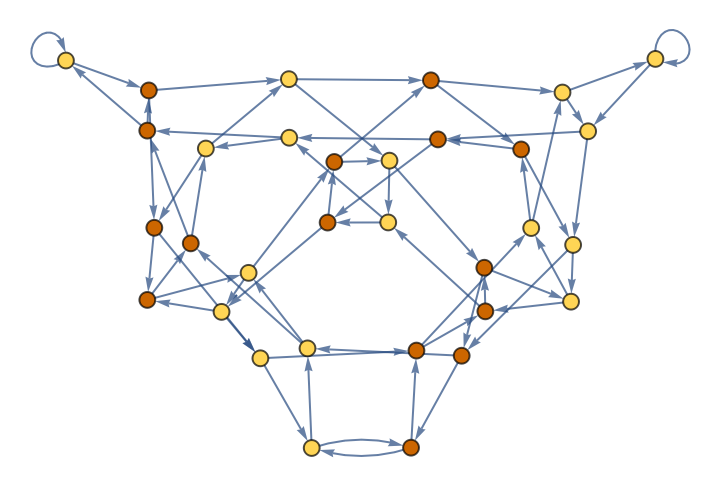 |
Show fragments of input and output tapes:
| In[9]:= | ![ResourceFunction["CATransducerGraph"][{10, {2, 1}, 2}, 2, 2,
"VertexFigures" -> True, VertexSize -> 1/2, EdgeStyle -> Gray,
ColorRules -> {1 -> Darker[Orange, .2], 0 -> Lighter[Blend[{Yellow, Orange}]], _ -> LightGray}
]](https://www.wolframcloud.com/obj/resourcesystem/images/ebc/ebc9239b-a7fc-4842-8764-fa139e490070/6fd426e13c630f33.png) |
| Out[9]= | 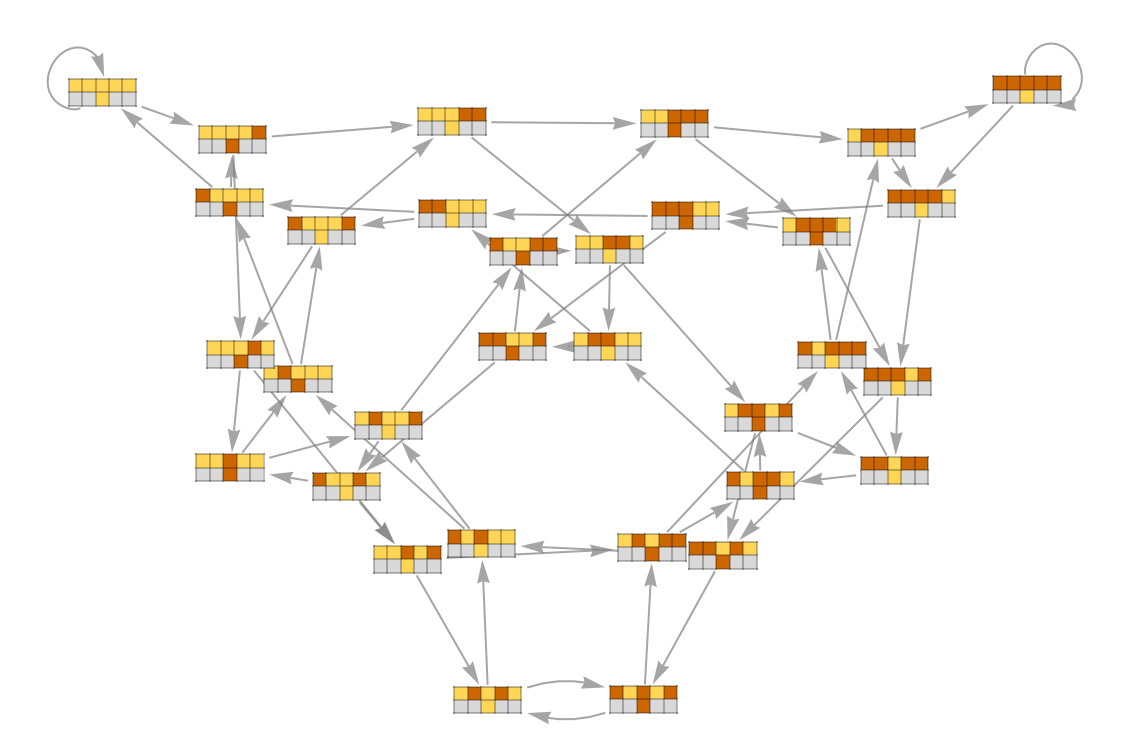 |
Compare left-shift and right-shift graphs for rule 30:
| In[10]:= |
| Out[10]= |  |
One graph has uniform outputs, the other does not:
| In[11]:= | ![Function[graph, Values[Union[
AnnotationValue[{graph, #}, VertexWeight]] & /@ KeySort[
GroupBy[EdgeList[graph], First -> Last]]]] /@ gs](https://www.wolframcloud.com/obj/resourcesystem/images/ebc/ebc9239b-a7fc-4842-8764-fa139e490070/4e62edfee8e93286.png) |
| Out[11]= |
Highlight where the right-shift graph fails to provide alternatives for the next transduced value:
| In[12]:= | ![With[{badEs = Catenate[Values[
Select[GroupBy[EdgeList[Last[gs]], First -> Identity], Apply[SameQ,
AnnotationValue[{Last[gs], Last[#]}, VertexWeight] & /@ #] &]]]},
HighlightGraph[Last[gs], badEs]
]](https://www.wolframcloud.com/obj/resourcesystem/images/ebc/ebc9239b-a7fc-4842-8764-fa139e490070/49d8128002a8d4ba.png) |
| Out[12]= | 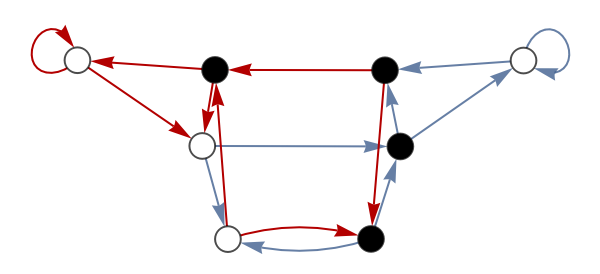 |
Add vertex figures to the CATransducerGraph of a random four-color CellularAutomaton:
| In[13]:= | ![ResourceFunction["CATransducerGraph"][SeedRandom[123]; RandomInteger[4^4^3 - 1], 4, 1, VertexSize -> 2/3,
EdgeStyle -> Gray, "VertexFigures" -> True]](https://www.wolframcloud.com/obj/resourcesystem/images/ebc/ebc9239b-a7fc-4842-8764-fa139e490070/1478944b919eee4b.png) |
| Out[13]= | 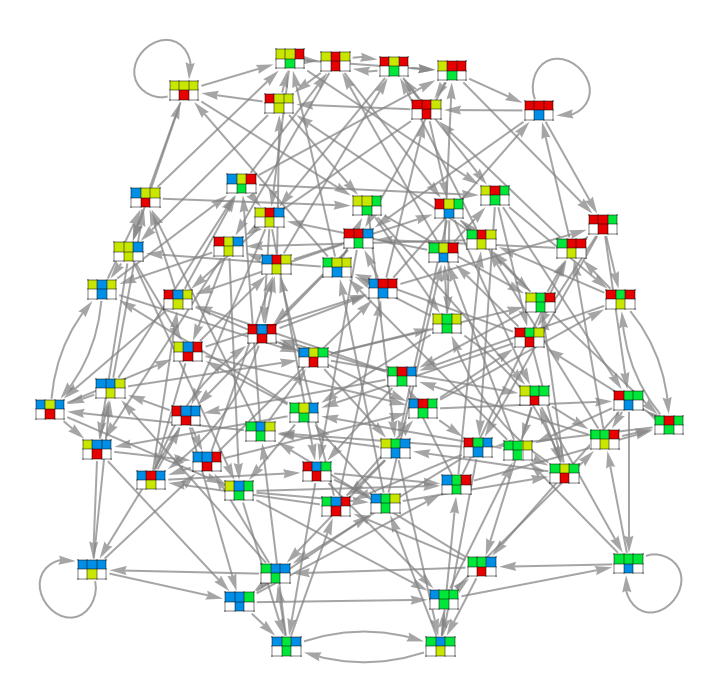 |
Prove that a certain length-36 bit vector can not exist in a totalistic CA using rule 10:
| In[14]:= | ![Module[
{graph, seq, alts, level, res},
graph = ResourceFunction["CATransducerGraph"][{10, {2, 1}, 2}, 2, 2];
seq = {1, 0, 1, 0, 1, 0, 1, 0, 1, 0, 0, 1, 1, 0, 1, 0, 1, 0, 0, 1, 0,
1, 1, 0, 1, 0, 0, 1, 0, 1, 0, 1, 0, 1, 0, 1};
alts = GroupBy[Transpose[{VertexList[graph],
AnnotationValue[graph, VertexWeight]}],
Last -> First];
level = alts[First[seq]];
res = Fold[Function[{lev, val},
Union[Select[alts[val],
MemberQ[Rest /@ lev, Most[#]] &]]
], level, Rest[seq]];
Labeled[ArrayPlot[{seq}, Mesh -> True],
"Non-invertible?" -> SameQ[res, {}]]
]](https://www.wolframcloud.com/obj/resourcesystem/images/ebc/ebc9239b-a7fc-4842-8764-fa139e490070/3864fad0a37655a0.png) |
| Out[14]= |
Given a random bit vector, list possible pre-images under rule 165:
| In[15]:= | ![Module[{graph, edges, rule, path, res},
graph = ResourceFunction["CATransducerGraph"][165, 2, 1];
edges = GroupBy[EdgeList[graph], First -> Last];
rule = Association[Thread[Rule[VertexList[graph],
AnnotationValue[graph, VertexWeight]]]];
SeedRandom[323];
path = RandomInteger[1, 10];
res = Map[FoldList[
Function[{state, val},
SelectFirst[edges[state],
SameQ[rule[#], val] &]
], #, Rest[path]] &,
Select[VertexList[graph],
SameQ[rule[#] , First[path]] &]
];
ArrayPlot[
{Join[Most[First[#]], Last /@ Rest[#]],
CenterArray[path, Length[path] + 2, _]},
Mesh -> True, ColorRules -> {1 -> Black, 0 -> White, _ -> LightRed}
] & /@ res
]](https://www.wolframcloud.com/obj/resourcesystem/images/ebc/ebc9239b-a7fc-4842-8764-fa139e490070/69eb352b1ce9a26d.png) |
| Out[15]= |  |
The structure of CATransducerGraph does not depend on choice of rule:
| In[16]:= |
| Out[16]= |
However, different rules have different Annotation values:
| In[17]:= | ![SameQ[AnnotationValue[
ResourceFunction["CATransducerGraph"][165, 2, 1], VertexWeight],
AnnotationValue[ResourceFunction["CATransducerGraph"][90, 2, 1], VertexWeight]]](https://www.wolframcloud.com/obj/resourcesystem/images/ebc/ebc9239b-a7fc-4842-8764-fa139e490070/3d3f0960de0eb833.png) |
| Out[17]= |
Obtain a list of "multiway-invertible" elementary cellular automata:
| In[18]:= | ![cas = Union[
Catenate[Function[shift, Select[Range[0, 2^8 - 1], Function[graph,
AllTrue[Values[GroupBy[EdgeList[graph], First -> Last]],
SameQ[{0, 1}, Union[AnnotationValue[{graph, #},
VertexWeight] & /@ #]] &]][
ResourceFunction["CATransducerGraph"][#, 2, 1, "Shift" -> shift]
] &]] /@ {Left, Right}]]](https://www.wolframcloud.com/obj/resourcesystem/images/ebc/ebc9239b-a7fc-4842-8764-fa139e490070/79e2c7d887854236.png) |
| Out[18]= |
Depict the results evolving from random periodic initial conditions:
| In[19]:= | ![GraphicsGrid[Partition[ArrayPlot[
CellularAutomaton[#, RandomInteger[1, 30], 30],
ImageSize -> 80] & /@ cas, UpTo[8]], ImageSize -> 640]](https://www.wolframcloud.com/obj/resourcesystem/images/ebc/ebc9239b-a7fc-4842-8764-fa139e490070/4d36cf0ec0c7c5c1.png) |
| Out[19]= | 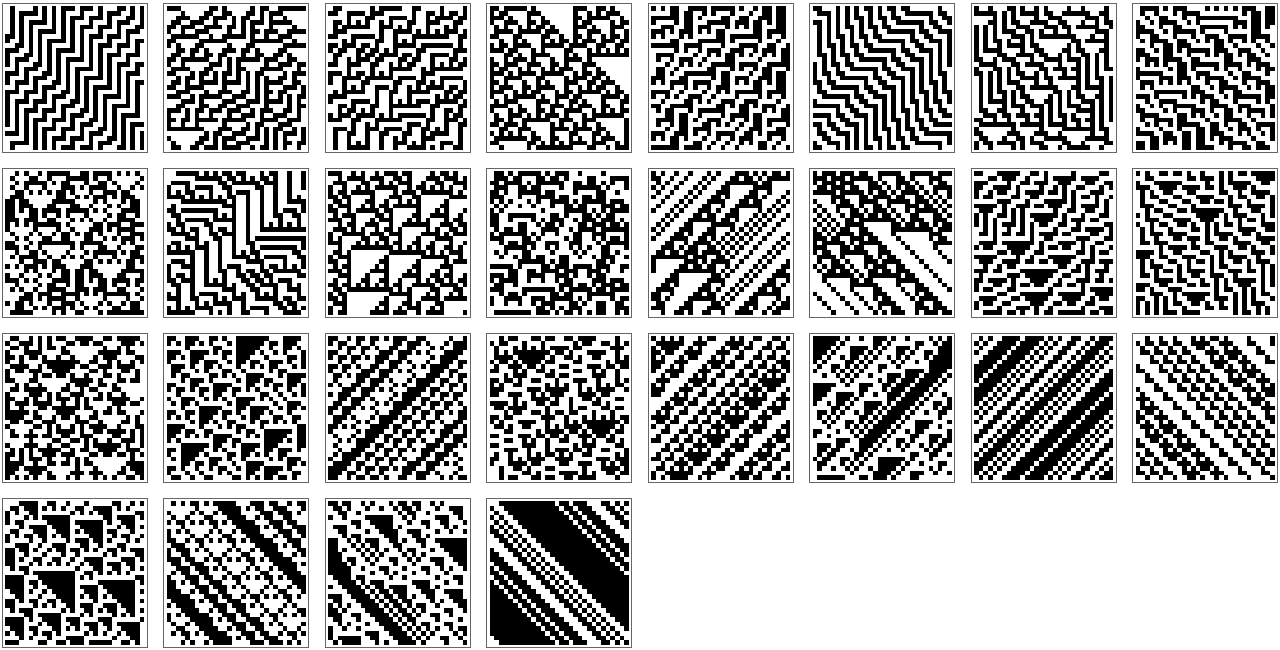 |
Wolfram Language 13.0 (December 2021) or above
This work is licensed under a Creative Commons Attribution 4.0 International License