Wolfram Function Repository
Instant-use add-on functions for the Wolfram Language
Function Repository Resource:
Blend between lines
ResourceFunction["BlendLine"][{line1,line2}] gives the line halfway between line1 and line2. | |
ResourceFunction["BlendLine"][{line1,line2},α] gives the line a fraction α between line1 and line2. | |
ResourceFunction["BlendLine"][{line1,line2,…},α] gives the line a fraction α between lines linei. | |
ResourceFunction["BlendLine"][{line1,line2,…},{α1,α2,…}] gives several lines with fractions αi. |
Interpolate halfway between two lines:
| In[1]:= |
| Out[1]= |
Interpolate a fraction of the way between two lines:
| In[2]:= | ![a = Line[{{0, 0}, {1, 0}, {3, 0.5}}];
b = Line[{{-1, 2}, {1, 2}, {3, 1}}];
Graphics[{a, b, Red, ResourceFunction["BlendLine"][{a, b}, 0.2]}]](https://www.wolframcloud.com/obj/resourcesystem/images/609/609b010d-90d3-4fb7-918d-ead9d597432f/6d038e0442ead85e.png) |
| Out[4]= | 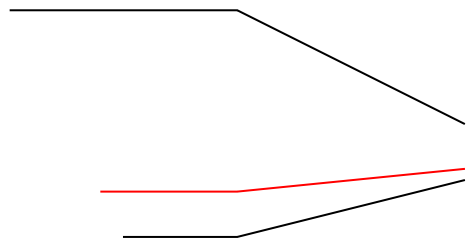 |
Interpolate two lines at multiple fractions:
| In[5]:= | ![a = Line[{{0, 0}, {1, 0}, {3, 0.5}}];
b = Line[{{-1, 2}, {1, 2}, {3, 1}}];
Graphics[{a, b, Red, ResourceFunction["BlendLine"][{a, b}, {0.2, 0.4, 0.6, 0.8}]}]](https://www.wolframcloud.com/obj/resourcesystem/images/609/609b010d-90d3-4fb7-918d-ead9d597432f/6380fc04a702d67b.png) |
| Out[7]= | 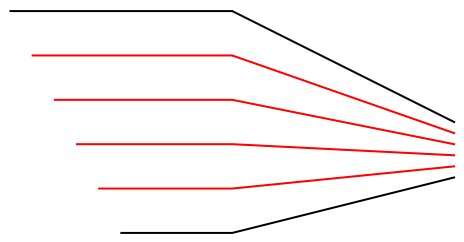 |
Blend between three lines:
| In[8]:= | ![a = Line[{{0, 0}, {1, 0.4}}];
b = Line[{{1, 2}, {3, 1}}];
c = Line[{{4, 4}, {5, 4.5}}];
Graphics[{a, b, c, Red, ResourceFunction["BlendLine"][{a, b, c}, Range[0.025, 0.975, 0.05]]}, PlotRange -> All]](https://www.wolframcloud.com/obj/resourcesystem/images/609/609b010d-90d3-4fb7-918d-ead9d597432f/41ef5d851dc173ac.png) |
| Out[11]= | 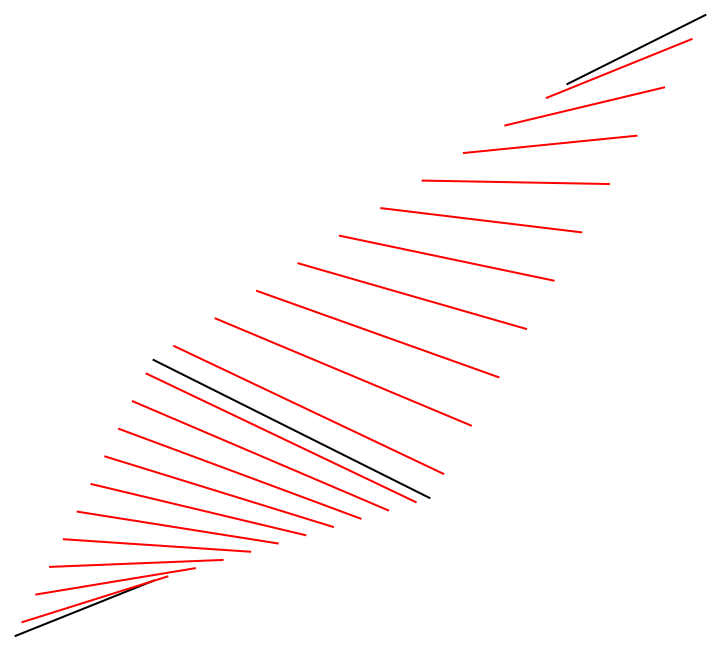 |
Interpolate between two lines in 3D:
| In[12]:= | ![a = Line[{{0, 0, 0}, {1, 0, 1}, {3, 0.5, -1}}];
b = Line[{{-1, 2, -2}, {1, 2, -1}, {3, 1, 2}}];
Graphics3D[{a, b, Red, ResourceFunction["BlendLine"][{a, b}, Range[1/10, 9/10, 1/10]]}]](https://www.wolframcloud.com/obj/resourcesystem/images/609/609b010d-90d3-4fb7-918d-ead9d597432f/42b3df430a4a056b.png) |
| Out[14]= | 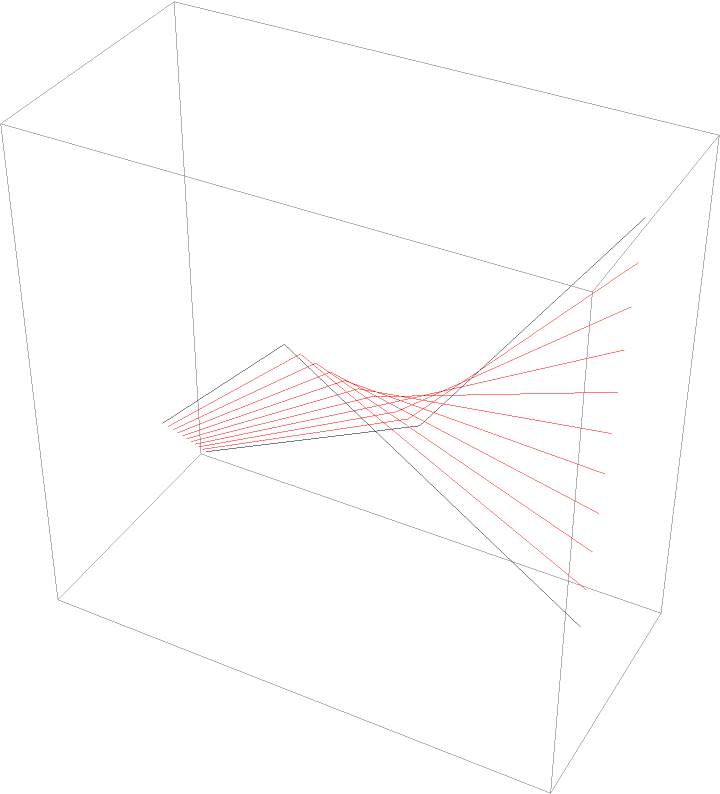 |
Interpolate a line in 4D:
| In[15]:= | ![a = Line[{{0, 0, 0, 0}, {1, 2, 2, 0}}];
b = Line[{{-1, 2, 2, 3}, {1, 3, 4, 2}, {1, 0, 3, 1}}];
ResourceFunction["BlendLine"][{a, b}, 0.2]](https://www.wolframcloud.com/obj/resourcesystem/images/609/609b010d-90d3-4fb7-918d-ead9d597432f/635112781dac1ce1.png) |
| Out[17]= |
Create a grid:
| In[18]:= | ![Graphics[{ResourceFunction[
"BlendLine"][{Line[{{0, 0}, {0, 10}}], Line[{{5, 0}, {5, 10}}]}, Subdivide[5]],
ResourceFunction[
"BlendLine"][{Line[{{0, 0}, {5, 0}}], Line[{{0, 10}, {5, 10}}]}, Subdivide[8]]}]](https://www.wolframcloud.com/obj/resourcesystem/images/609/609b010d-90d3-4fb7-918d-ead9d597432f/15678ca734a2bd12.png) |
| Out[18]= |  |
Design a fancy curved rooftop design using straight beams:
| In[19]:= | ![a = Line[{{0, 0, 1}, {0, 1, 0}}];
b = Line[{{1, 0, 0}, {1, 1, 1}}];
c = Line[{{0, 0, 1}, {1, 0, 0}}];
d = Line[{{0, 1, 0}, {1, 1, 1}}];
Graphics3D[{Blue, ResourceFunction["BlendLine"][{a, b}, Subdivide[15]], Red, ResourceFunction["BlendLine"][{c, d}, Subdivide[15]]}]](https://www.wolframcloud.com/obj/resourcesystem/images/609/609b010d-90d3-4fb7-918d-ead9d597432f/1e9d1c4ba83b4408.png) |
| Out[23]= | 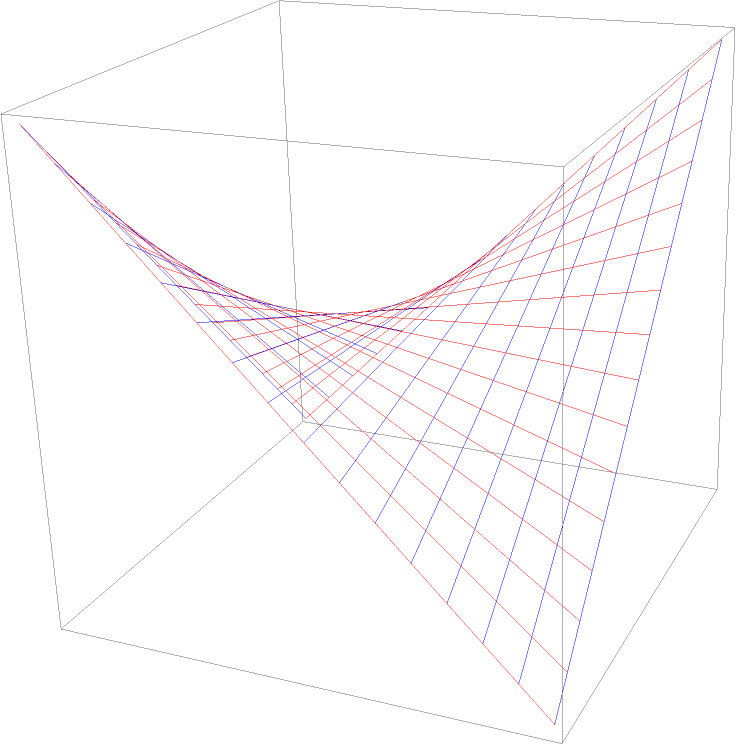 |
Lines do not need the same number of data points. The resulting line can have more points than the original ones:
| In[24]:= | ![p1 = {{-1, 1}, {0, 2}, {2, 1}};
p2 = {{-1, 0}, {0, -1}, {1.5, 0.2}, {2, -0.1}};
Graphics[{Line[p1], Line[p2], PointSize[Large], Point[p1], Point[p2], Red, ResourceFunction["BlendLine"][{Line[p1], Line[p2]}], Point @@ ResourceFunction["BlendLine"][{Line[p1], Line[p2]}]}]](https://www.wolframcloud.com/obj/resourcesystem/images/609/609b010d-90d3-4fb7-918d-ead9d597432f/24185509e973c3db.png) |
| Out[26]= | 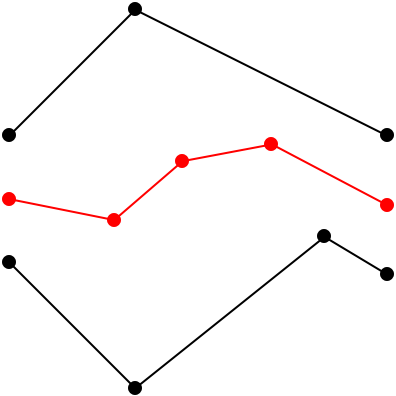 |
Extrapolate beyond the original lines by using numbers outside the range (0,1):
| In[27]:= | ![a = Line[{{0, 0}, {1, 0}, {3, 0.5}}];
b = Line[{{-1, 2}, {1, 2}, {3, 1}}];
Graphics[{a, b, Red, ResourceFunction[
"BlendLine"][{a, b}, {-0.4, -0.2, 0.2, 0.4, 0.6, 0.8, 1.2, 1.4}]}]](https://www.wolframcloud.com/obj/resourcesystem/images/609/609b010d-90d3-4fb7-918d-ead9d597432f/60bd8ac8d9304d30.png) |
| Out[29]= | 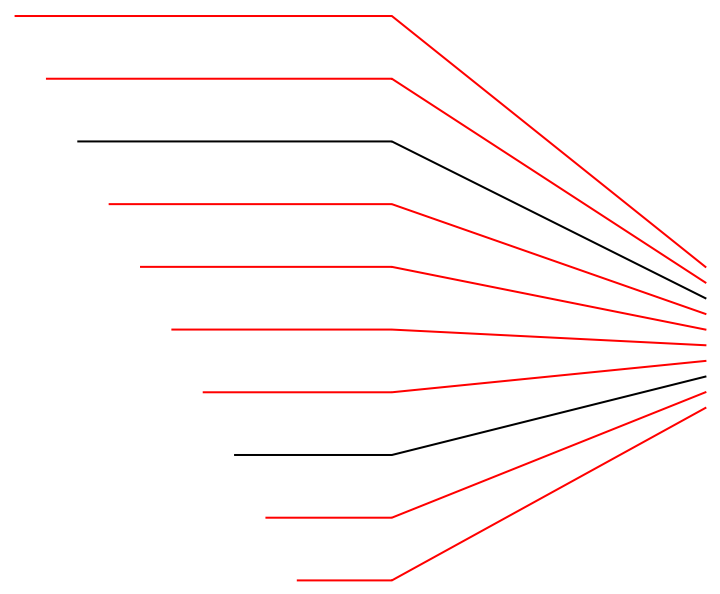 |
Interpolate between an octagon and a hexagon:
| In[30]:= | ![Graphics@ResourceFunction[
"BlendLine"][{Line[Append[#, First[#]] &@CirclePoints[8]], Line[Append[#, First[#]] &@CirclePoints[0.2, 6]]}, Subdivide[15]]](https://www.wolframcloud.com/obj/resourcesystem/images/609/609b010d-90d3-4fb7-918d-ead9d597432f/3af4eb613a20c457.png) |
| Out[30]= |  |
Interpolate between a circle and a square:
| In[31]:= | ![a = Line[Append[#, First[#]] &[CirclePoints[{3, Pi/4}, 100]]];
b = Line[Append[#, First[#]] &[CirclePoints[{1, Pi/4}, 4]]];
Manipulate[
Graphics[{a, b, ResourceFunction["BlendLine"][{a, b}, i]}], {{i, 0.5}, 0, 1}, SaveDefinitions -> True]](https://www.wolframcloud.com/obj/resourcesystem/images/609/609b010d-90d3-4fb7-918d-ead9d597432f/388eeb59bc8586ab.png) |
| Out[32]= | 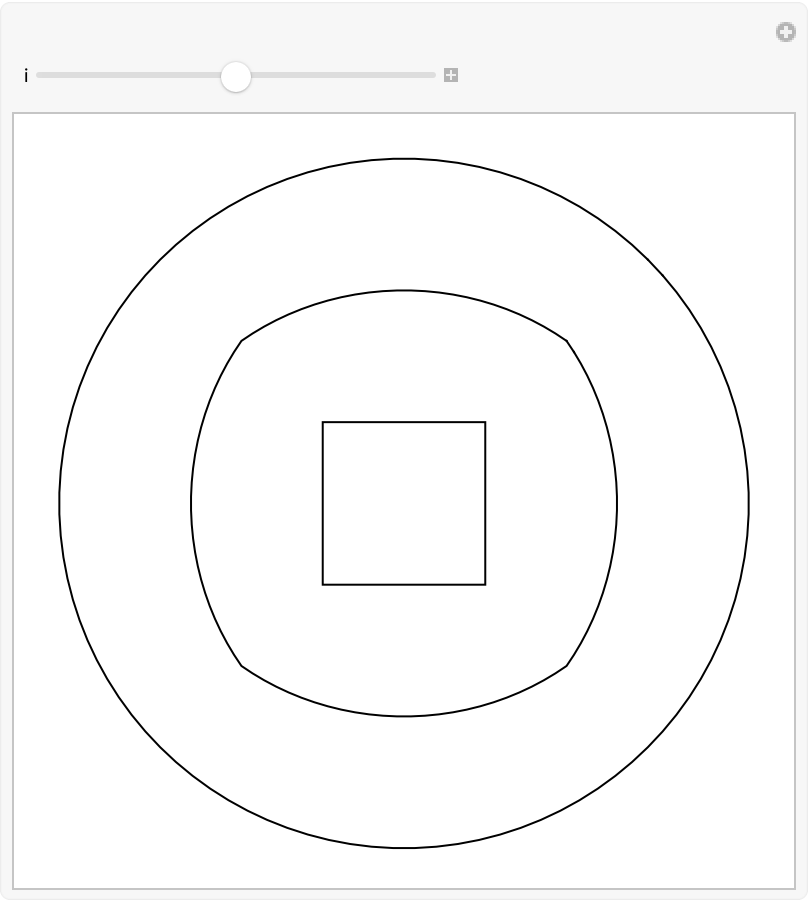 |
This work is licensed under a Creative Commons Attribution 4.0 International License