Wolfram Function Repository
Instant-use add-on functions for the Wolfram Language
Function Repository Resource:
Visualize the 3D structure of biomolecules
ResourceFunction["BioMoleculePlot3D"][biomol] creates a three-dimensional visualization of the biomolecule represented by biomol. |
| "ChainStyle" | Automatic | directives to specify the style for each chain |
| "ColorScheme" | "Chain" | color scheme used for biomolecule units |
| GeneratedAssetLocation | Automatic | location where downloaded files are stored |
| "LigandStyle" | Automatic | style used for depicting the ligands |
| PlotLegends | None | legends for biomolecule units |
| "ShowLigands" | False | whether to show ligands |
| SourceLink | Automatic | PDB mirror used for getting PDB files |
| "Chain" | color each chain, using "ChainStyle" |
| "Charge" | color each residue by its charge or polarity |
| "Residue" | color each residue |
| "SecondaryStructurePropensity" | color each residue by its tendency to form helices or sheets |
Visualize the structure of the plant protein crambin using its PDB ID:
| In[1]:= |
| Out[1]= | 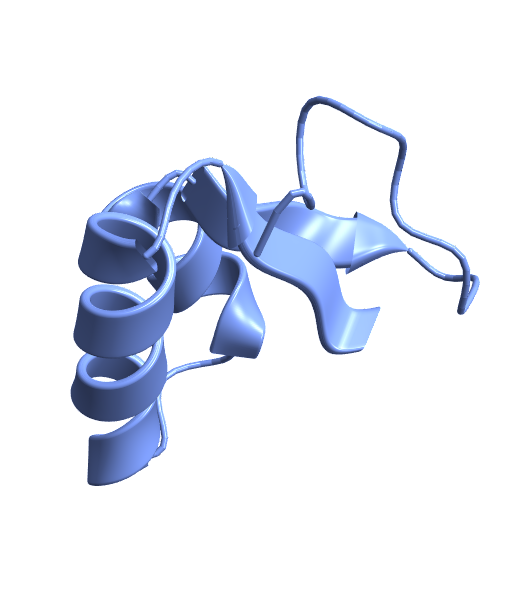 |
Visualize the structure of porcine insulin using its PDB ID:
| In[2]:= |
| Out[2]= |  |
An equivalent specification:
| In[3]:= |
| Out[3]= | 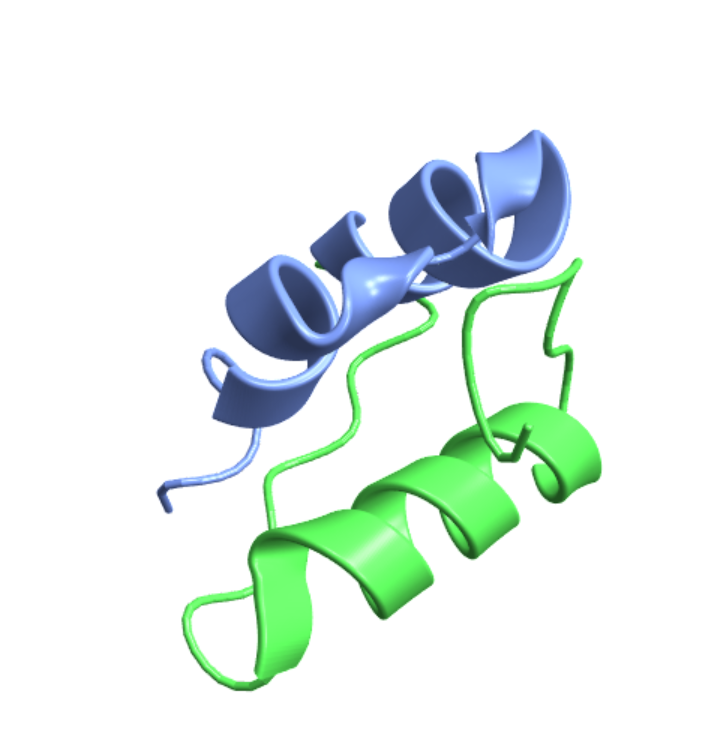 |
| In[4]:= |
| Out[4]= | 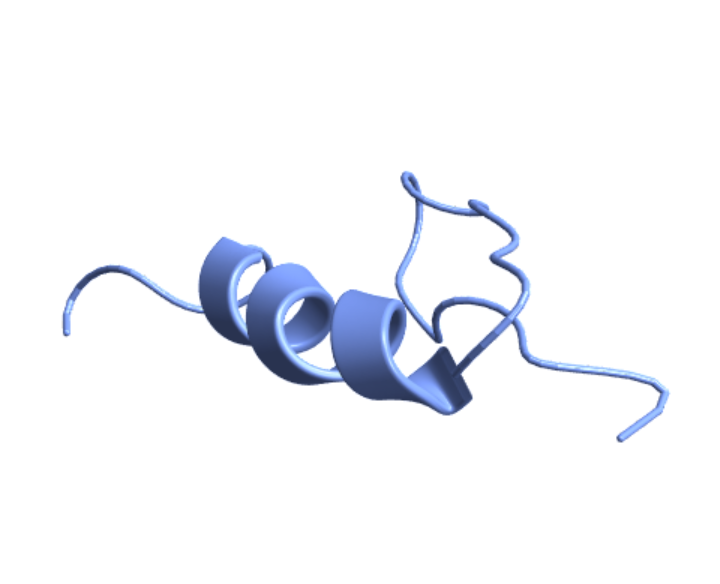 |
Visualize a nucleic acid strand from a file:
| In[5]:= |
| Out[5]= | 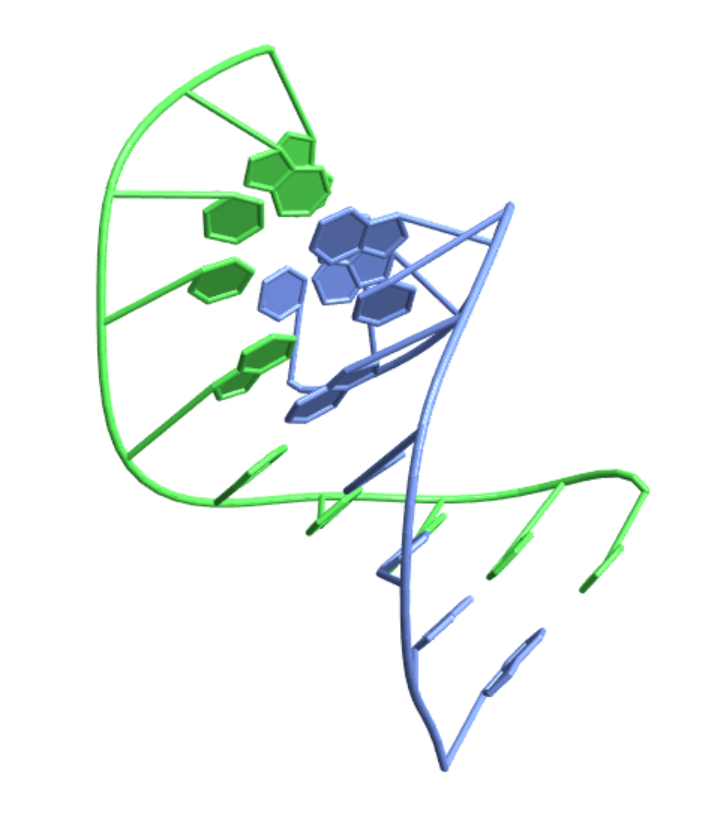 |
Visualize an RNA protein complex from the Nucleic Acid Database:
| In[6]:= |
| Out[6]= | 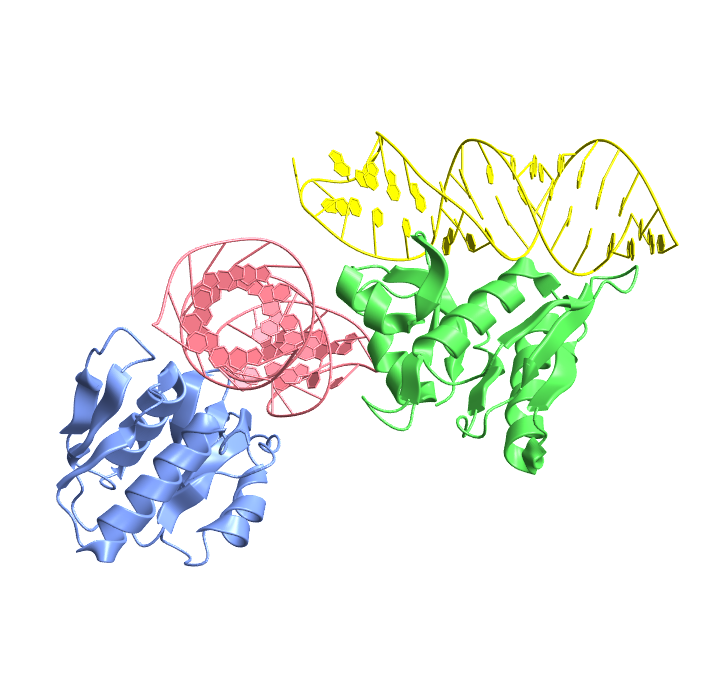 |
Customize the appearance by setting various options:
| In[7]:= |
| Out[7]= | 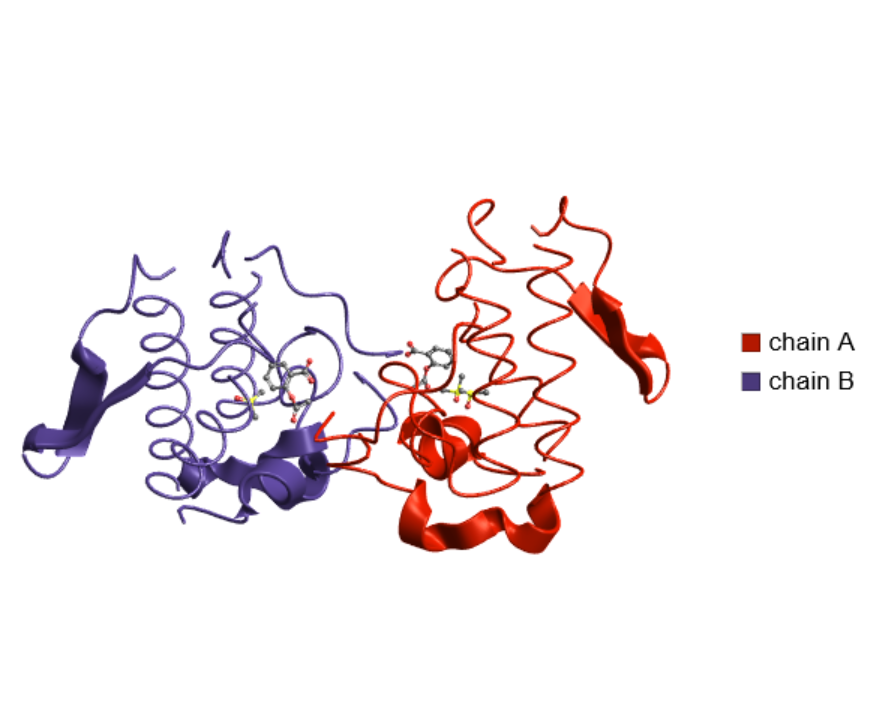 |
Use non-default colors for the chains of melittin, a protein found in bee venom:
| In[8]:= |
| Out[8]= | 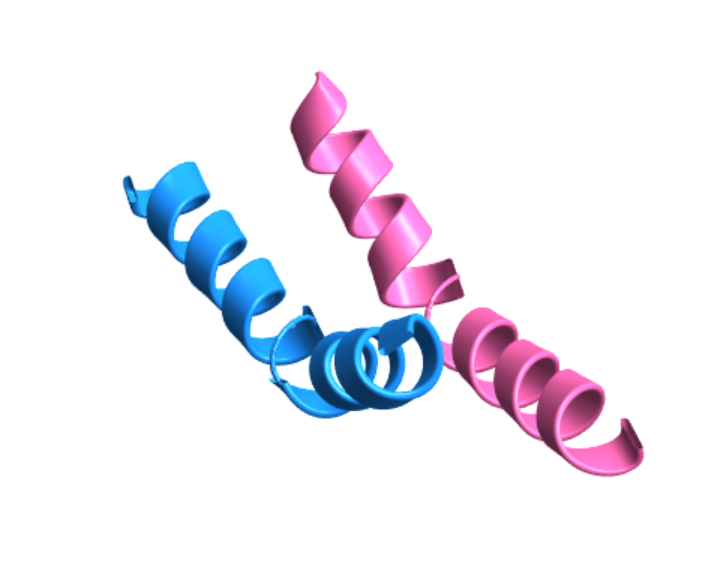 |
Color the structure of lysozyme by its residues:
| In[9]:= |
| Out[9]= | 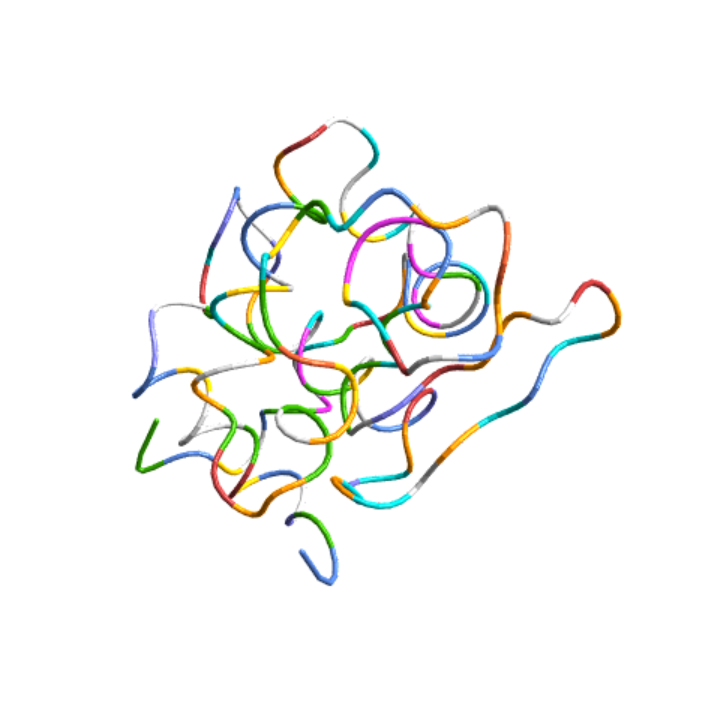 |
Color the residues according to their charges or polarities:
| In[10]:= |
| Out[10]= | 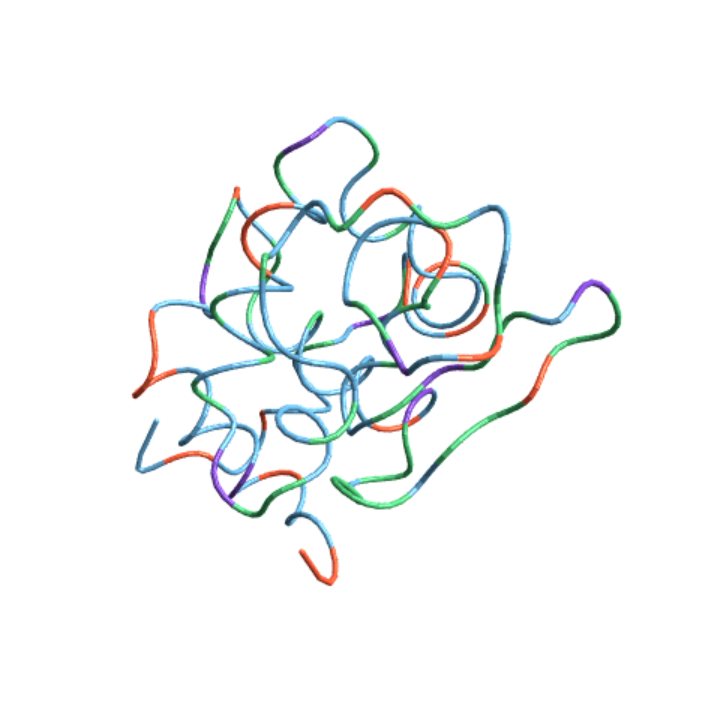 |
Color the residues according to their abilities to form α-helices or β-sheets:
| In[11]:= |
| Out[11]= | 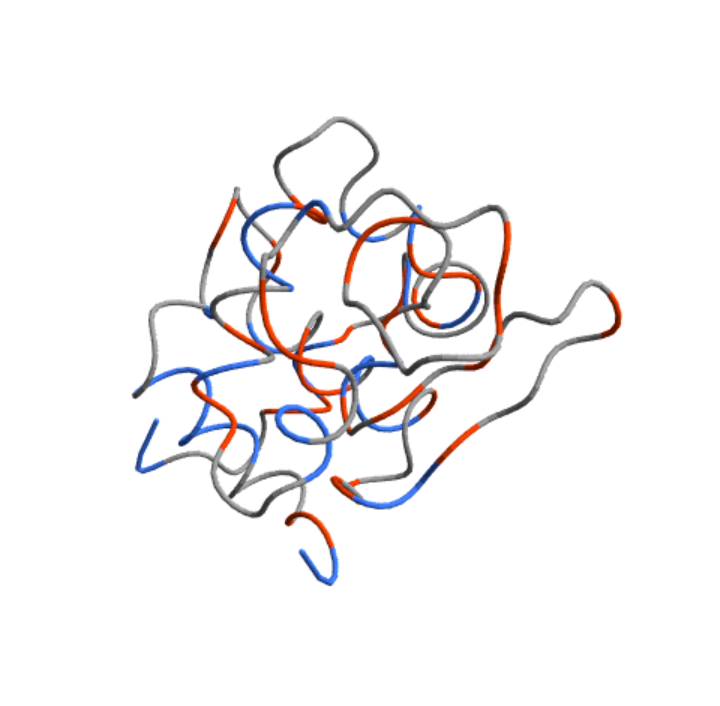 |
Use a different directory for saving downloaded files:
| In[12]:= |
| Out[12]= | 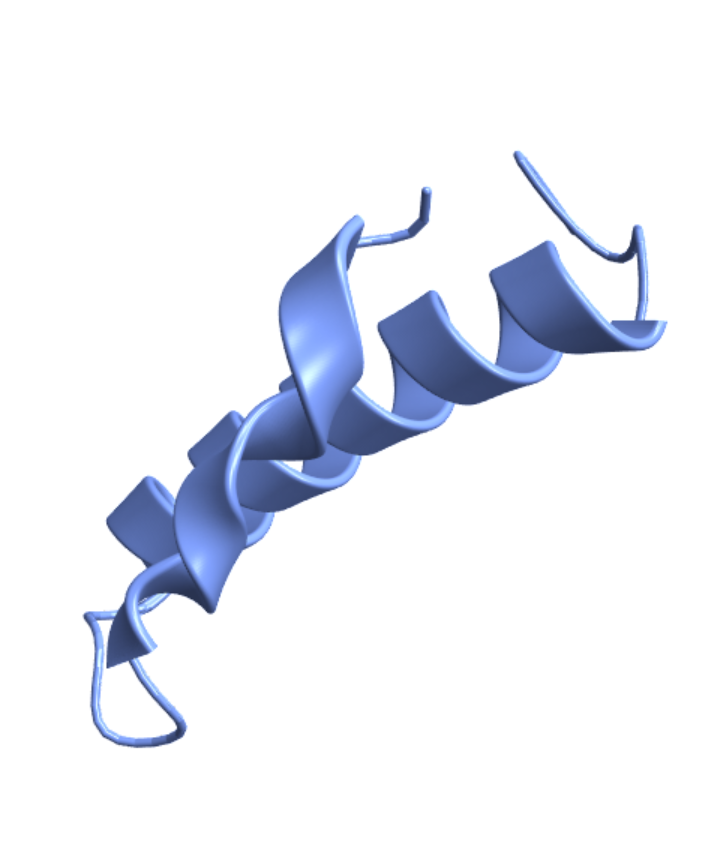 |
Confirm that the file was downloaded to the specified directory:
| In[13]:= |
| Out[13]= |
Use a ball-and-stick depiction of the ligands:
| In[14]:= |
| Out[14]= | 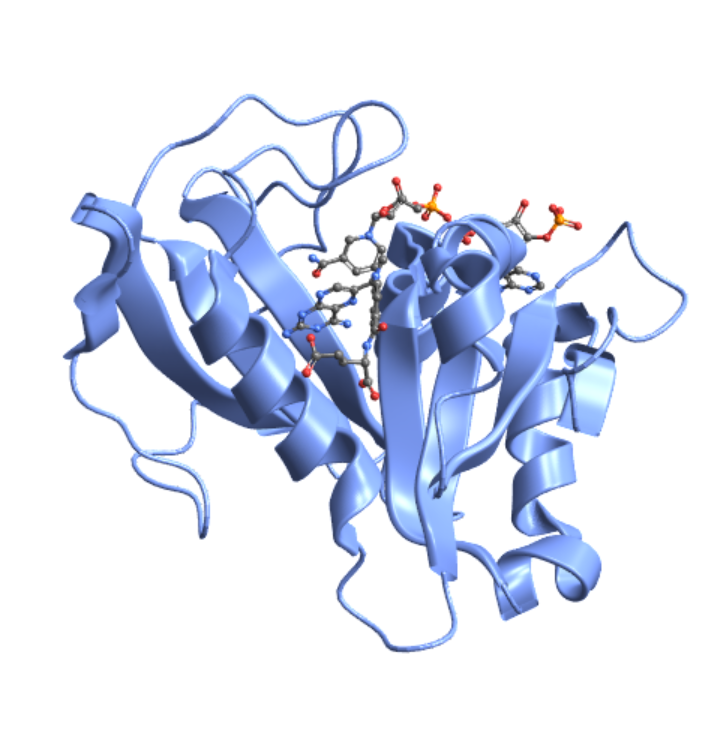 |
Show the PDB ID in the plot label:
| In[15]:= |
| Out[15]= | 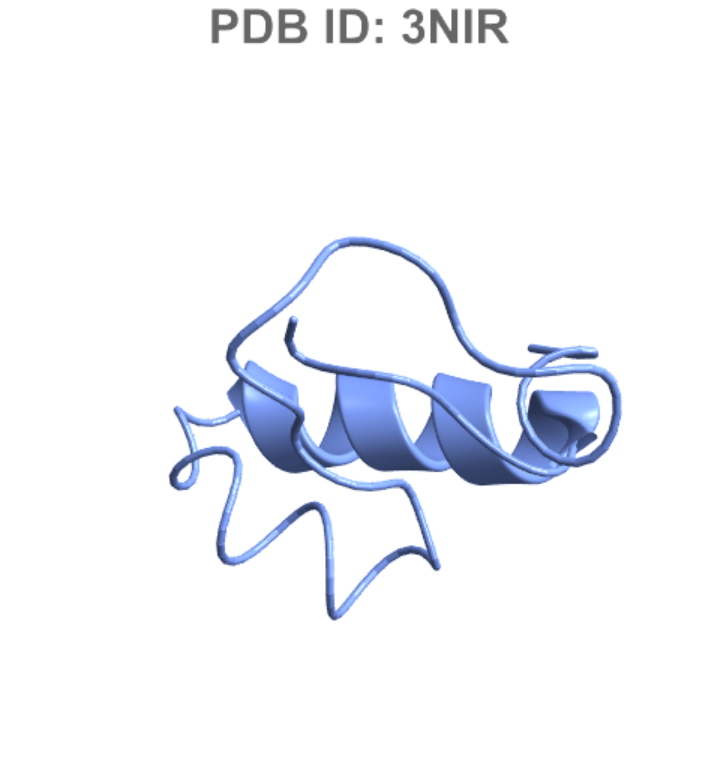 |
Show the entity name in the plot label:
| In[16]:= |
| Out[16]= | 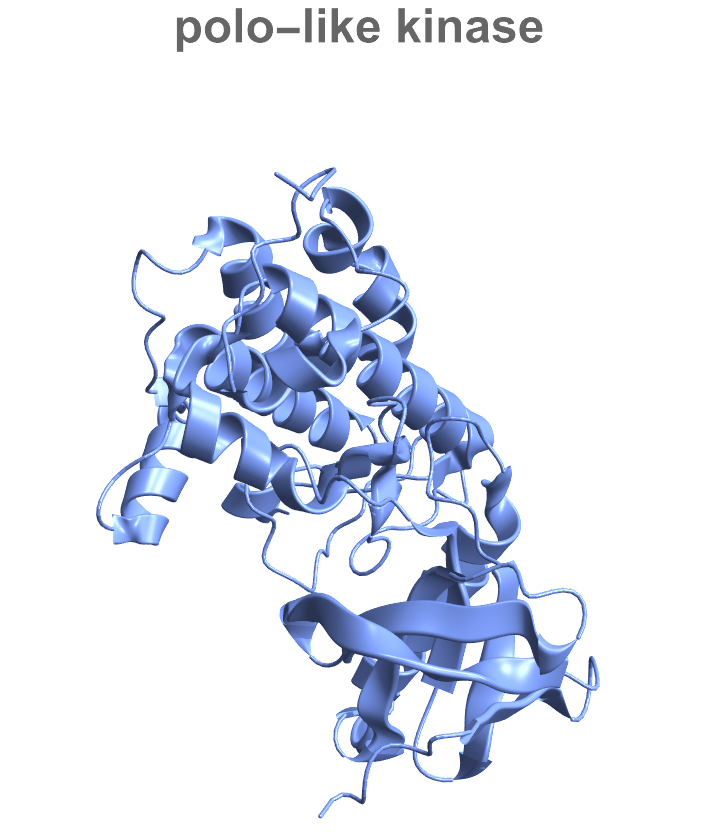 |
Create a legend based on the different chains in the three-finger toxin irditoxin:
| In[17]:= |
| Out[17]= | 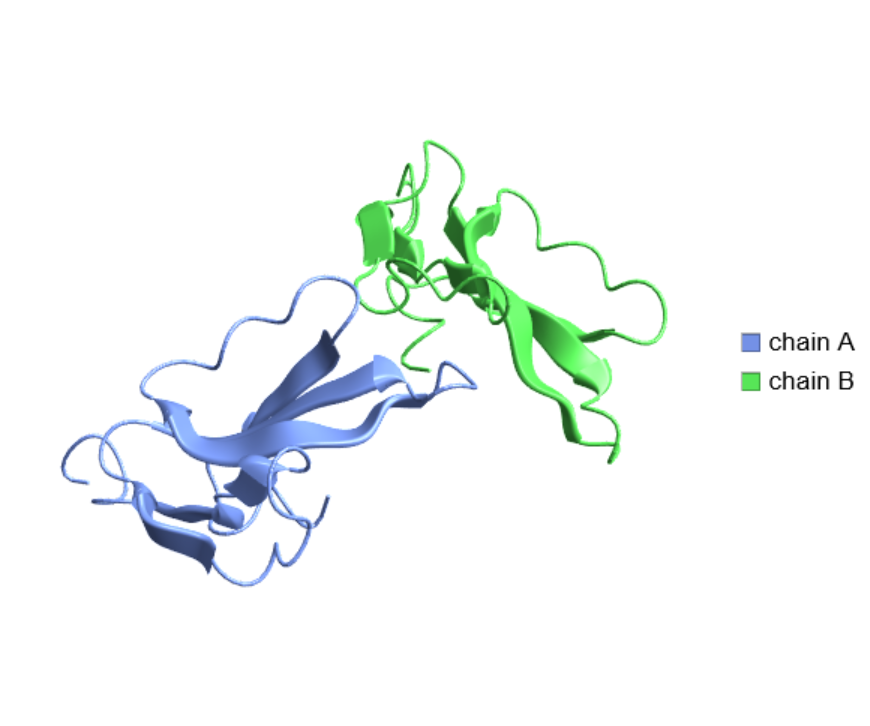 |
Create a legend based on the residues:
| In[18]:= |
| Out[18]= | 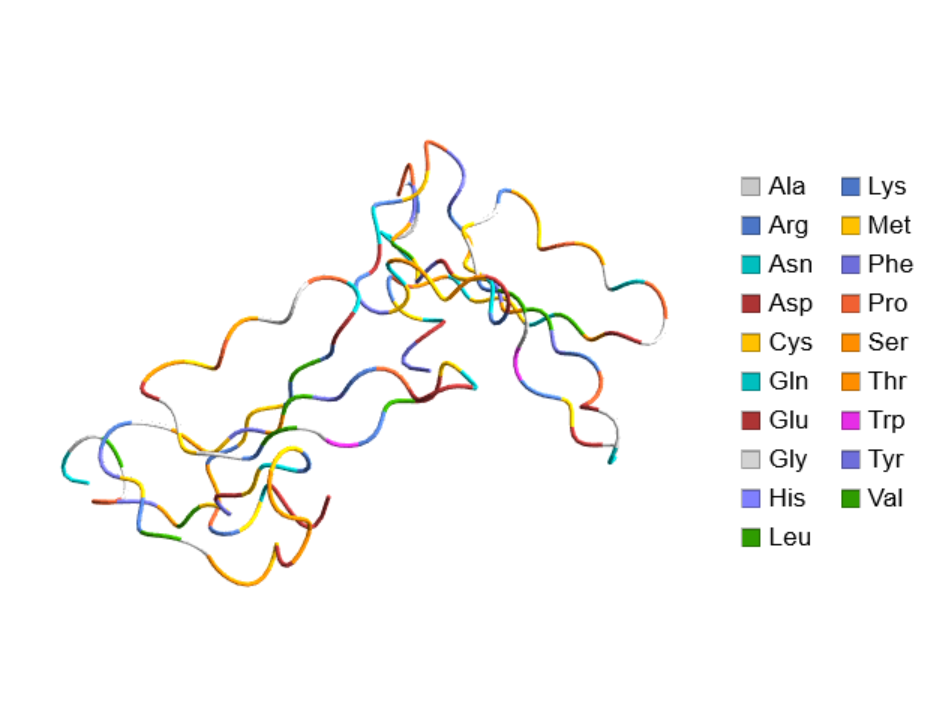 |
| In[19]:= |
| Out[19]= | 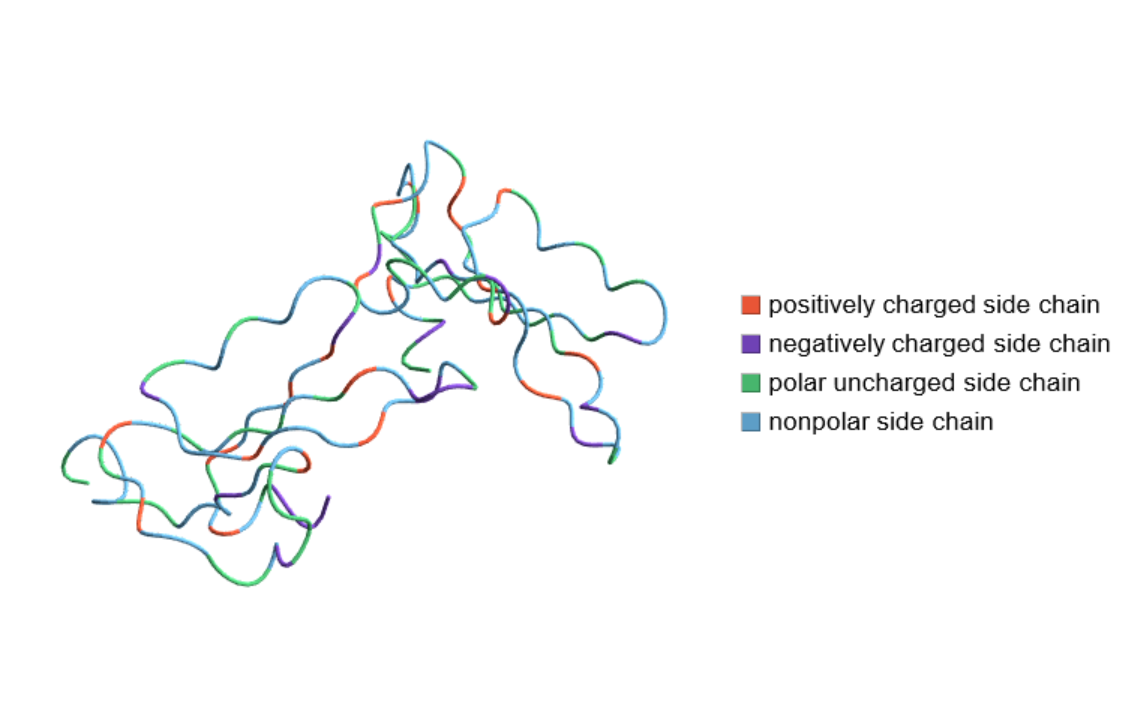 |
Show the heme ligand in myoglobin:
| In[20]:= |
| Out[20]= | 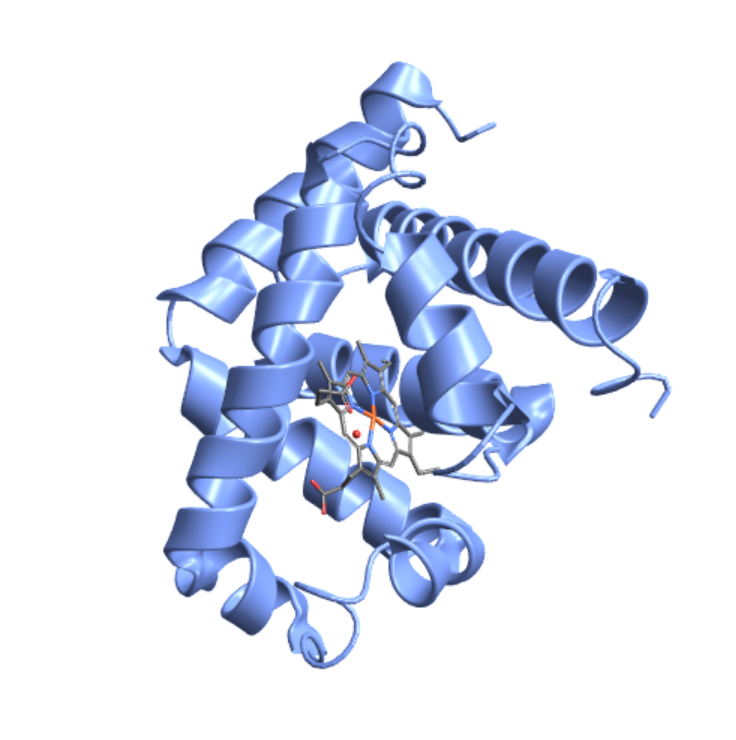 |
Use the Japanese PDB mirror as the source:
| In[21]:= |
| Out[21]= | 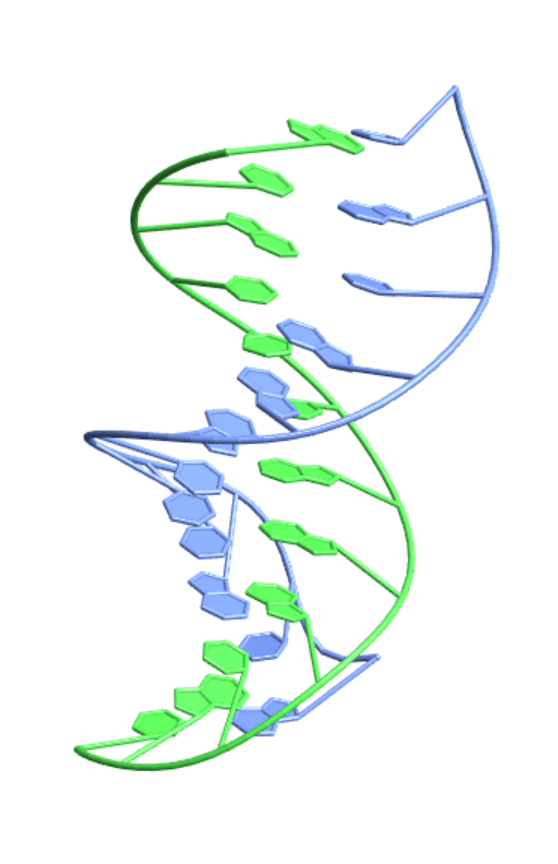 |
Visualize the structure of triose phosphate isomerase from Gallus gallus, one of the first proteins visualized by Jane Richardson as a ribbon diagram:
| In[22]:= |
| Out[22]= | 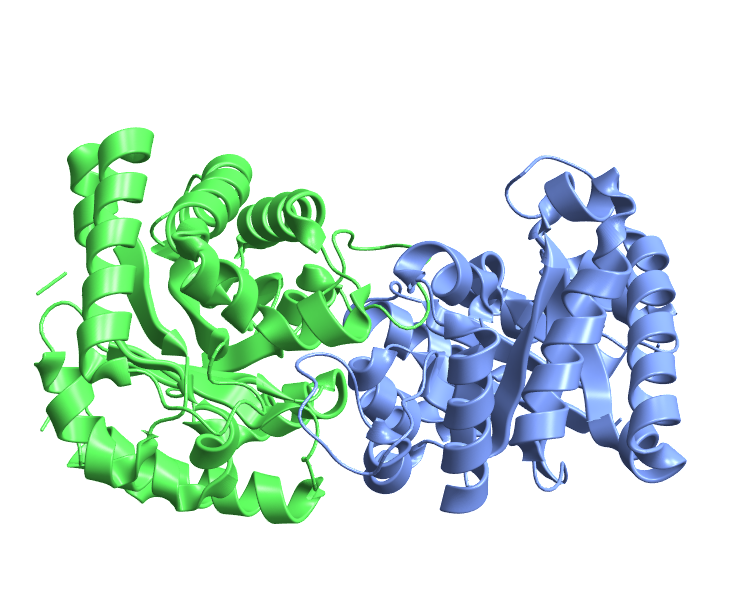 |
Visualize the structure of green fluorescent protein from the jellyfish Aequorea victoria, which has a β-barrel motif:
| In[23]:= |
| Out[23]= | 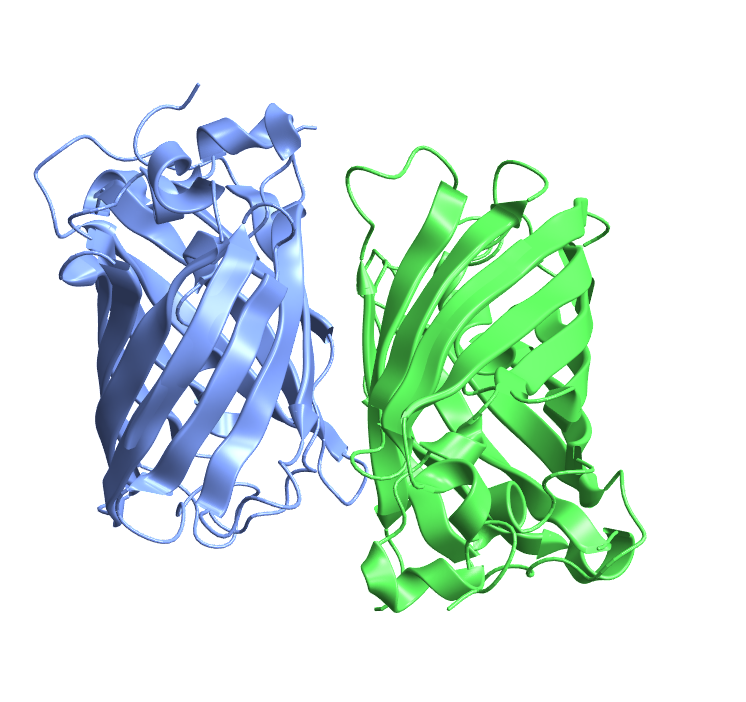 |
Visualize the structure of an antifreeze protein from the beetle Tenebrio molitor:
| In[24]:= |
| Out[24]= | 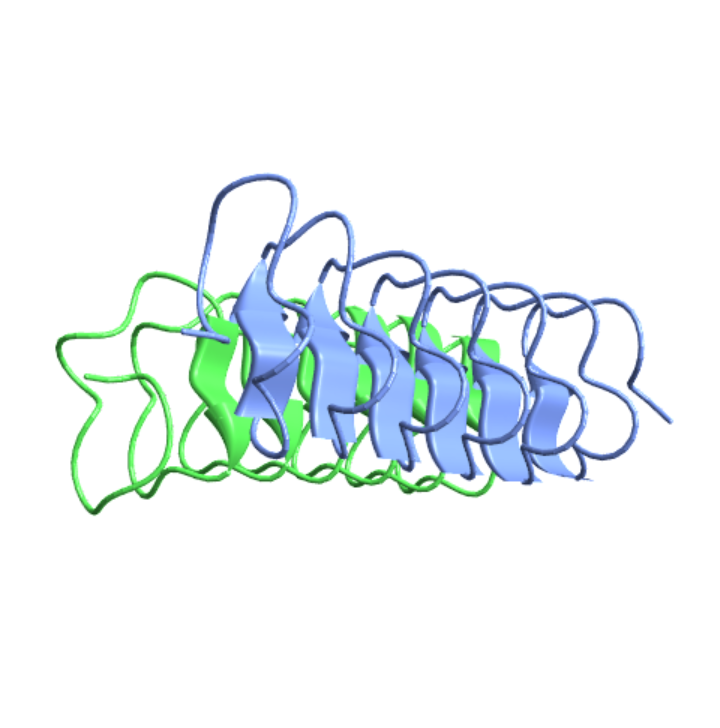 |
Visualize the structure of the anticancer agent L-asparaginase from Escherichia coli, which has multiple chains:
| In[25]:= |
| Out[25]= | 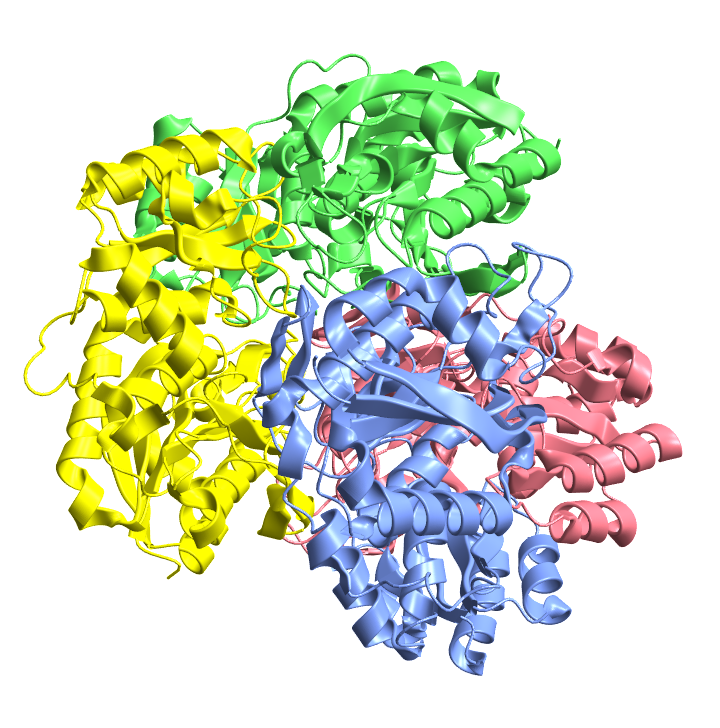 |
Visualize the interaction of ribosomal protein L5 from Thermus thermophilus with 5S rRNA from Escherichia coli:
| In[26]:= |
| Out[26]= | 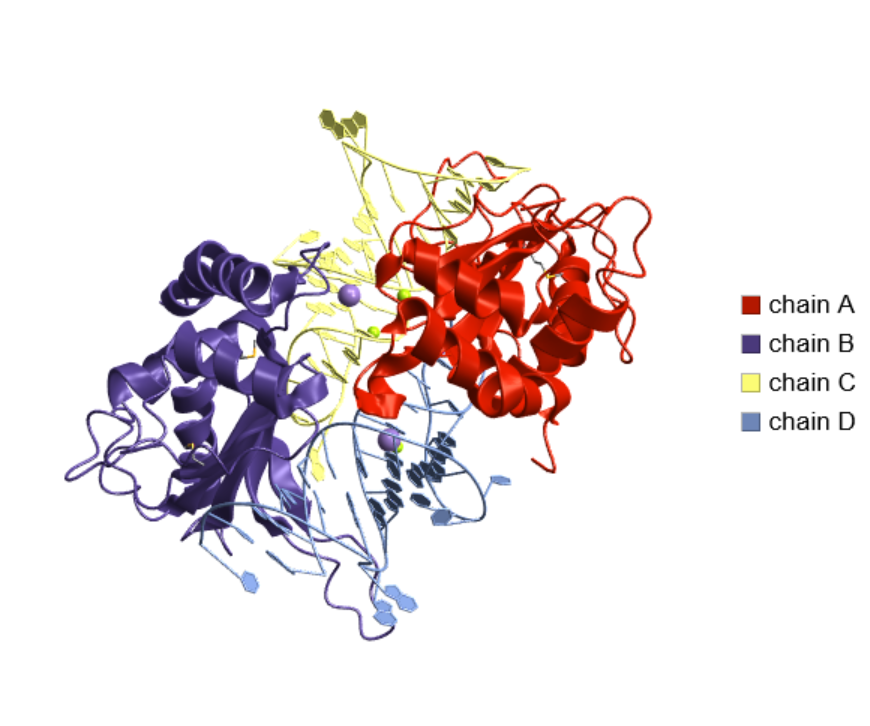 |
This work is licensed under a Creative Commons Attribution 4.0 International License