Wolfram Function Repository
Instant-use add-on functions for the Wolfram Language
Function Repository Resource:
Create a chain of Bézier curves that smoothly connects a list of points
ResourceFunction["BezierChain"][{p1,p2,…}] links the points pi with Bézier curves that smoothly flow into each other. |
| "Swing" | 1/3 | controls the width of curves at the corners; must be greater than 0 and less than or equal to 1 |
| "CurveType" | "Listed" | the type of curve: "Listed", "Joined" or "Filled" |
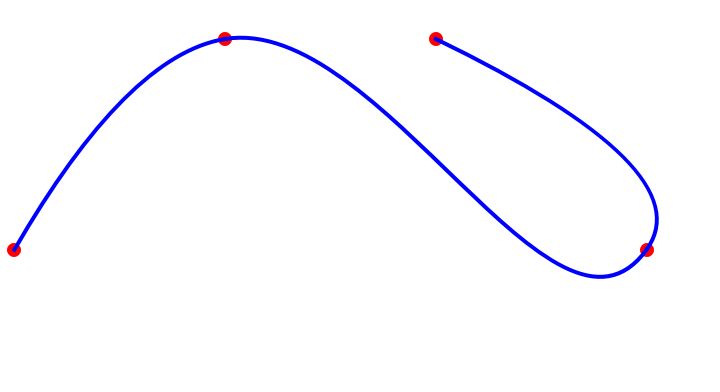
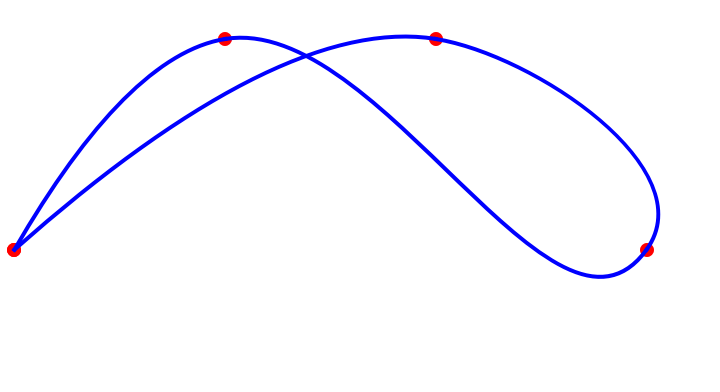
Make a curve that flows through points in 2D:
| In[1]:= |
![pts = {{0, 0}, {1, 1}, {3, 0}, {2, 1}};
Graphics[{
Red, PointSize[Large], Point[pts],
Blue, Thick, ResourceFunction["BezierChain"][pts]}]](https://www.wolframcloud.com/obj/resourcesystem/images/8f3/8f3bd618-cae4-4004-9b1d-4ee08ce72762/6fc560e185662e09.png)
|
| Out[2]= |
|
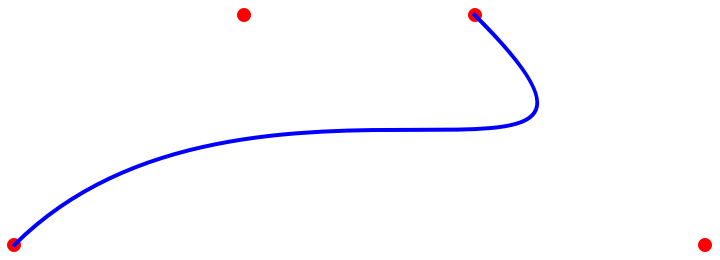
In contrast, an ordinary Bézier curve will not go through all the control points:
| In[3]:= |
![Graphics[{
Red, PointSize[Large], Point[pts],
Blue, Thick, BezierCurve[pts]}]](https://www.wolframcloud.com/obj/resourcesystem/images/8f3/8f3bd618-cae4-4004-9b1d-4ee08ce72762/3f7100c193cbdf0a.png)
|
| Out[3]= |
|
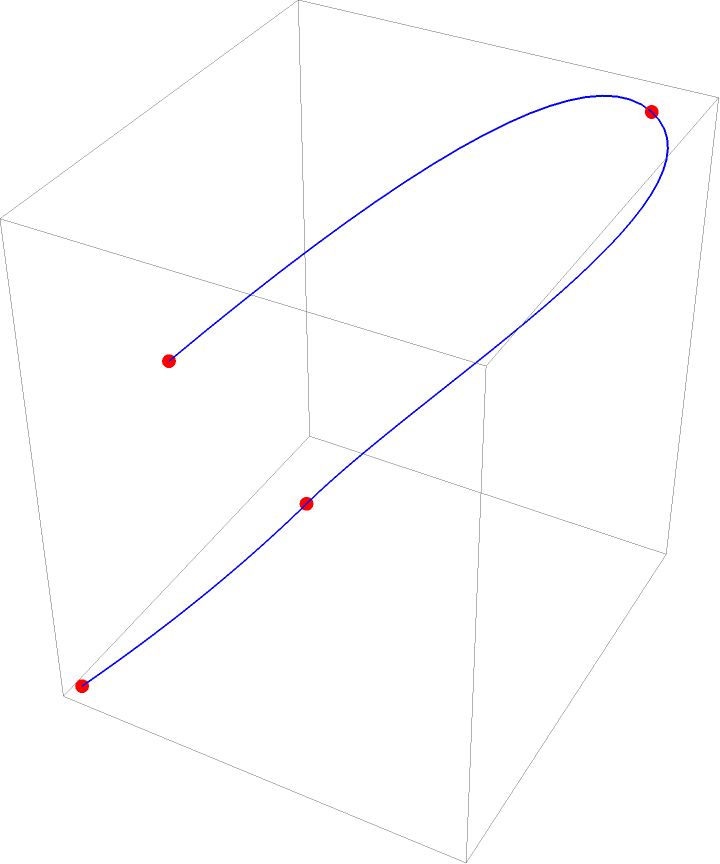
Make a curve that flows through points in 3D:
| In[4]:= |
![pts = Partition[RandomReal[{-1, 1}, 12], 3];
Graphics3D[{
Red, PointSize[Large], Point[pts],
Blue, Thick, ResourceFunction["BezierChain"][pts]}]](https://www.wolframcloud.com/obj/resourcesystem/images/8f3/8f3bd618-cae4-4004-9b1d-4ee08ce72762/6e50ca417b7db308.png)
|
| Out[5]= |
|
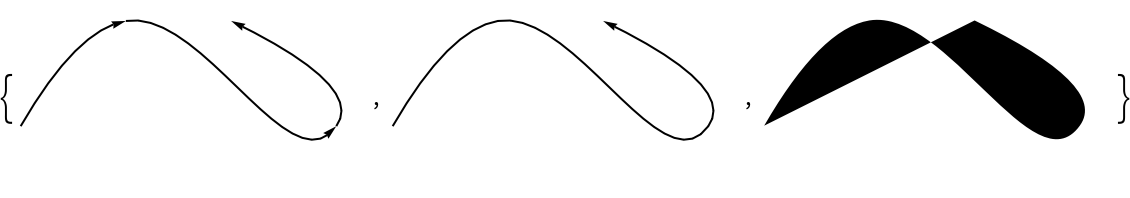
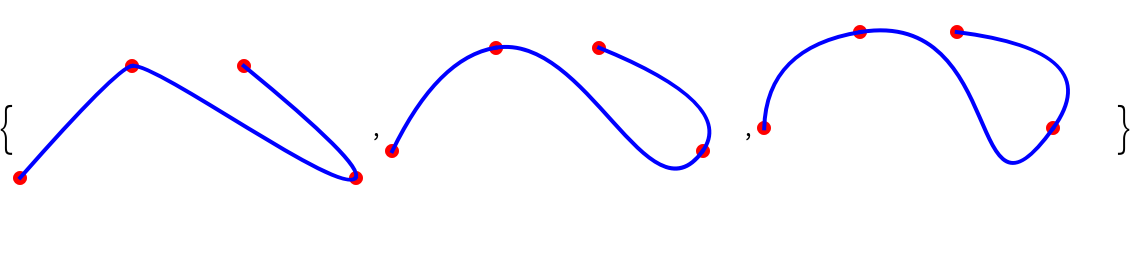
The "CurveType" option changes the type of 2D curve returned:
| In[6]:= |
![pt = {{0, 0}, {1, 1}, {3, 0}, {2, 1}};
l = Graphics[
Arrow[#] & /@ ResourceFunction["BezierChain"][pt, CurveType -> "Listed"]];
j = Graphics[
Arrow[ResourceFunction["BezierChain"][pt, CurveType -> "Joined"]]];
f = Graphics[
ResourceFunction["BezierChain"][pt, CurveType -> "Filled"]];
{l, j, f}](https://www.wolframcloud.com/obj/resourcesystem/images/8f3/8f3bd618-cae4-4004-9b1d-4ee08ce72762/35977de5fa045070.png)
|
| Out[10]= |
|
The "Swing" option, which has an effective range of 0<n≤1, controls how curvy the connection is between Bézier sections:
| In[11]:= |
![pts = {{0, 0}, {1, 1}, {3, 0}, {2, 1}};
Table[Graphics[{
Red, PointSize[Large], Point[pts],
Blue, Thick, ResourceFunction["BezierChain"][pts, "Swing" -> s]}, ImageSize -> Small], {s, {.1, .4, .7}}]](https://www.wolframcloud.com/obj/resourcesystem/images/8f3/8f3bd618-cae4-4004-9b1d-4ee08ce72762/4e728f032bd1b1eb.png)
|
| Out[12]= |
|
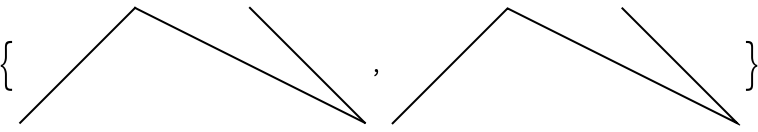
A swing value of 0 is equivalent to using Line:
| In[13]:= |
![pt = {{0, 0}, {1, 1}, {3, 0}, {2, 1}};
{Graphics[ResourceFunction["BezierChain"][pt, "Swing" -> 0]], Graphics[Line[pt]]}](https://www.wolframcloud.com/obj/resourcesystem/images/8f3/8f3bd618-cae4-4004-9b1d-4ee08ce72762/4225bfb5e3a83912.png)
|
| Out[14]= |
|
Dynamically adjust the swing value:
| In[15]:= |
![pt = {{0, 0}, {1, 1}, {3, 0}, {2, 1}};
Manipulate[
Graphics[{
Red, PointSize[Large], Point[pt],
Blue, Thick, ResourceFunction["BezierChain"][pt, "Swing" -> s]}, ImageSize -> Small], {{s, .5}, -3, 3}, SaveDefinitions -> True]](https://www.wolframcloud.com/obj/resourcesystem/images/8f3/8f3bd618-cae4-4004-9b1d-4ee08ce72762/529eb2a3e43c0a1a.png)
|
| Out[16]= |
|
If the first and last points coincide (to make it a closed curve), they will not be smoothly connected, but instead will show a cusp:
| In[17]:= |
![pts = {{0, 0}, {1, 1}, {3, 0}, {2, 1}, {0, 0}};
Graphics[{
Red, PointSize[Large], Point[pts],
Blue, Thick, ResourceFunction["BezierChain"][pts]}]](https://www.wolframcloud.com/obj/resourcesystem/images/8f3/8f3bd618-cae4-4004-9b1d-4ee08ce72762/206c074d384f37cd.png)
|
| Out[18]= |
|
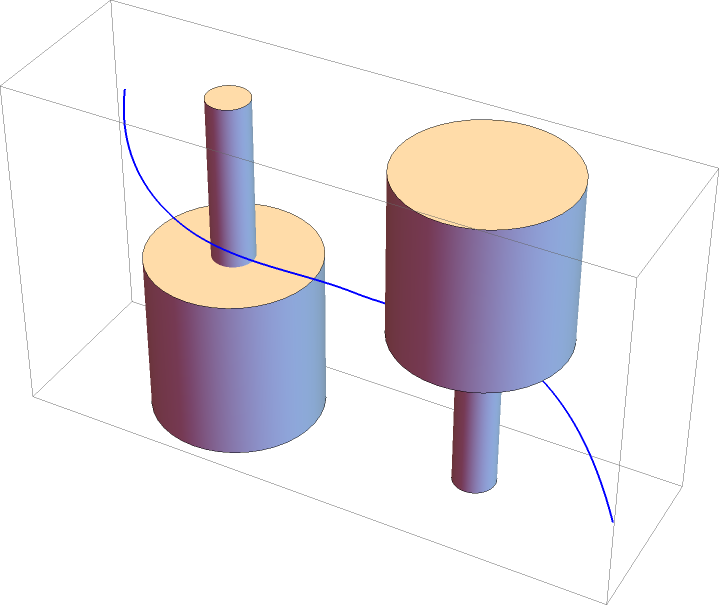
Trace a path in 2D or 3D space:
| In[19]:= |
![Graphics3D[{
Cylinder[{{0, 0, 1}, {0, 0, 4}}, .25],
Cylinder[{{0, 0, 0}, {0, 0, 2}}],
Cylinder[{{3, 0, 0}, {3, 0, 3}}, .25],
Cylinder[{{3, 0, 2}, {3, 0, 4}}],
Blue, Thick,
ResourceFunction[
"BezierChain"][{{-2, 1, 3}, {0, -1, 3}, {1.5, 0, 2}, {3, 1, 1}, {5, -1, 1}}]
}]](https://www.wolframcloud.com/obj/resourcesystem/images/8f3/8f3bd618-cae4-4004-9b1d-4ee08ce72762/30fcc982dfef5888.png)
|
| Out[19]= |
|
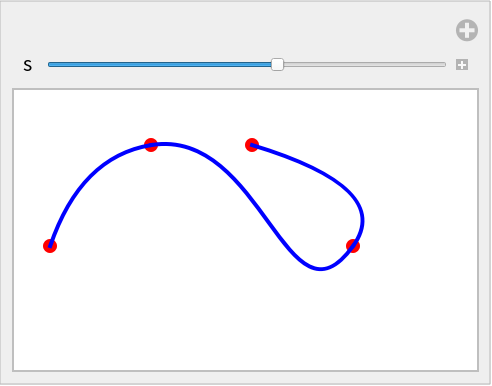
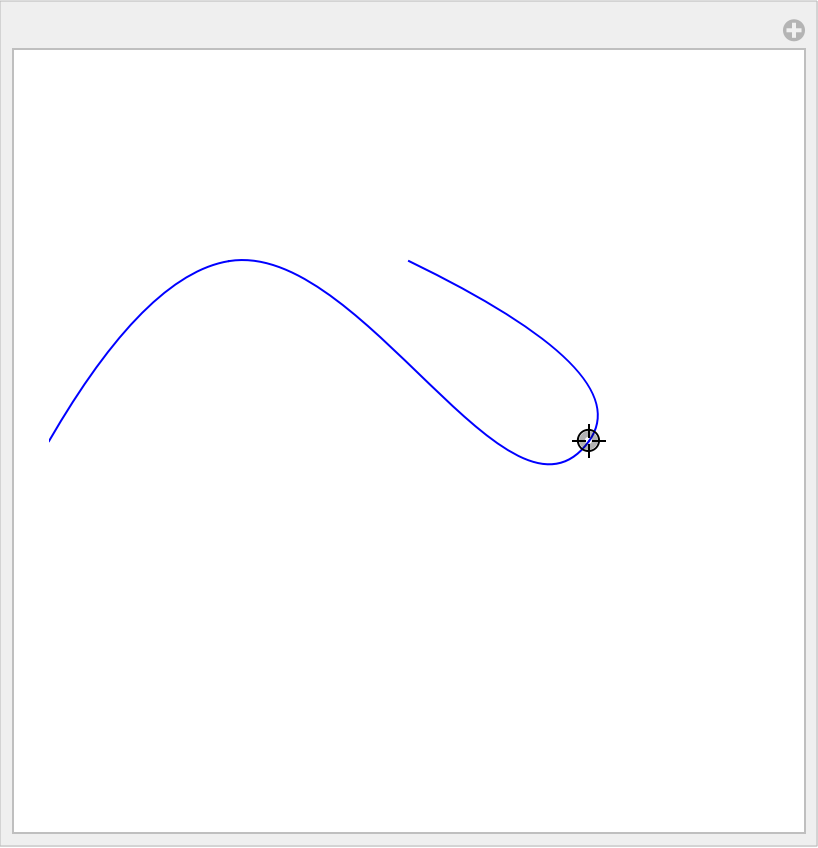
Make the points dynamic, as in this Manipulate:
| In[20]:= |
![Manipulate[
pts = {{0, 0}, {1, 1}, pt3, {2, 1}}; Graphics[{Blue, ResourceFunction["BezierChain"][pts]}, PlotRange -> {{0, 4}, {-2, 2}}],
{{pt3, {3, 0}}, Locator}, SaveDefinitions -> True]](https://www.wolframcloud.com/obj/resourcesystem/images/8f3/8f3bd618-cae4-4004-9b1d-4ee08ce72762/41344caa6e2a5c3c.png)
|
| Out[20]= |
|
Simulate handwriting:
| In[21]:= |
![pt = {{{0, 0}, {4, 5.2}, {5.2, 9}, {2, 0}}, {{2, 0}, {3.9, 3.7}, {5, 0}, {6.5, .2}}};
Graphics[{Thick, Darker[Blue],
ResourceFunction["BezierChain"][pt[[1]], "Swing" -> .2],
ResourceFunction["BezierChain"][pt[[2]]]}, ImageSize -> Small]](https://www.wolframcloud.com/obj/resourcesystem/images/8f3/8f3bd618-cae4-4004-9b1d-4ee08ce72762/0c749669d90c7650.png)
|
| Out[22]= |

|
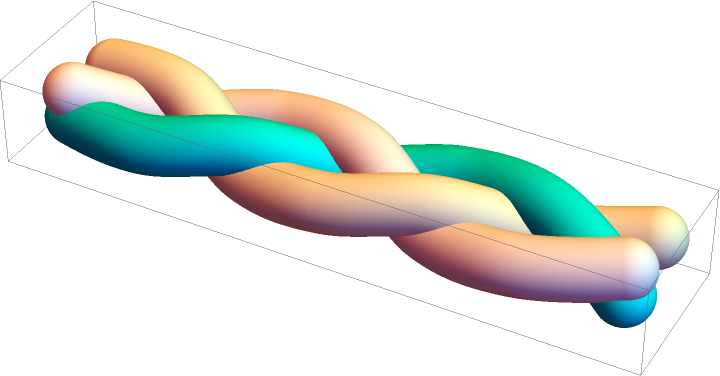
Braid tubes:
| In[23]:= |
![pts = {{{0, -0.5, -0.3}, {2, -1, 0}, {4, -0.5, 0.3}, {6, 0.5, -0.3}, {
8, 1, 0}, {10, 0.5, 0.3}, {12, -0.5, -0.3}}, {{0, -0.5, 0.3}, {
2, 0.5, -0.3}, {4, 1, 0}, {6, 0.5, 0.3}, {8, -0.5, -0.3}, {10, -1,
0}, {12, -0.5, 0.3}}, {{0, 1, 0}, {2, 0.5, 0.3}, {
4, -0.5, -0.3}, {6, -1, 0}, {8, -0.5, 0.3}, {10, 0.5, -0.3}, {12, 1, 0}}};
bez = ResourceFunction["BezierChain"][#] /. a_BezierCurve -> Tube[a, .6] & /@ pts;
Graphics3D[Riffle[{Cyan, White, LightYellow}, bez]]](https://www.wolframcloud.com/obj/resourcesystem/images/8f3/8f3bd618-cae4-4004-9b1d-4ee08ce72762/1abaa0acb0df5a12.png)
|
| Out[25]= |
|
This work is licensed under a Creative Commons Attribution 4.0 International License