Basic Examples (3)
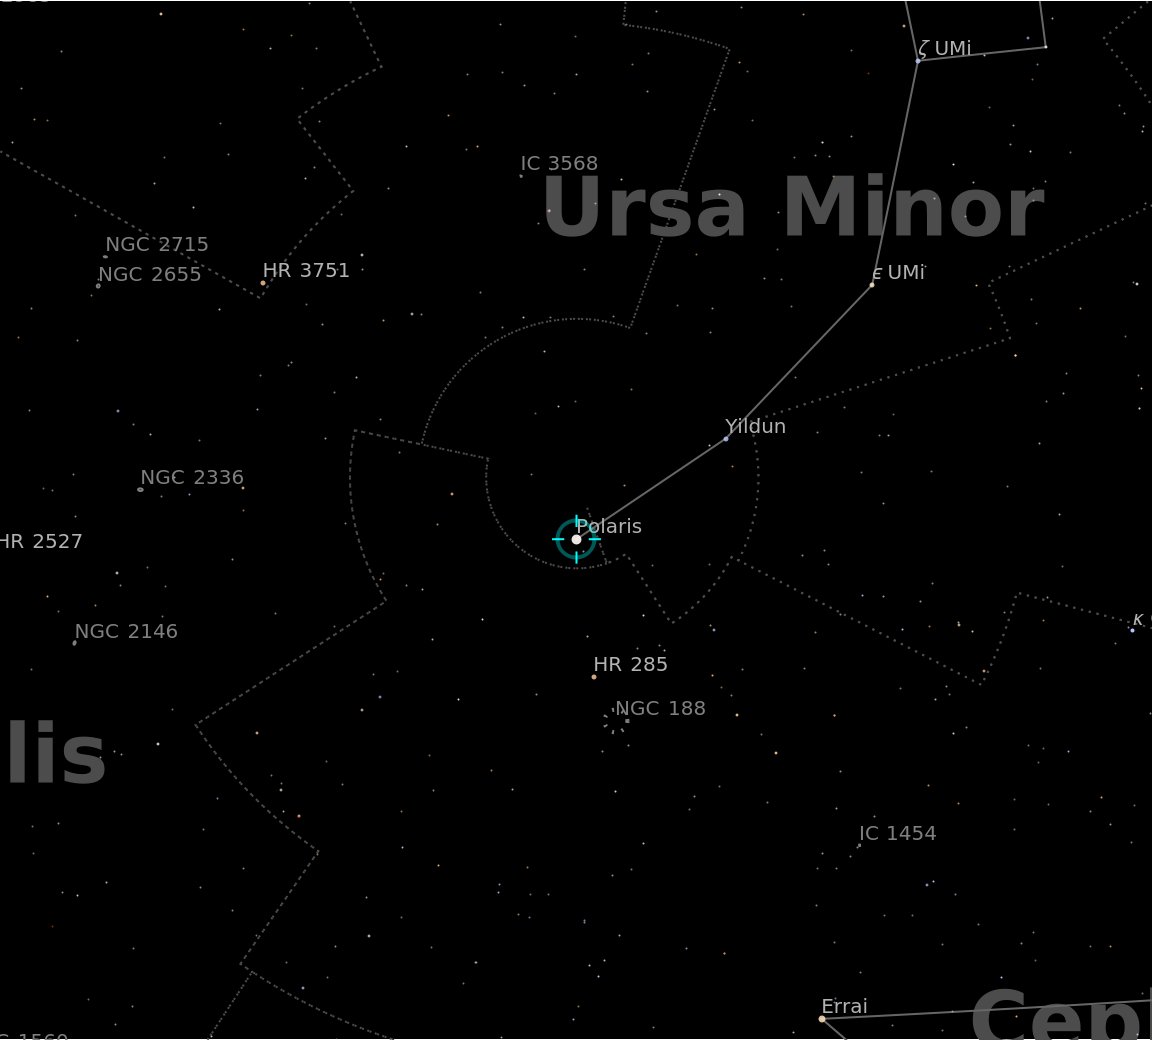
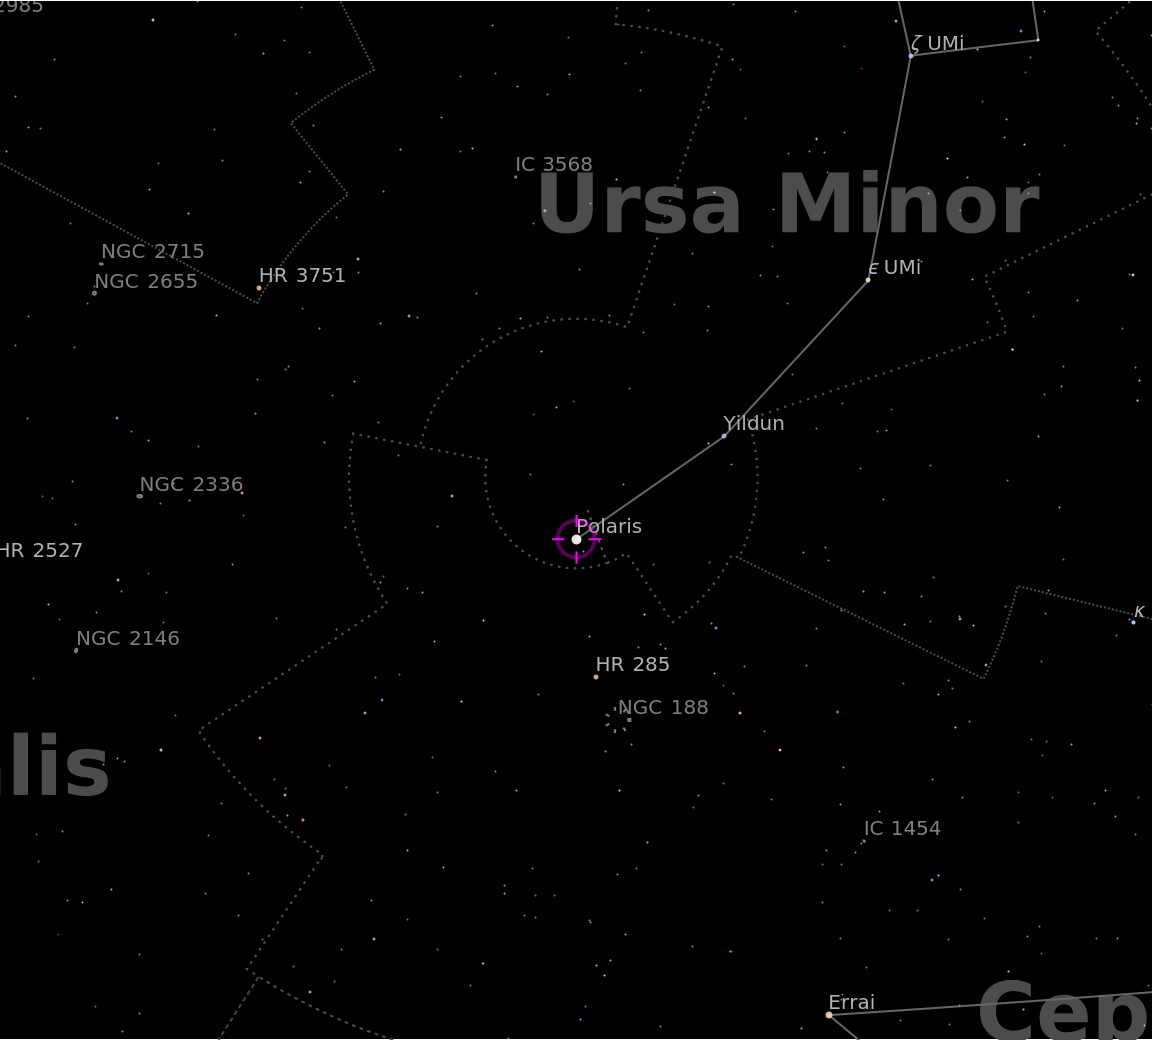
Visualize the Polaris from your location:
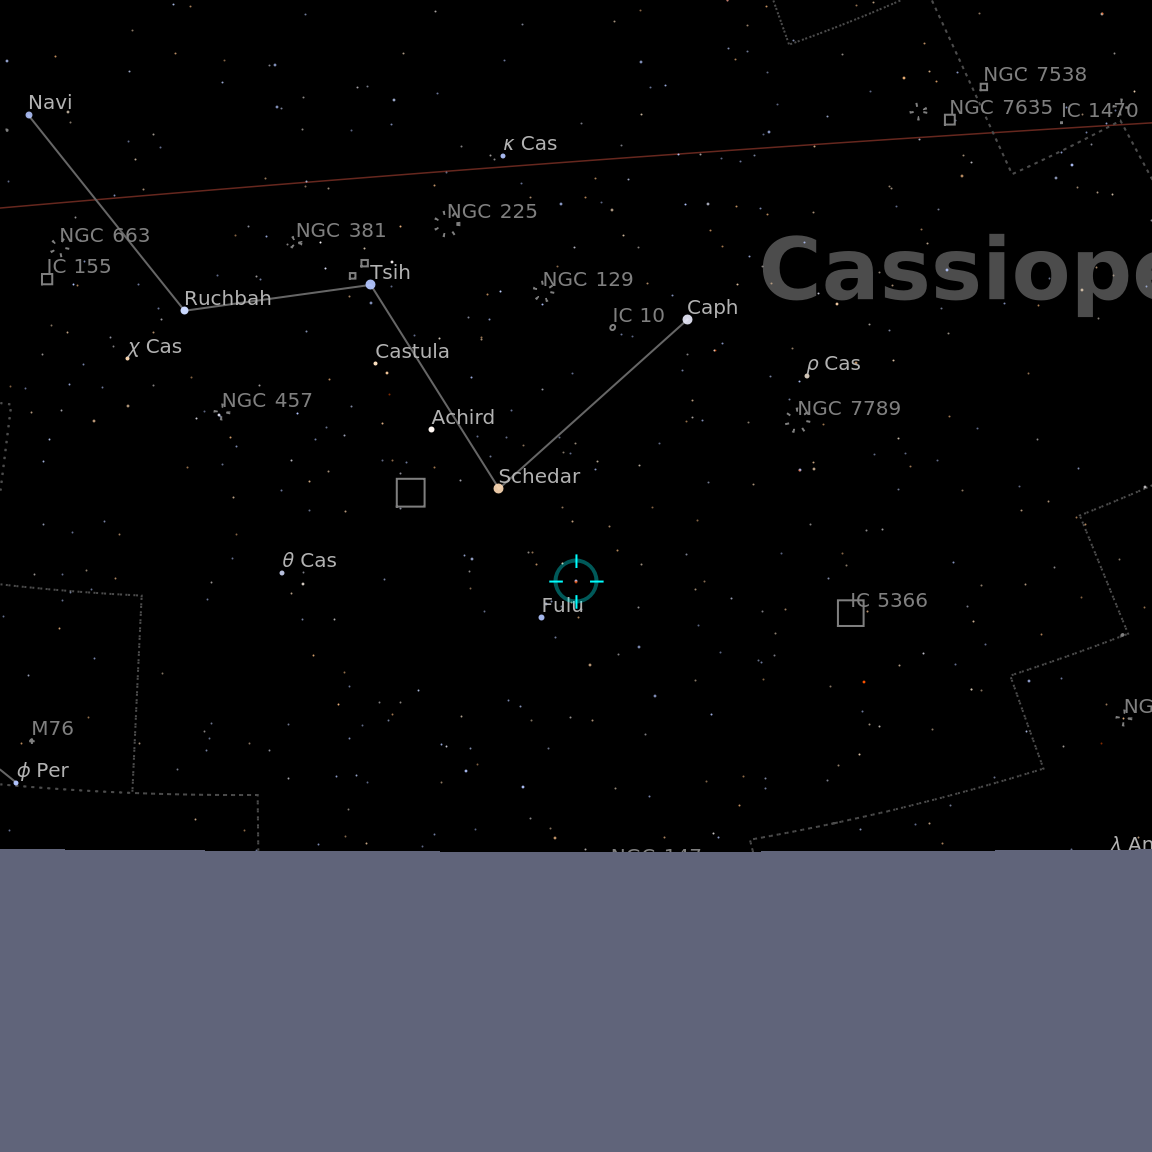
Visualize a less prominent star:
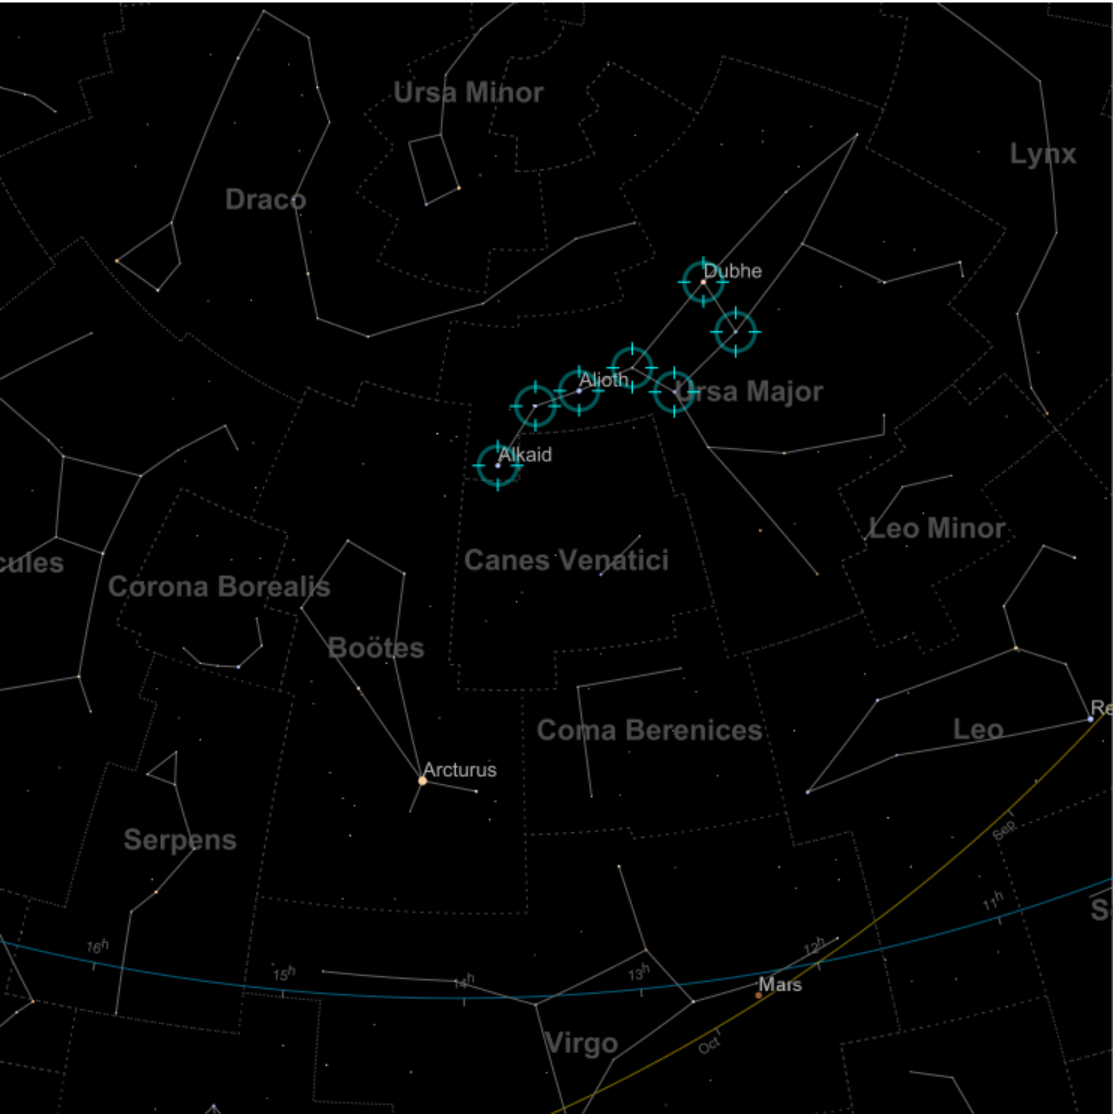
Visualize a list of stars:
Scope (3)
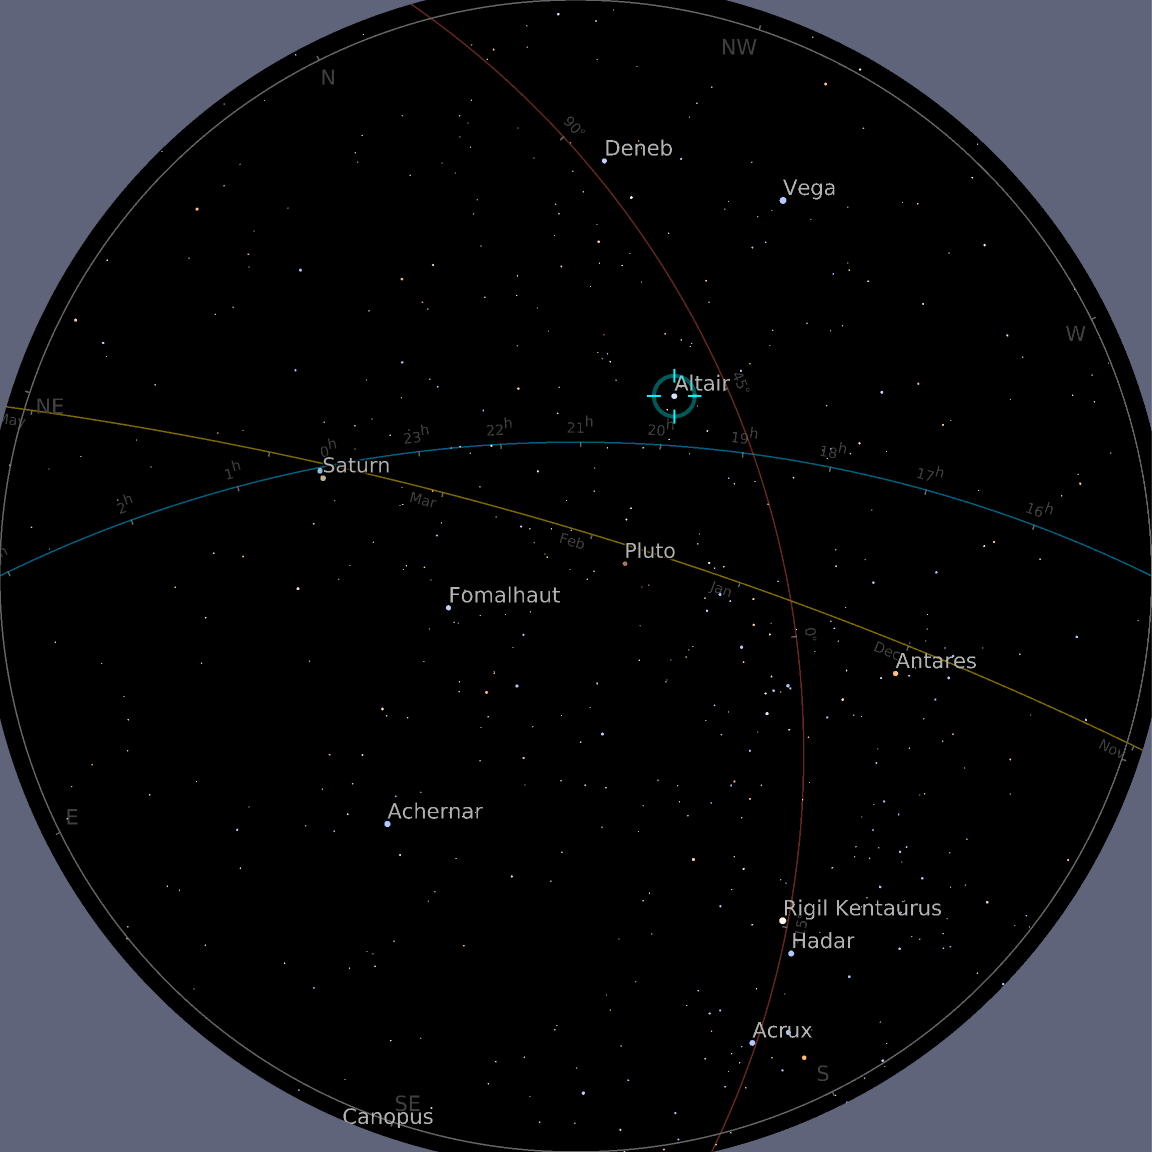
Visualize the current position of Altair from a specified location:
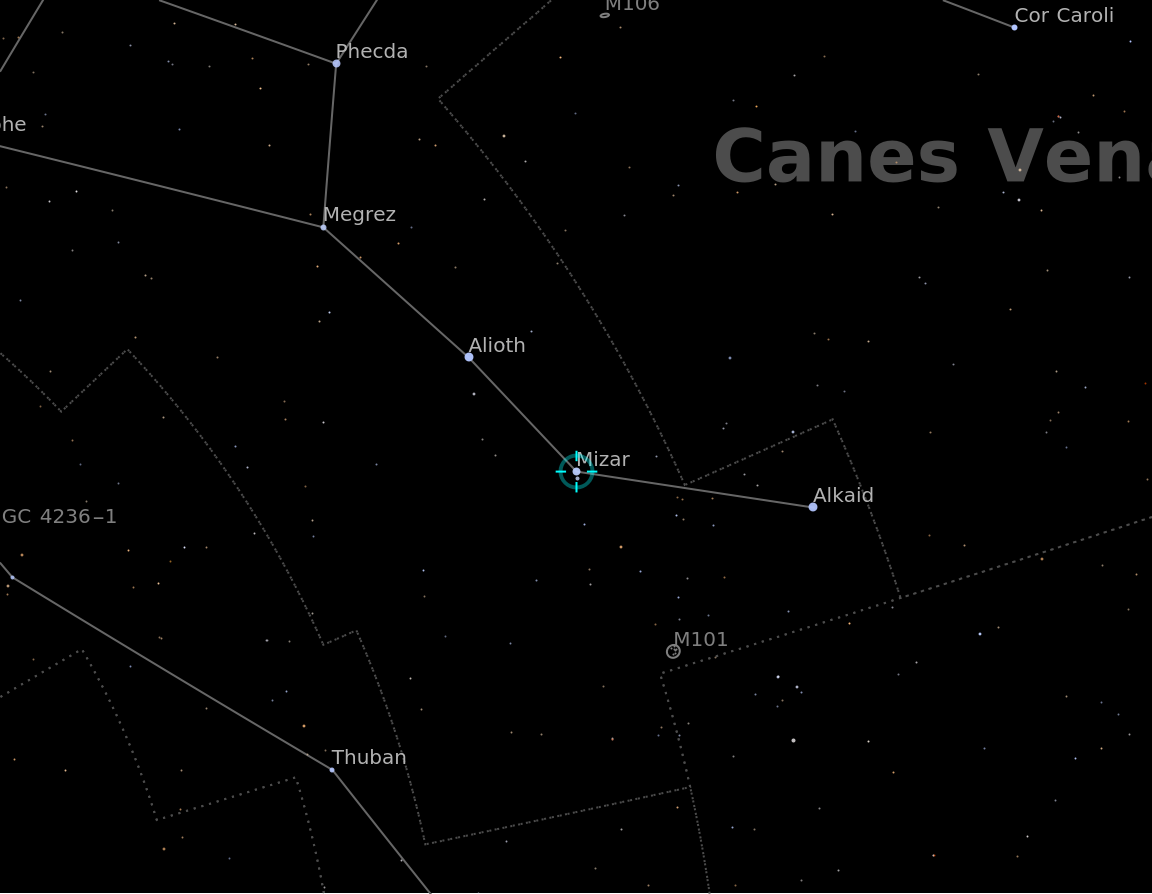
Visualize Mizar from a specified location and time:
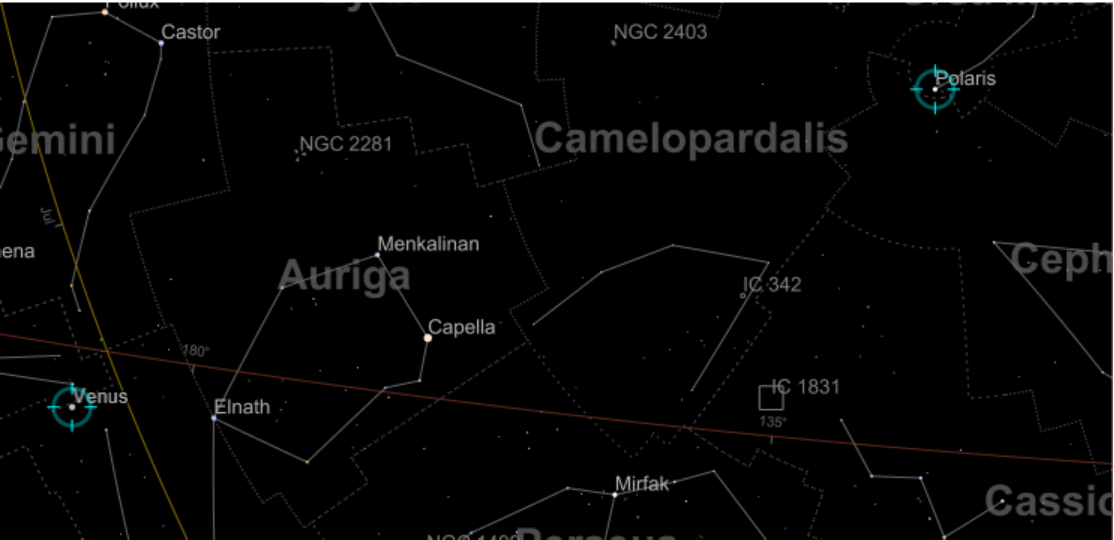
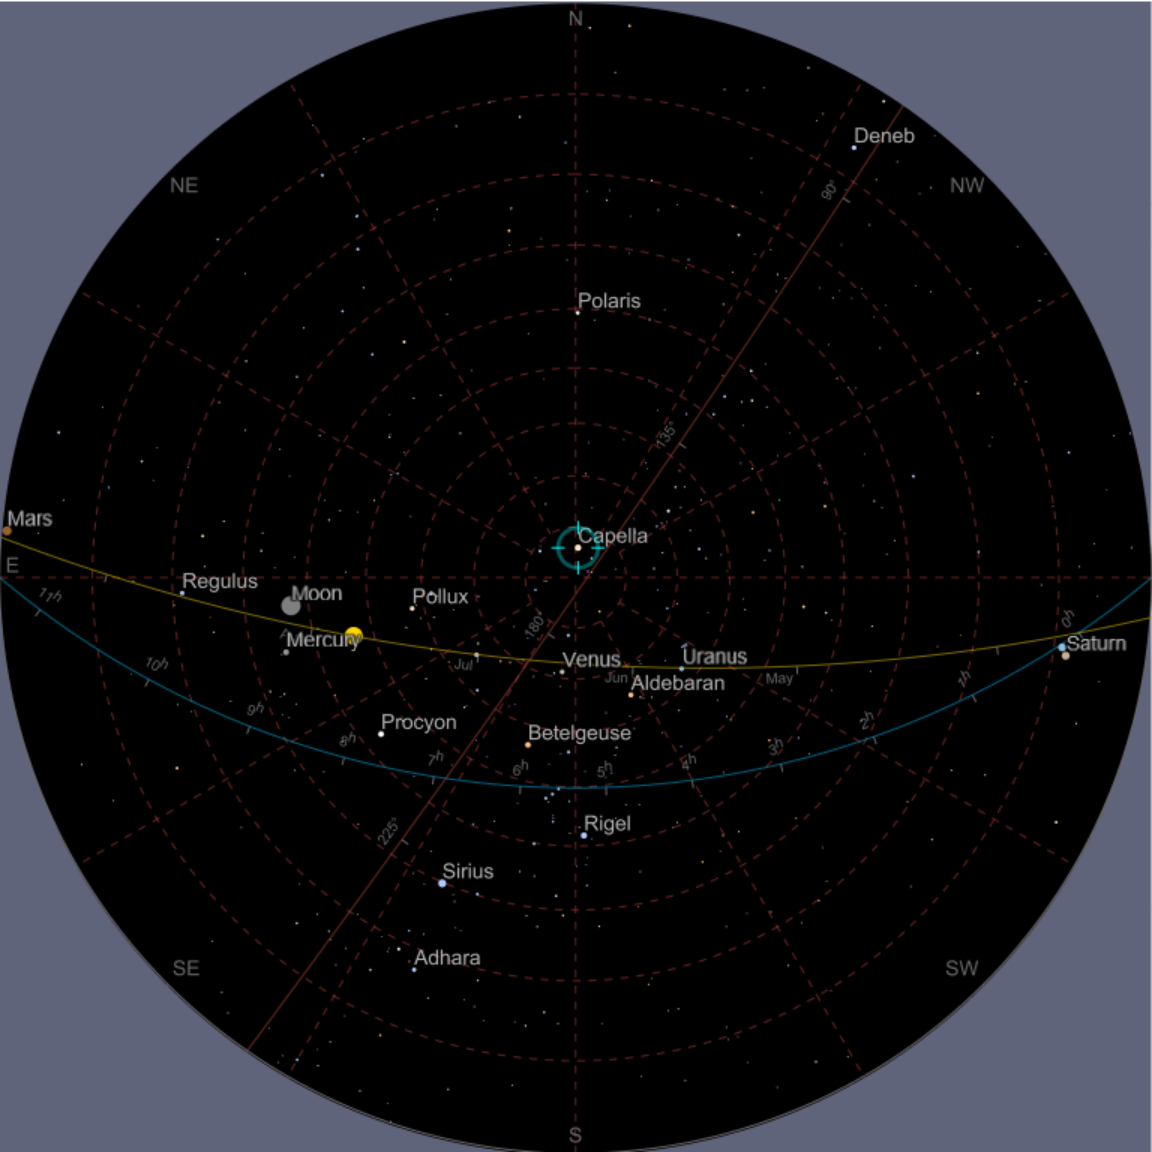
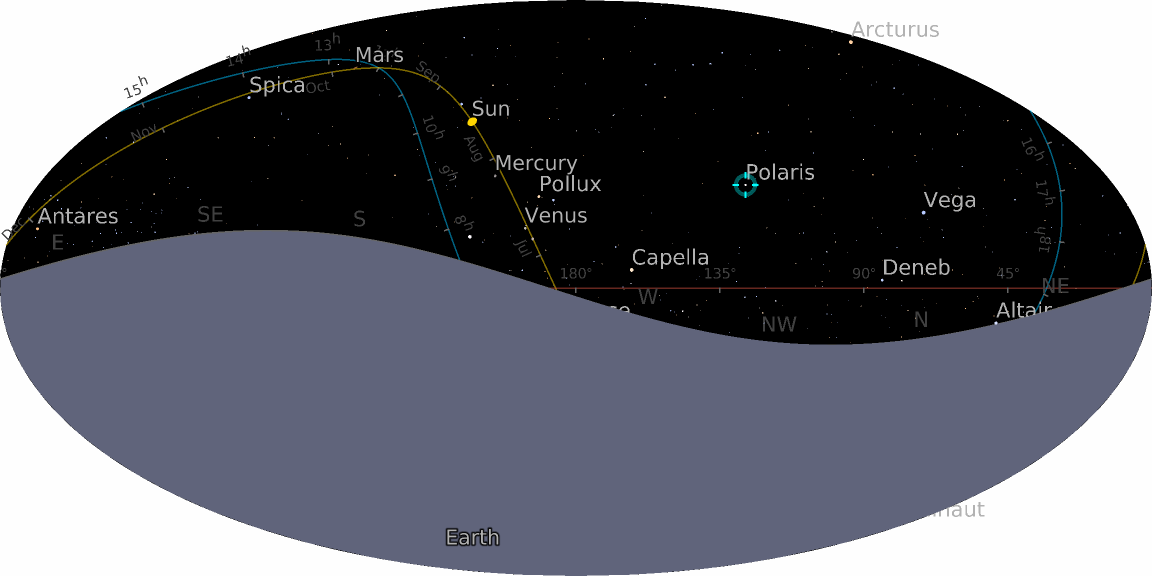
Visualize the sky from a specified location and time and highlight Polaris and Venus:
Options (19)
AstroBackground (6)
Visualize the sky with a white background:
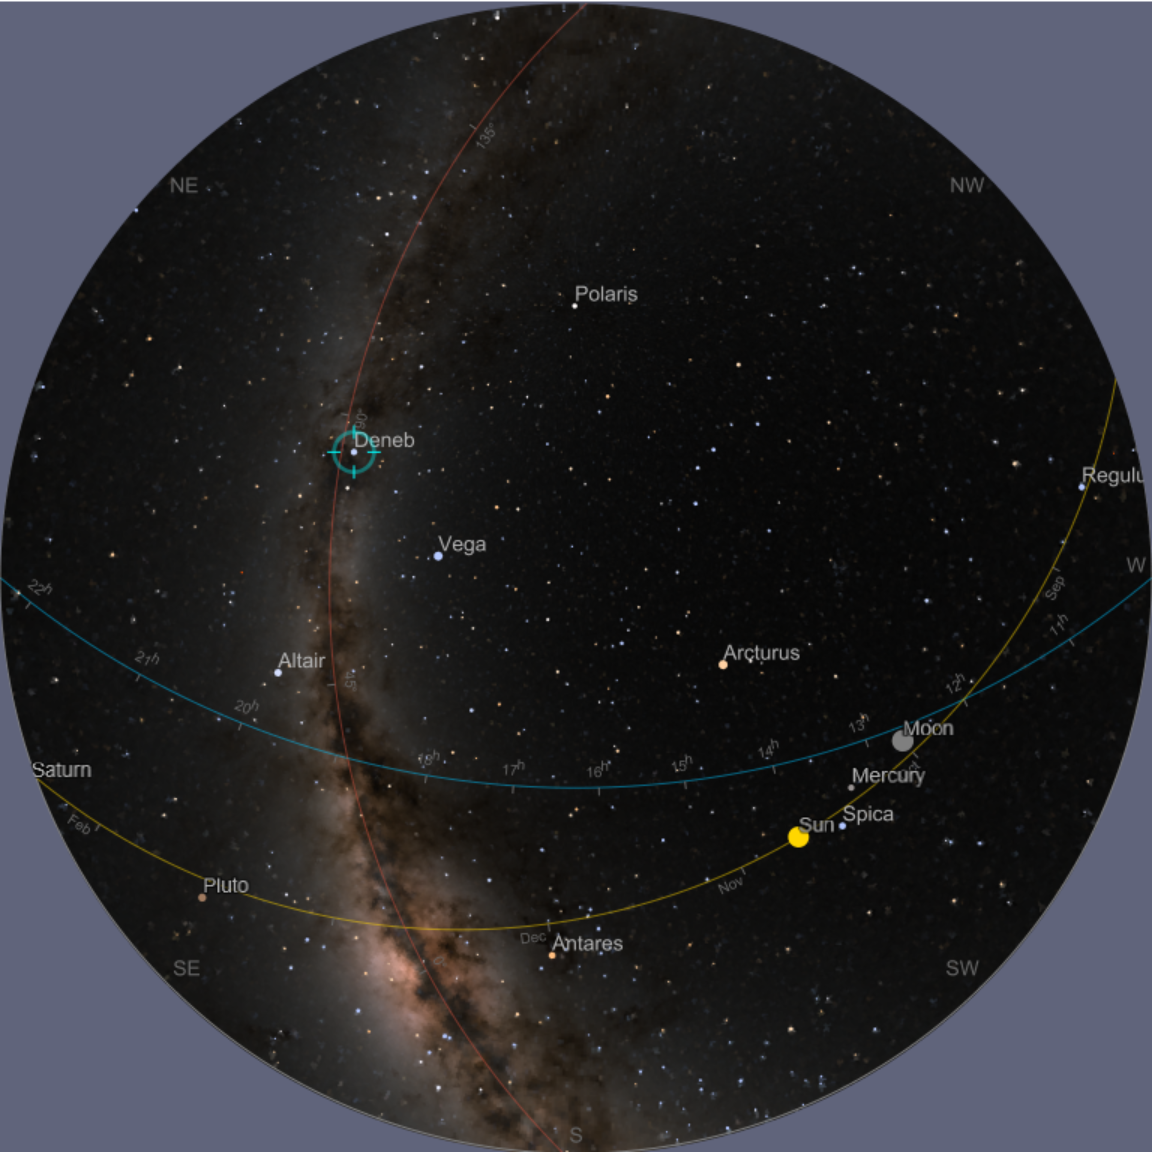
Use a background showing the Milky Way:
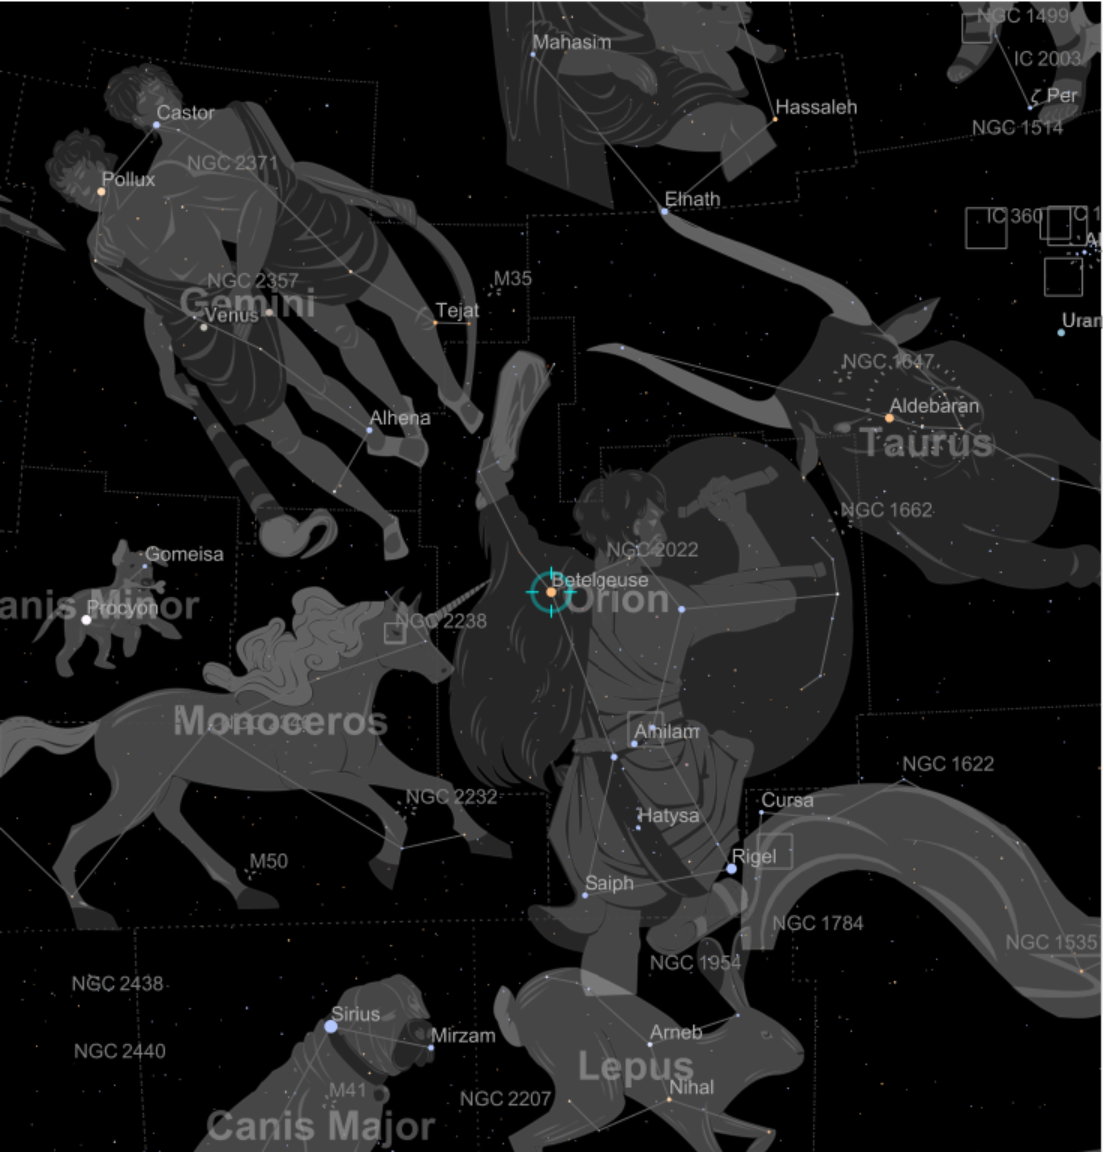
Add constellation illustrations and remove the equatorial, ecliptic and galactic planes:
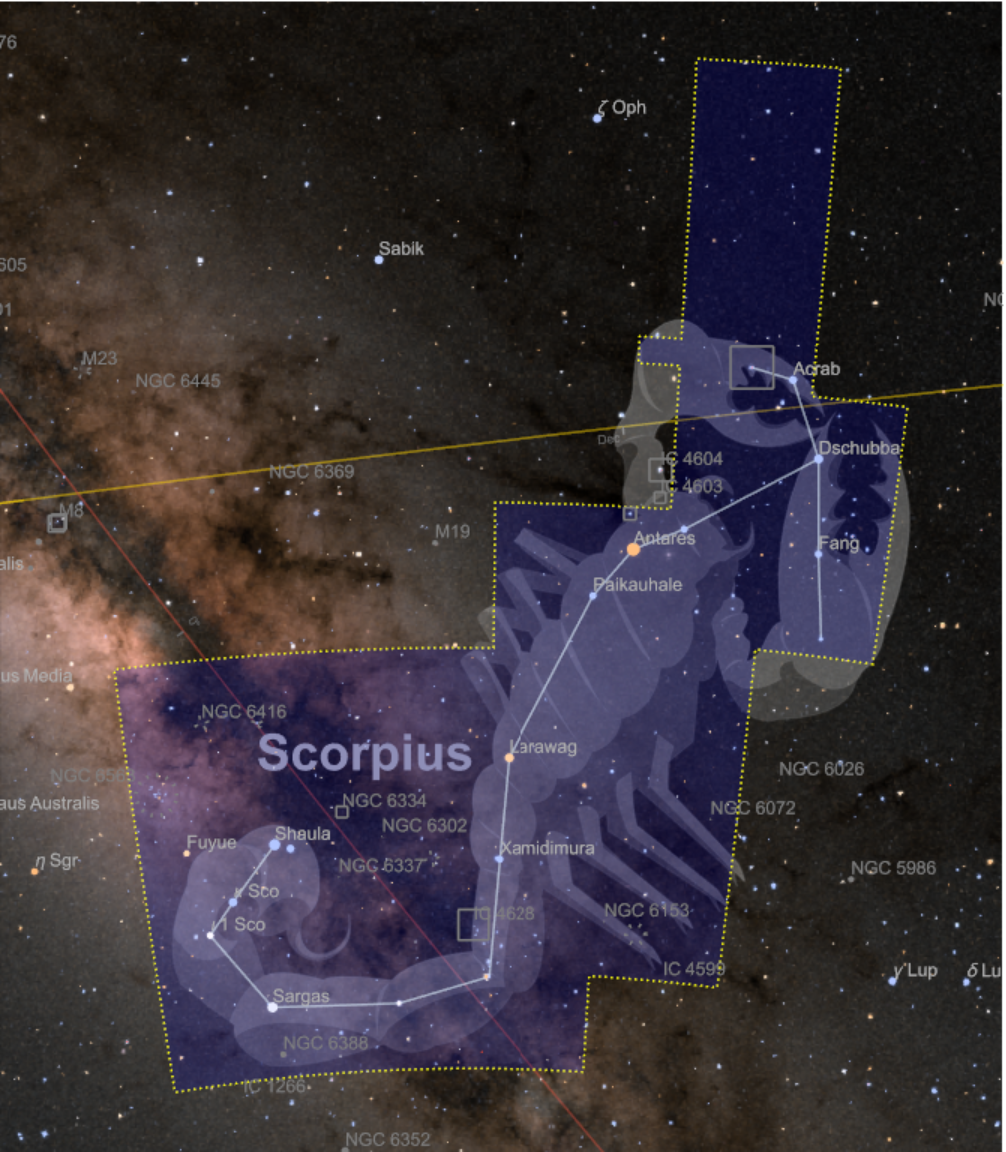
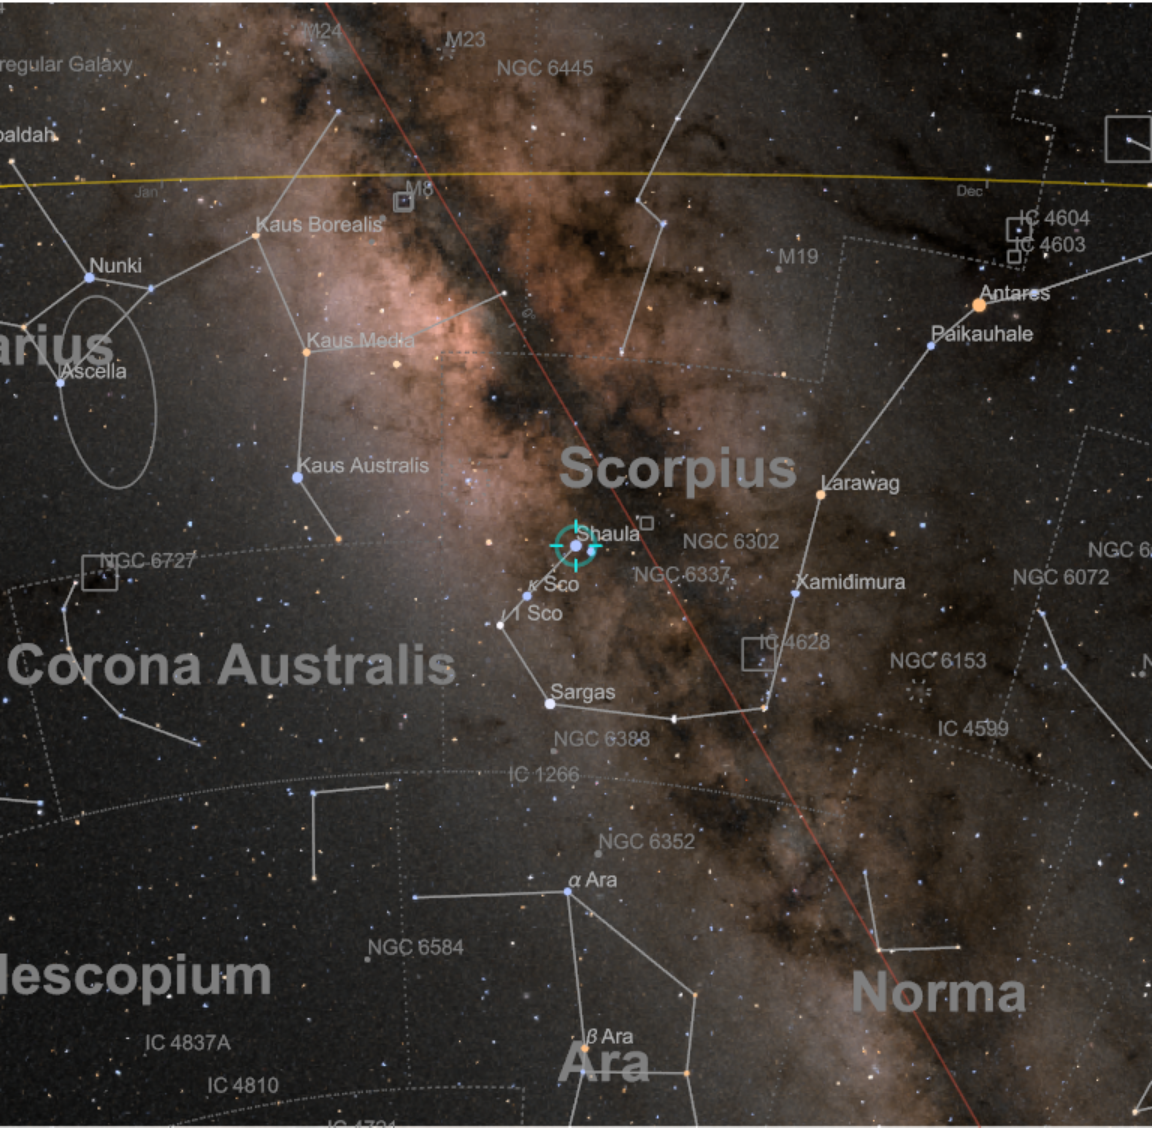
Visualize the sky and highlight specific constellation boundaries:
Visualize the sky with constellation lines:
AstroCenter (1)
Display Mercury and Venus, centering the map at the position of the Sun:
AstroGridLines (2)
Visualize the sky with the equatorial coordinate grid visible:
Use equatorial grid lines in the same ecliptic map:
AstroGridLinesStyle (1)
Change the default style of the astro grid lines:
AstroProjection (1)
Use different projections:
AstroRange (1)
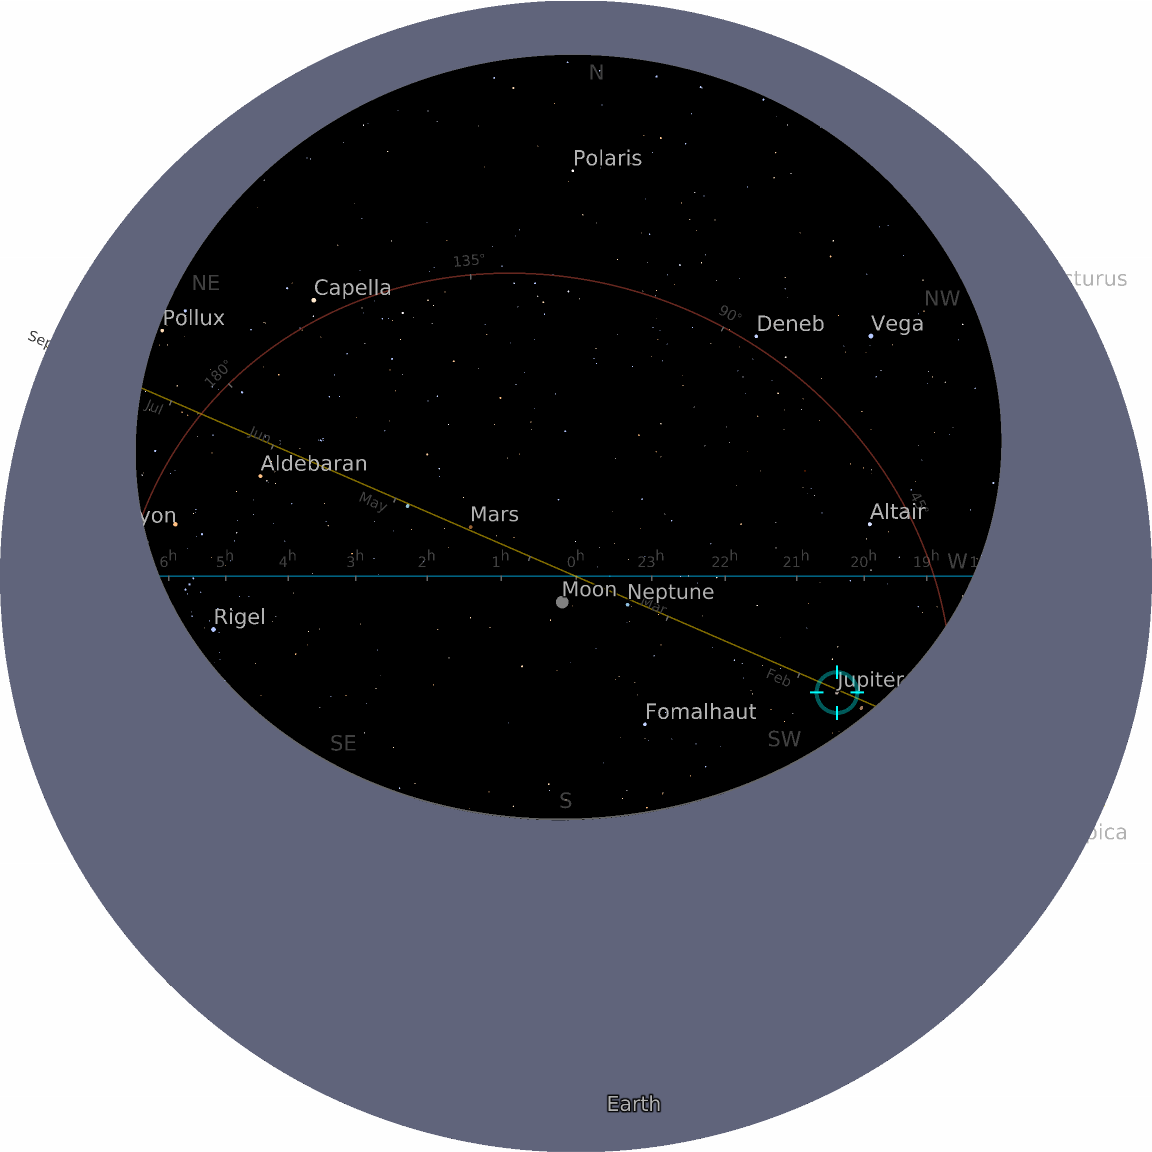
Show 10 angular degrees around the current position of Jupiter:
AstroRangePadding (1)
Add 5 angular degrees of padding in all directions around the range including two stars:
AstroReferenceFrame (4)
By default, AstroListPlot uses the local horizon frame and the "Stereographic" projection:
Show the full sky, using the equatorial frame, in the "Equirectangular" projection:
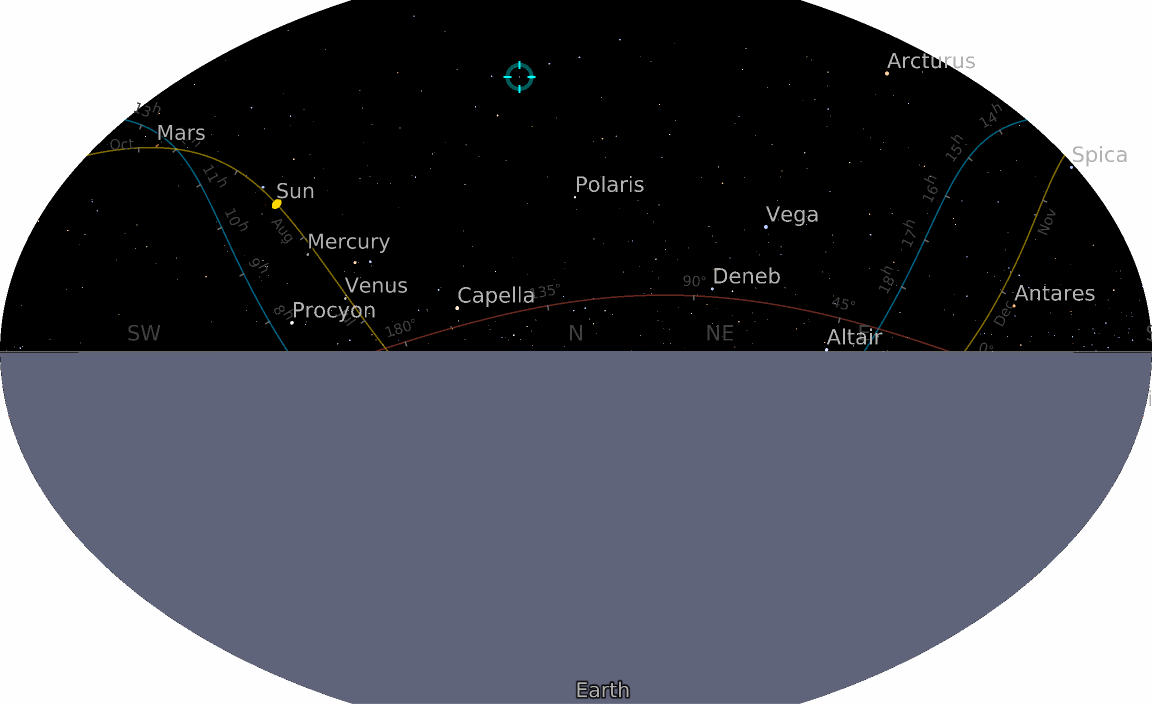
Show the full sky, using the ecliptic frame, in the "Equirectangular" projection:
Show the full sky, using the galactic frame, with the result using the "Mollweide" projection:
MarkerColor (1)
Change the color of the marker:
MarkerSize (1)
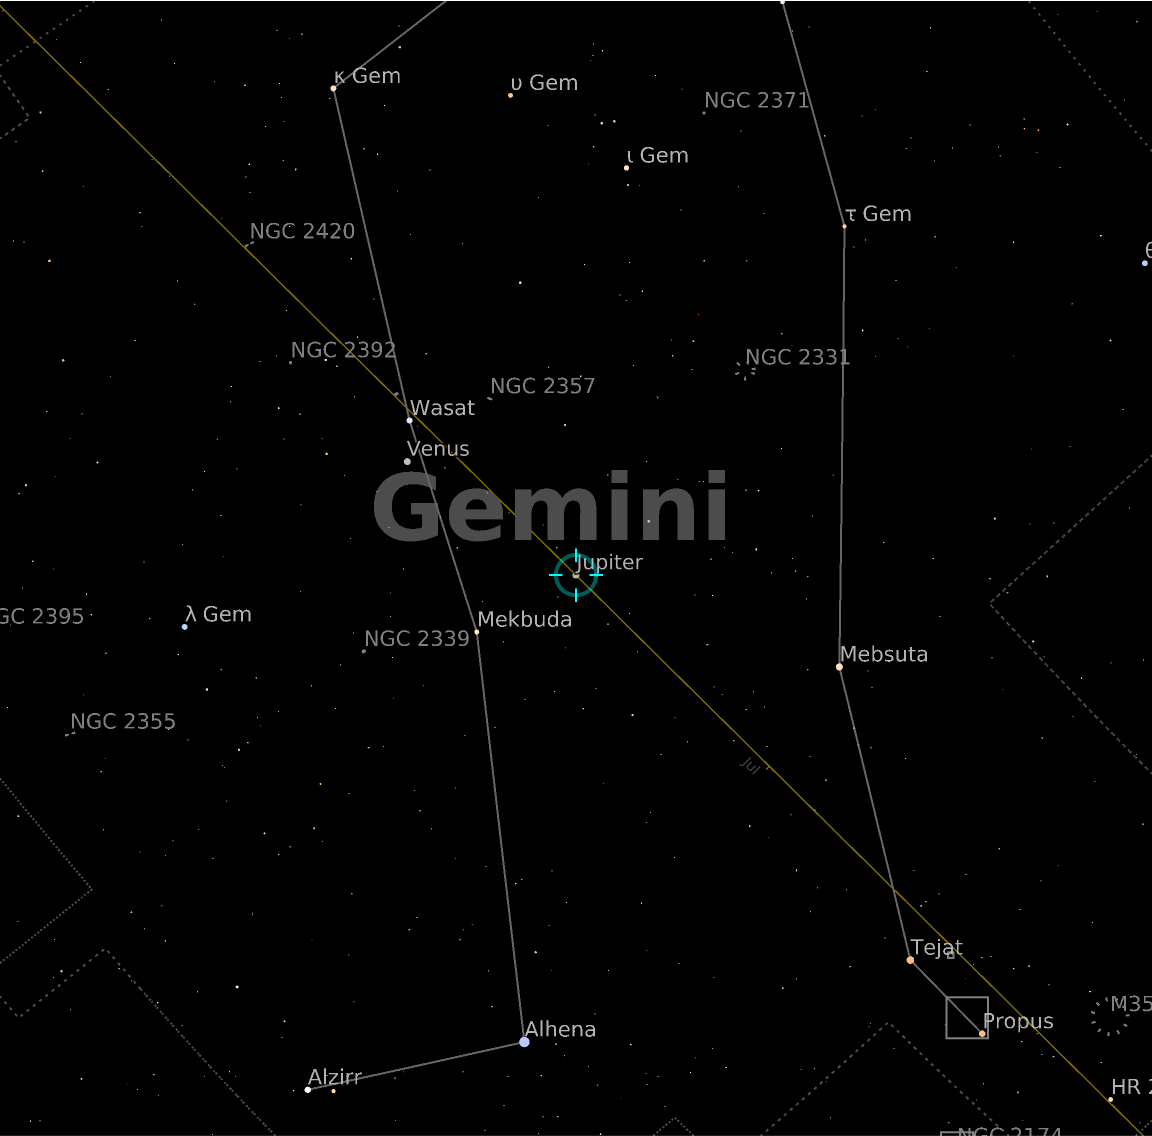
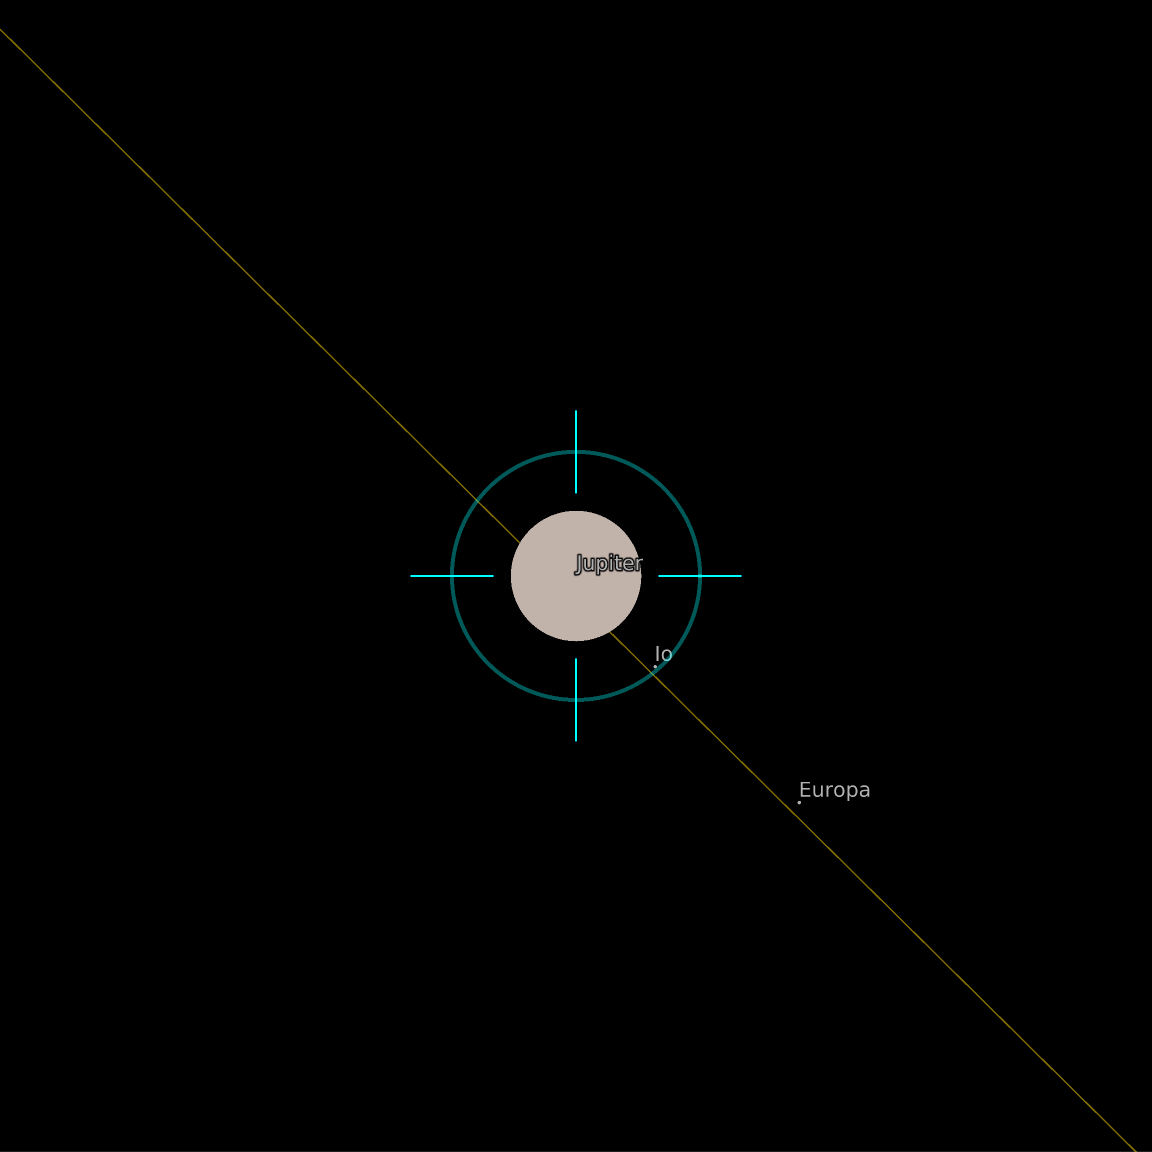
Zoom in around Jupiter until you see the positions of the Galilean satellites:
![ResourceFunction["AstroListPlot"][{Entity["Star", "Altair"]}, AstroReferenceFrame -> {"Horizon", Entity["City", {"Johannesburg", "Gauteng", "SouthAfrica"}]}, AstroRange -> All]](https://www.wolframcloud.com/obj/resourcesystem/images/6c5/6c53a1cd-86cb-4c0e-9d79-ced55bbe43c8/1-0-0/254dfdfc63aa9286.png)
![ResourceFunction["AstroListPlot"][{Entity["Star", "Mizar"]}, AstroReferenceFrame -> {"Horizon", DateObject[{2020, 8, 4, 15, 30}], GeoPosition[{40.11, -88.22}]}]](https://www.wolframcloud.com/obj/resourcesystem/images/6c5/6c53a1cd-86cb-4c0e-9d79-ced55bbe43c8/1-0-0/62e36e99119f032c.png)
![ResourceFunction["AstroListPlot", ResourceVersion->"1.0.0"][{Entity["Planet", "Venus"], Entity["Star", "Polaris"]},
AstroReferenceFrame -> {"Horizon", DateObject[{2020, 8, 4, 15, 30}],
GeoPosition[{40.11, -88.22}]}, "MarkerSize" -> Scaled[.1]]](https://www.wolframcloud.com/obj/resourcesystem/images/6c5/6c53a1cd-86cb-4c0e-9d79-ced55bbe43c8/1-0-0/16e5c9a01299e7ab.png)
![ResourceFunction["AstroListPlot"][{Entity["Star", "Deneb"]}, AstroReferenceFrame -> {"Horizon", DateObject[{2022, 10, 23, 15, 0, 0}]}, AstroBackground -> "GalacticSky", AstroRange -> All]](https://www.wolframcloud.com/obj/resourcesystem/images/6c5/6c53a1cd-86cb-4c0e-9d79-ced55bbe43c8/1-0-0/3a9b341a7fa8ac21.png)
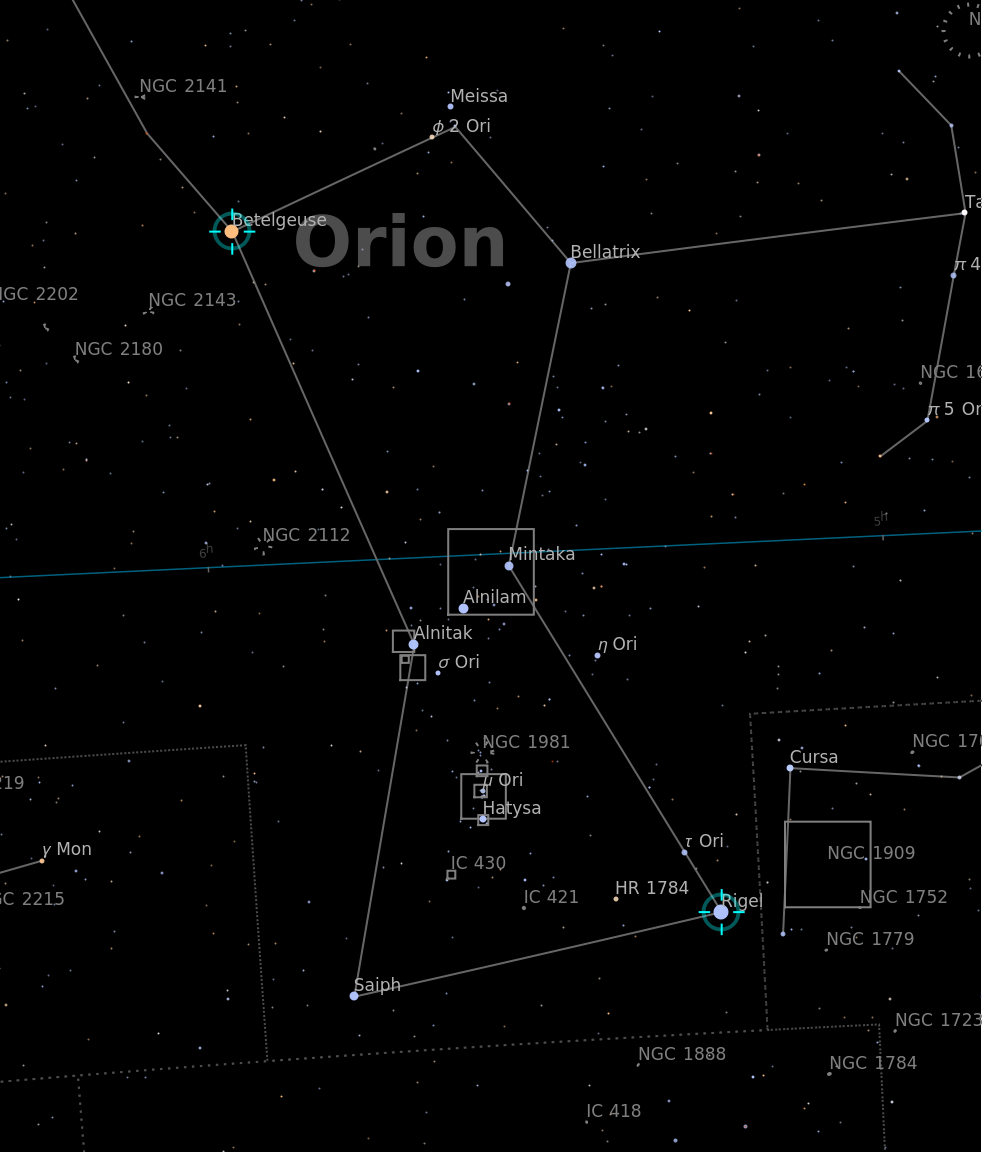
![ResourceFunction["AstroListPlot"][{Entity["Star", "Betelgeuse"]}, AstroRange -> Quantity[30, "AngularDegrees"], AstroReferenceFrame -> "Equatorial", AstroBackground -> AstroStyling[{"BlackSky", "ShowConstellationIllustrations" -> True, "ShowMainPlanes" -> False}]]](https://www.wolframcloud.com/obj/resourcesystem/images/6c5/6c53a1cd-86cb-4c0e-9d79-ced55bbe43c8/1-0-0/044d70daea92d25d.png)
![ResourceFunction["AstroListPlot", ResourceVersion->"1.0.0"][{Entity["Star", "Mizar"], Entity["Star", "Alnitak"]},
AstroReferenceFrame -> {"Horizon", GeoPosition[{40.11, -88.22}], DateObject[{2020, 8, 4, 10, 30}]}, AstroRange -> All, AstroBackground -> AstroStyling[{"BlackSky", "ShowConstellations" -> {Entity["Constellation", "Orion"], Entity["Constellation", "UrsaMajor"]}}]]](https://www.wolframcloud.com/obj/resourcesystem/images/6c5/6c53a1cd-86cb-4c0e-9d79-ced55bbe43c8/1-0-0/3bae3d51dabd7880.png)
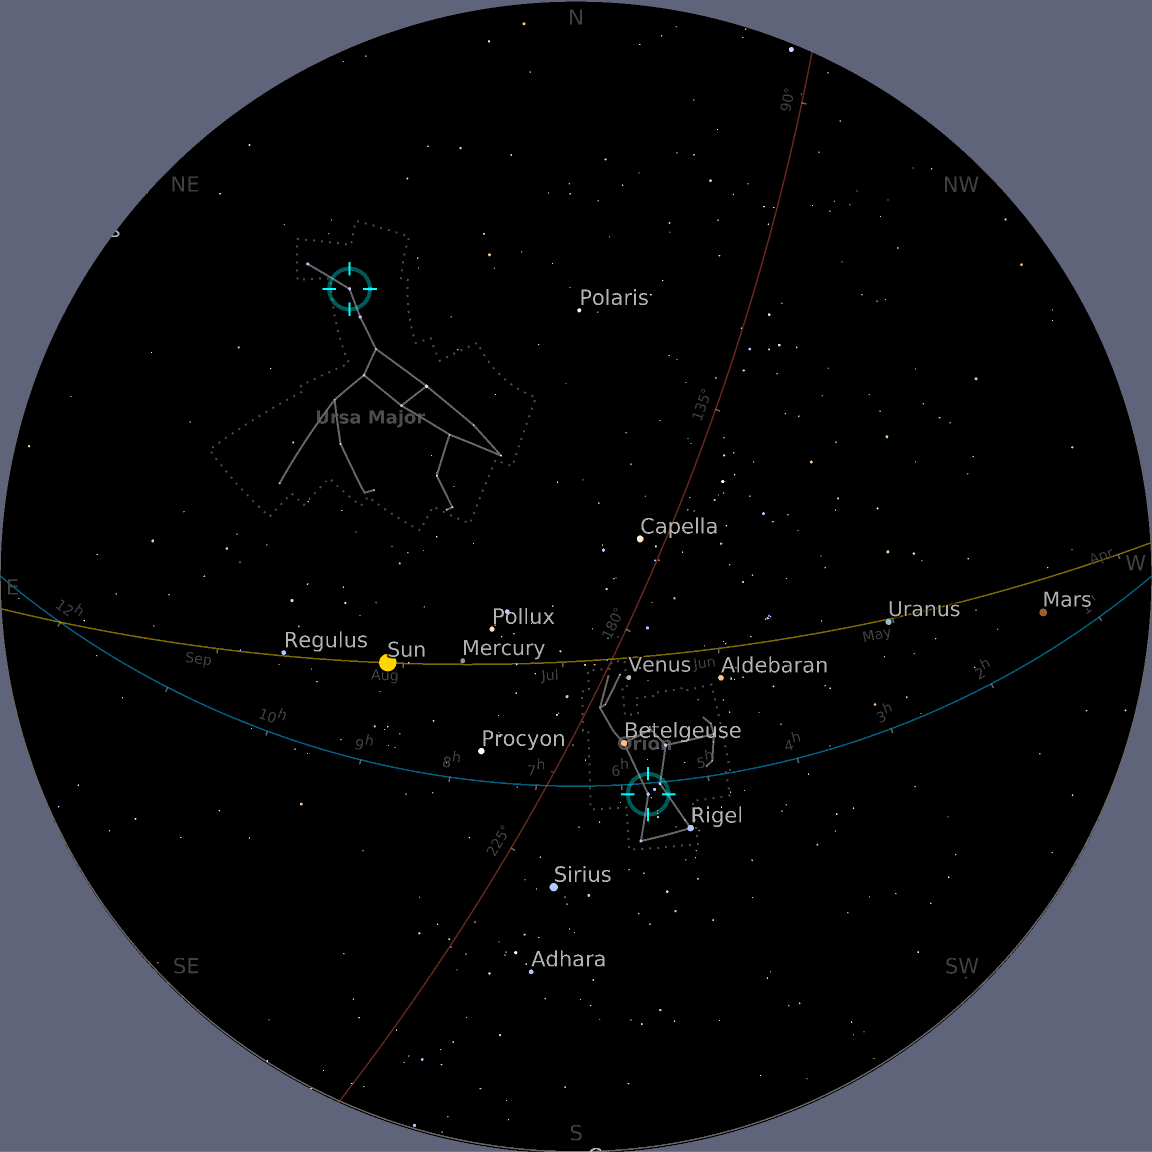
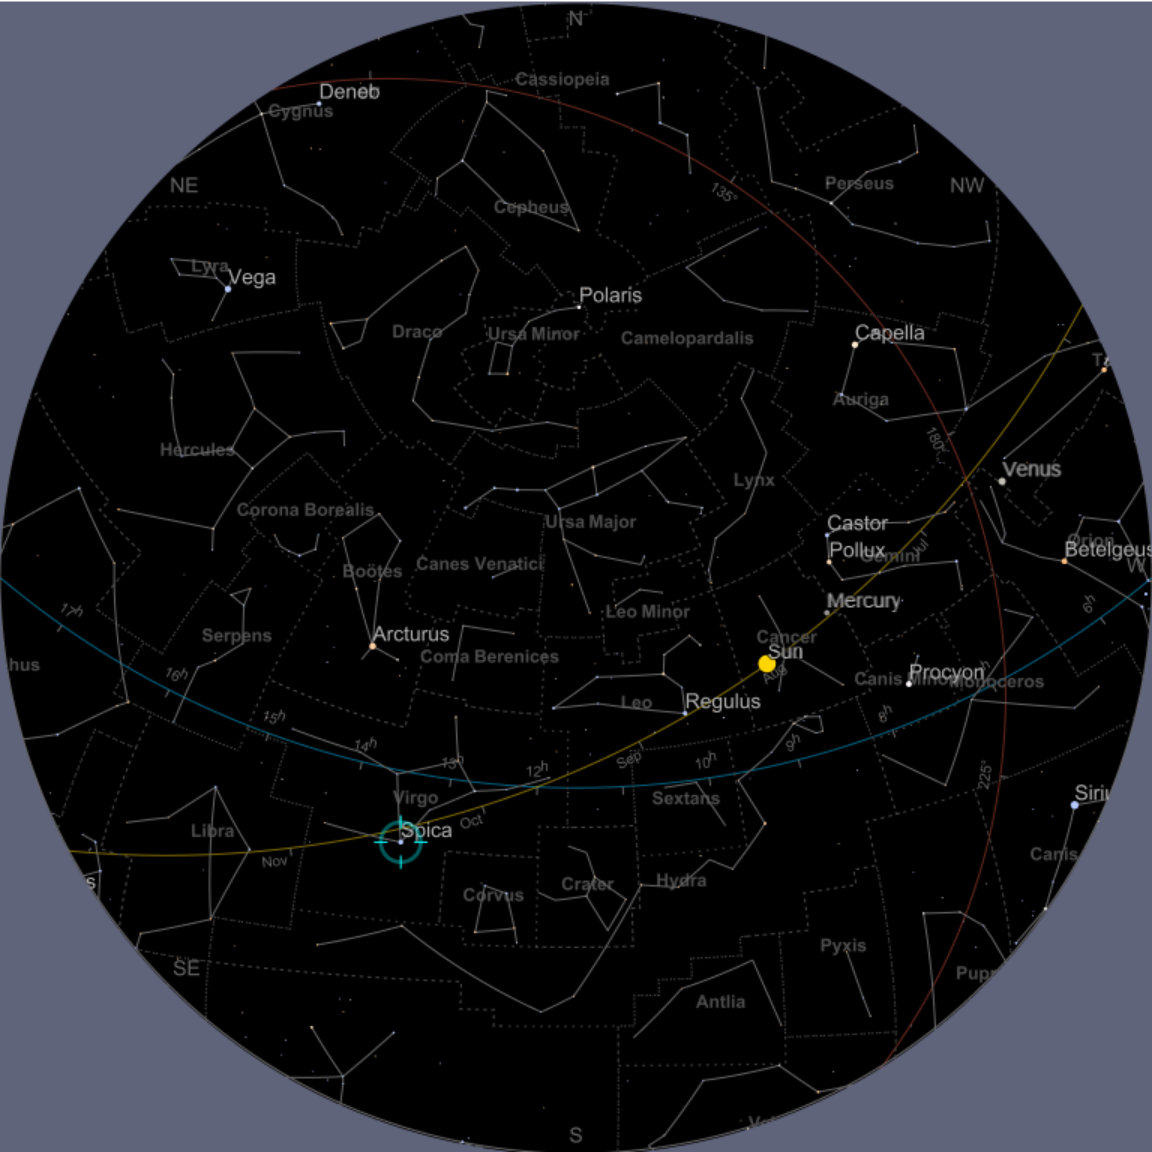
![ResourceFunction["AstroListPlot"][{Entity["Star", "Spica"]}, AstroReferenceFrame -> {"Horizon", DateObject[{2020, 8, 4, 15, 30}], GeoPosition[{40.11, -88.22}]}, AstroRange -> All, AstroBackground -> AstroStyling[{"BlackSky", "ShowConstellations" -> True}]]](https://www.wolframcloud.com/obj/resourcesystem/images/6c5/6c53a1cd-86cb-4c0e-9d79-ced55bbe43c8/1-0-0/6a8034034cc7be40.png)
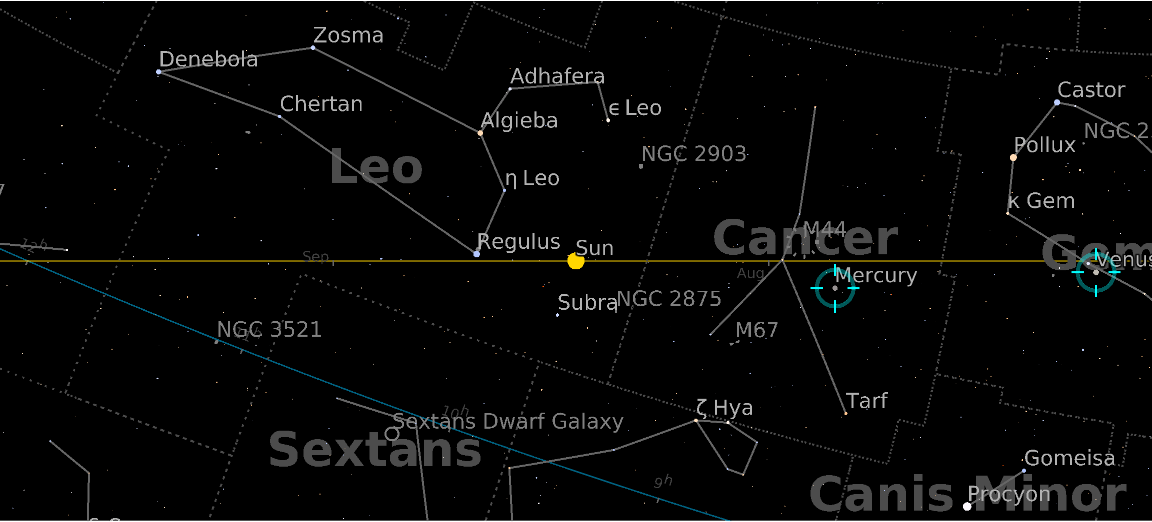
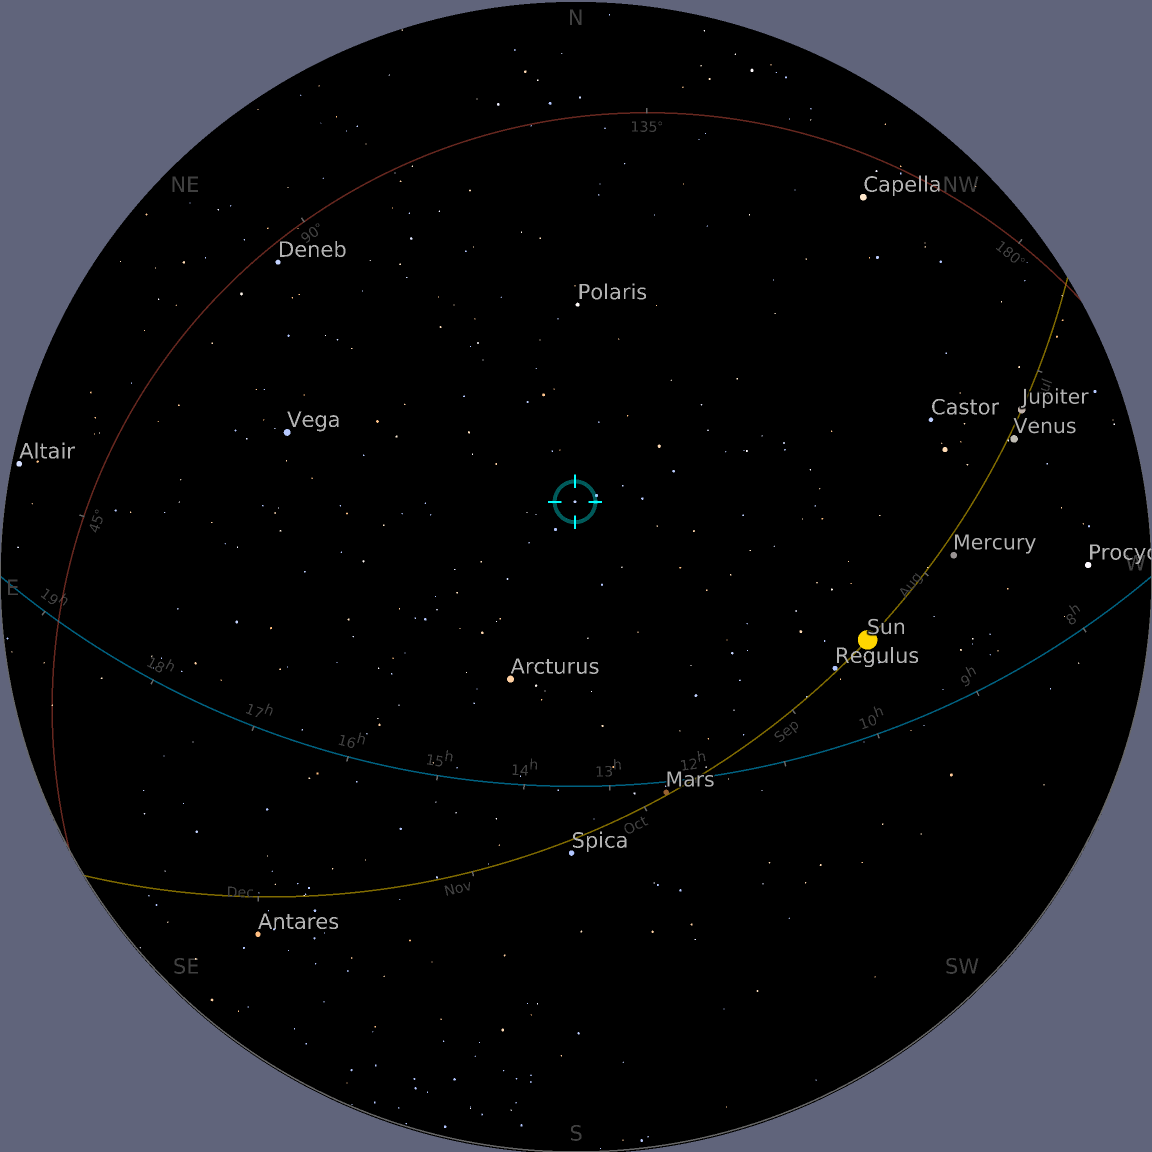
![ResourceFunction["AstroListPlot", ResourceVersion->"1.0.0"][{Entity["Planet", "Mercury"], Entity["Planet", "Venus"]}, AstroCenter -> Entity["Star", "Sun"], AstroReferenceFrame -> "Ecliptic", "MarkerSize" -> Scaled[.1]]](https://www.wolframcloud.com/obj/resourcesystem/images/6c5/6c53a1cd-86cb-4c0e-9d79-ced55bbe43c8/1-0-0/2e0bb24e734f1d1a.png)
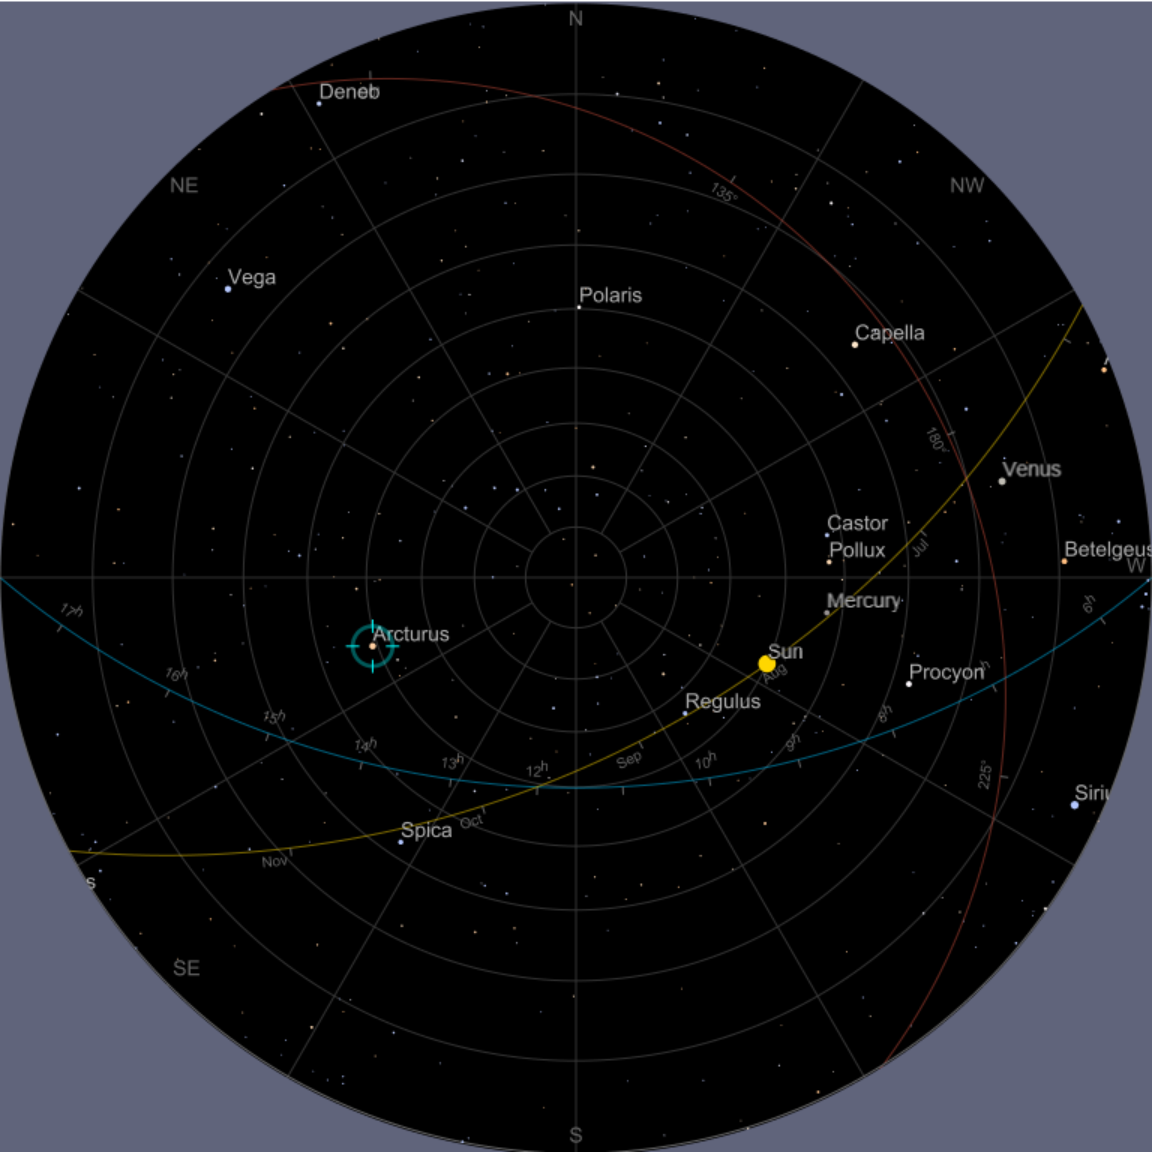
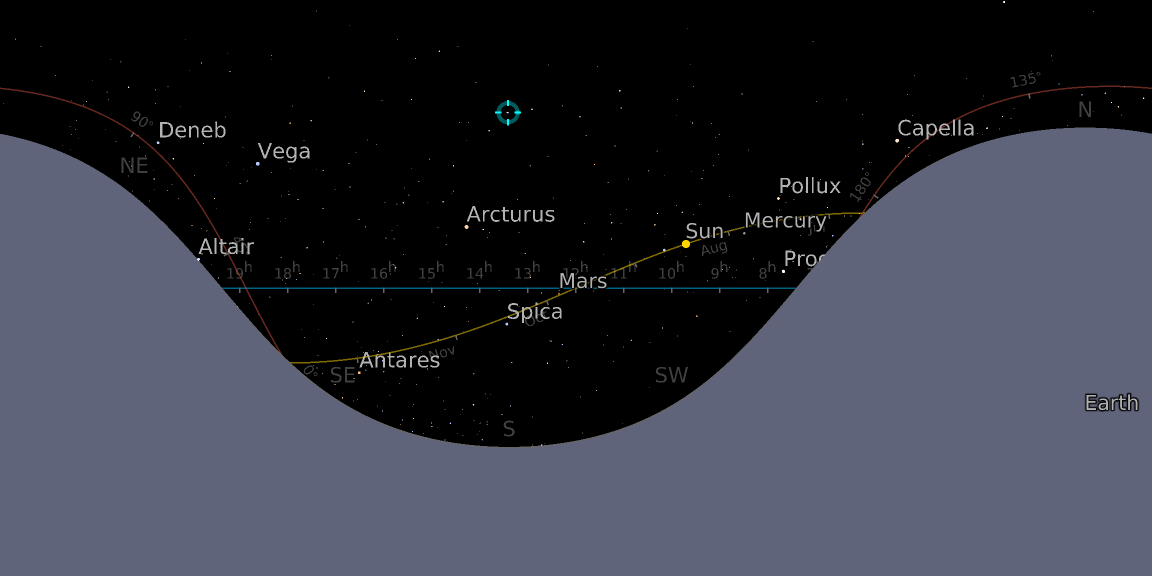
![ResourceFunction["AstroListPlot"][{Entity["Star", "Arcturus"]}, AstroReferenceFrame -> {"Horizon", DateObject[{2020, 8, 4, 15, 30}], GeoPosition[{40.11, -88.22}]}, AstroGridLines -> Automatic, AstroRange -> All]](https://www.wolframcloud.com/obj/resourcesystem/images/6c5/6c53a1cd-86cb-4c0e-9d79-ced55bbe43c8/1-0-0/1d6372d734d44fec.png)
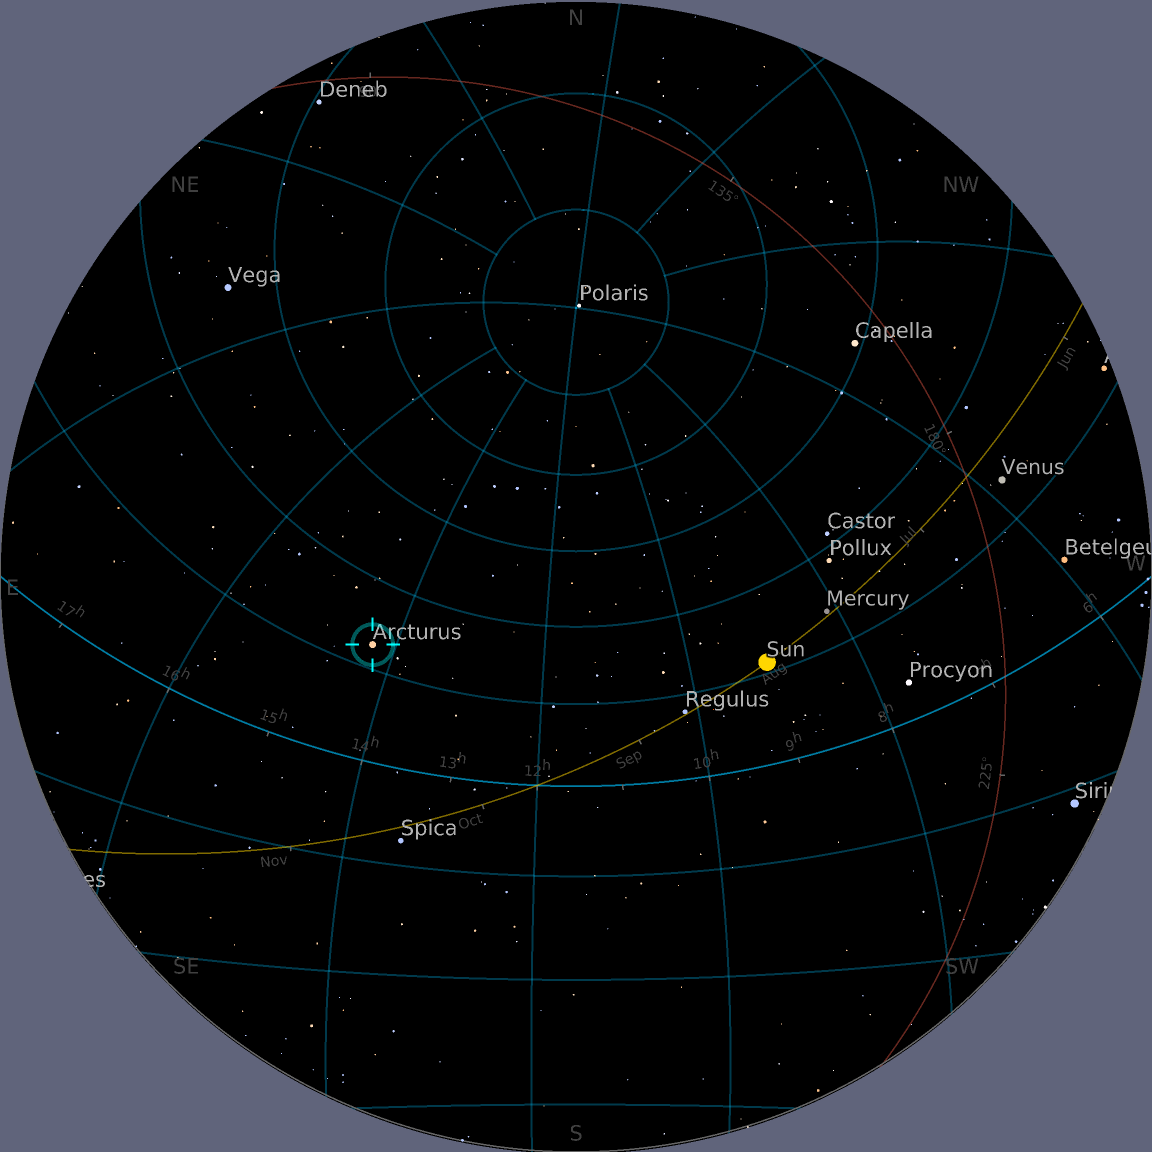
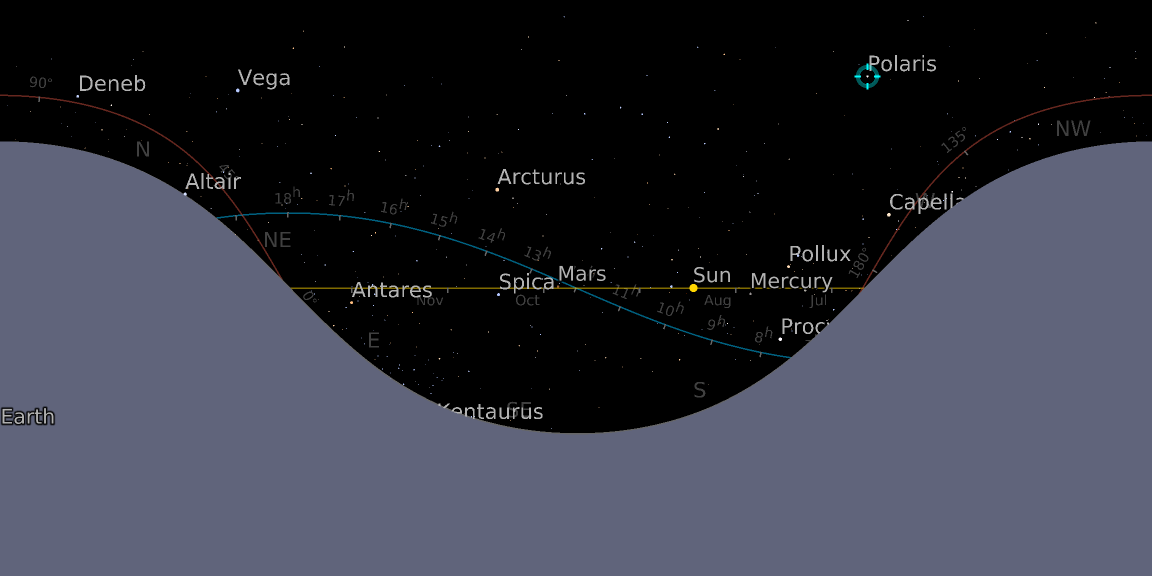
![ResourceFunction["AstroListPlot"][{Entity["Star", "Arcturus"]}, AstroReferenceFrame -> {"Horizon", DateObject[{2020, 8, 4, 15, 30}], GeoPosition[{40.11, -88.22}]}, AstroGridLines -> {"Equatorial" -> Automatic}, AstroRange -> All]](https://www.wolframcloud.com/obj/resourcesystem/images/6c5/6c53a1cd-86cb-4c0e-9d79-ced55bbe43c8/1-0-0/69652fac78c496ff.png)
![ResourceFunction["AstroListPlot"][{Entity["Star", "Capella"]}, AstroReferenceFrame -> {"Horizon", DateObject[{2025, 7, 25, 10}, TimeZone -> -5]}, AstroGridLines -> Automatic, AstroGridLinesStyle -> Directive[Dashed, Opacity[0.4, Lighter[Red]]],
AstroRange -> All]](https://www.wolframcloud.com/obj/resourcesystem/images/6c5/6c53a1cd-86cb-4c0e-9d79-ced55bbe43c8/1-0-0/700a5fc8a7a4f82b.png)
![ResourceFunction["AstroListPlot"][{Entity["Planet", "Jupiter"]}, AstroProjection -> "LambertAzimuthal", AstroRangePadding -> None, AstroReferenceFrame -> {"Equatorial", date, Here}, AstroRange -> {All, All}]](https://www.wolframcloud.com/obj/resourcesystem/images/6c5/6c53a1cd-86cb-4c0e-9d79-ced55bbe43c8/1-0-0/2d8fcc007d344d70.png)
![ResourceFunction["AstroListPlot"][{Entity["Star", "Megrez"]}, AstroProjection -> "WinkelTripel", AstroRangePadding -> None, AstroRange -> {All, All}]](https://www.wolframcloud.com/obj/resourcesystem/images/6c5/6c53a1cd-86cb-4c0e-9d79-ced55bbe43c8/1-0-0/5f2a5f9db520027c.png)
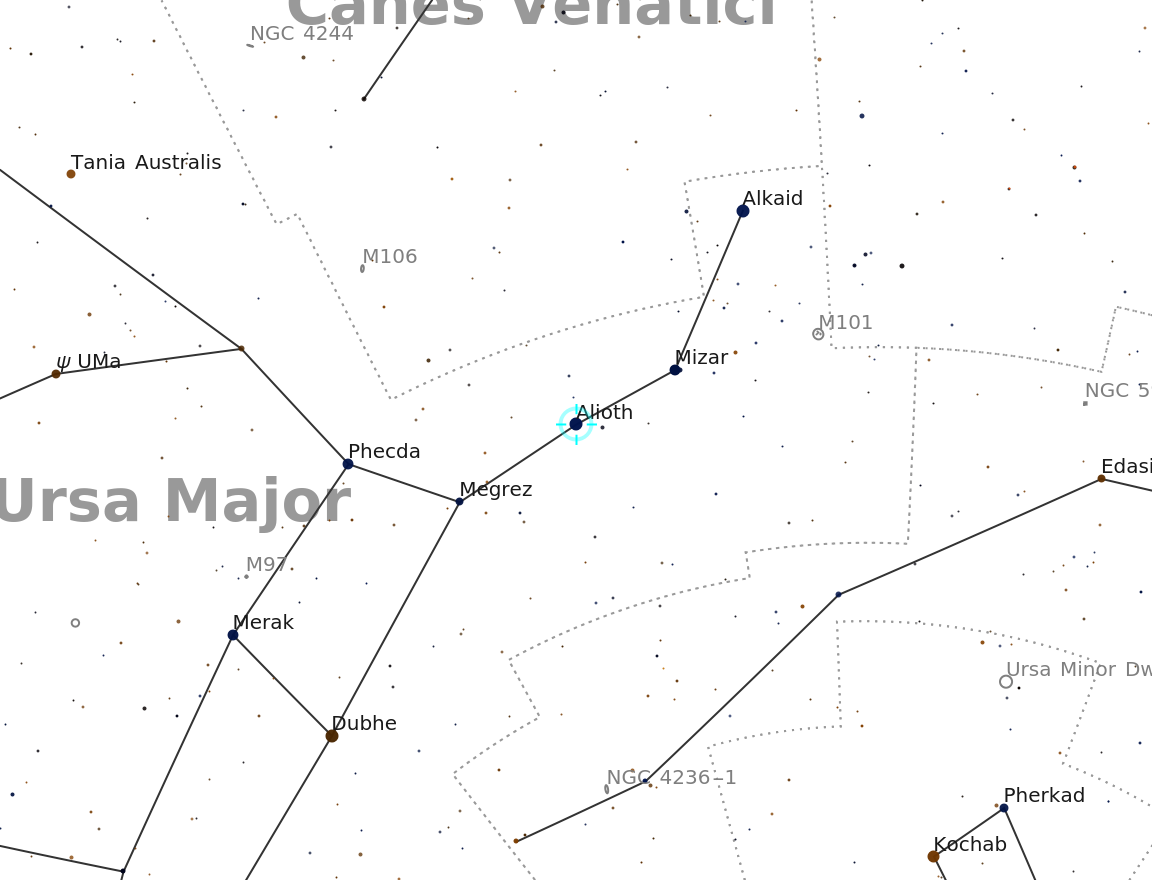
![ResourceFunction["AstroListPlot"][{Entity["Star", "Mizar"]}, AstroReferenceFrame -> {"Equatorial", Now, Here}, AstroRange -> All]](https://www.wolframcloud.com/obj/resourcesystem/images/6c5/6c53a1cd-86cb-4c0e-9d79-ced55bbe43c8/1-0-0/7011cd4e63964c60.png)
![style = {"ShowConstellationIllustrations" -> True, "ShowConstellationRegions" -> True, "ConstellationRegionStyle" -> Darker[Blue, .2], "ConstellationLineStyle" -> Opacity[0.6, LightBlue], "ShowConstellationBoundaries" -> True, "ConstellationBoundaryStyle" -> Directive[Dashing[{0, Tiny}], Yellow], "ConstellationNameStyle" -> GrayLevel[0.7], "ShowSolarSystemObjects" -> False};](https://www.wolframcloud.com/obj/resourcesystem/images/6c5/6c53a1cd-86cb-4c0e-9d79-ced55bbe43c8/1-0-0/452819e0173d86bd.png)
![ResourceFunction["AstroListPlot"][{Entity["Constellation", "Scorpius"]},
AstroBackground -> AstroStyling[{"GalacticSky", "ShowConstellations" -> {Entity["Constellation", "Scorpius"]}, style}], AstroReferenceFrame -> "J2000"]](https://www.wolframcloud.com/obj/resourcesystem/images/6c5/6c53a1cd-86cb-4c0e-9d79-ced55bbe43c8/1-0-0/7da33d8e5c6c9027.png)