Wolfram Function Repository
Instant-use add-on functions for the Wolfram Language
Function Repository Resource:
Visualize multivariate data by projecting them on a Fourier basis
ResourceFunction["AndrewsPlot"][data] plots a two-dimensional projection of data on a Fourier basis. |
| MaxItems | 50 | maximum number of example to show |
| PerformanceGoal | "Speed" | aspects of performance to try to optimize |
| PlotLegends | Automatic | legends for datasets |
Plot a random ten-dimensional dataset:
| In[1]:= |
| Out[1]= | 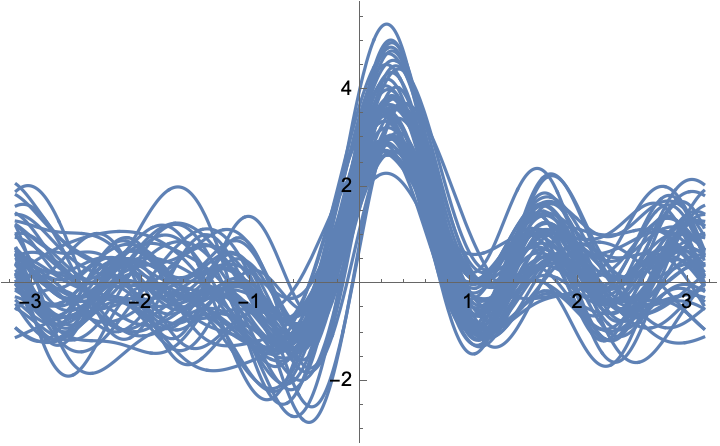 |
The number of curves and general curviness is controlled by the dataset dimensions:
| In[2]:= |
| Out[2]= | 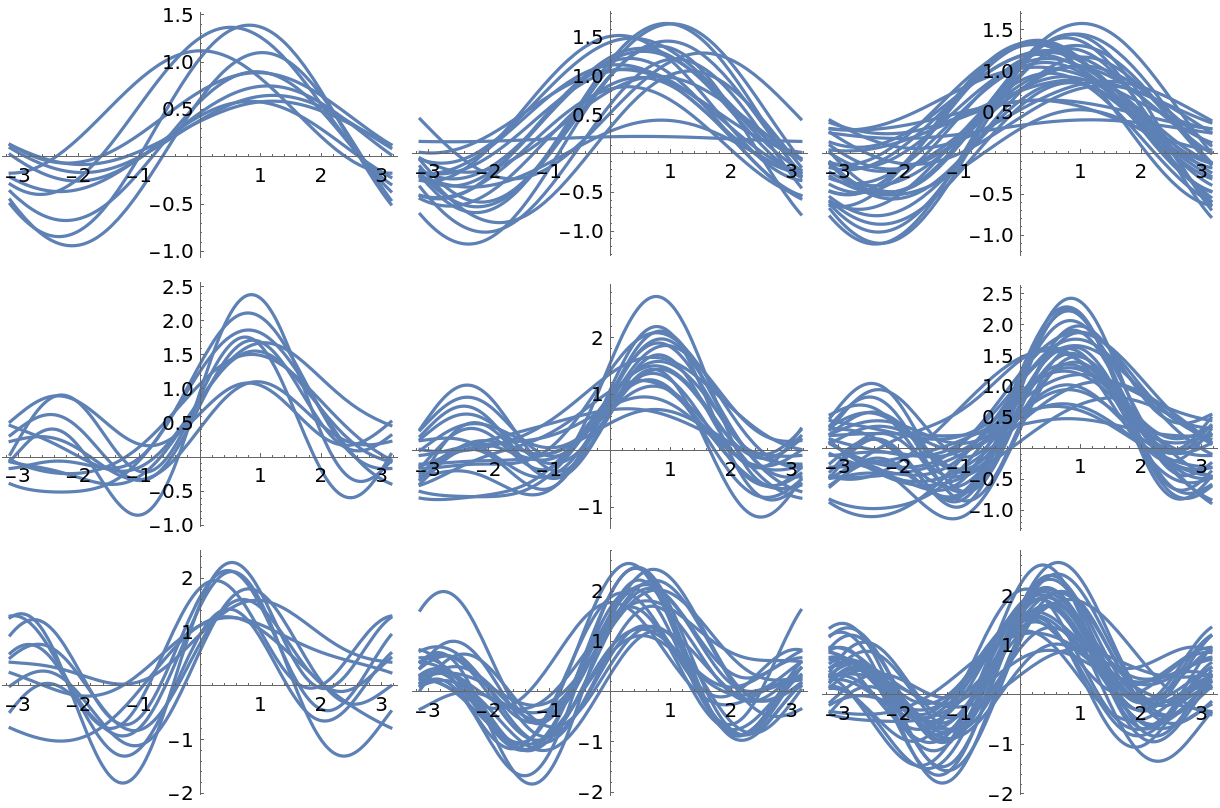 |
Plot a high-dimensional dataset:
| In[3]:= |
| Out[3]= | 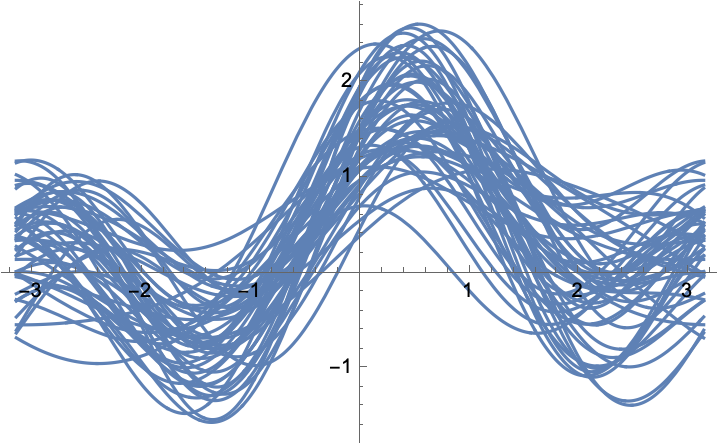 |
Plot multiple datasets:
| In[4]:= |
| Out[4]= | 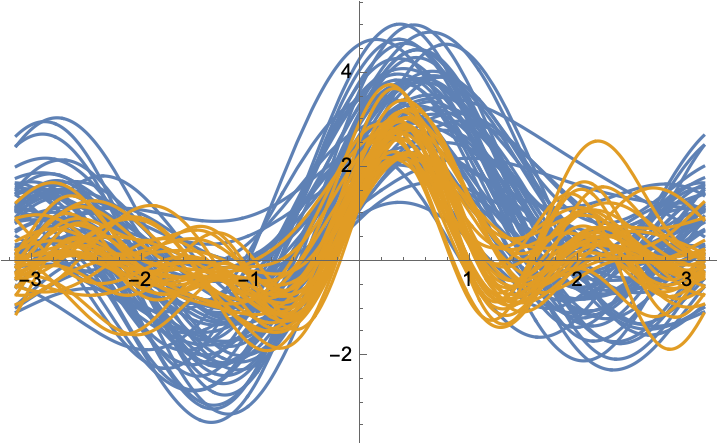 |
Specify datasets using an association:
| In[5]:= | ![ResourceFunction[
"AndrewsPlot"][<|"dataset_1" -> 2 RandomReal[1, {100, 5}], "dataset_2" -> RandomReal[1, {50, 8}]|>]](https://www.wolframcloud.com/obj/resourcesystem/images/159/15936896-8023-4b73-b834-165faa40e96f/7108134c9a5ad1d0.png) |
| Out[5]= | 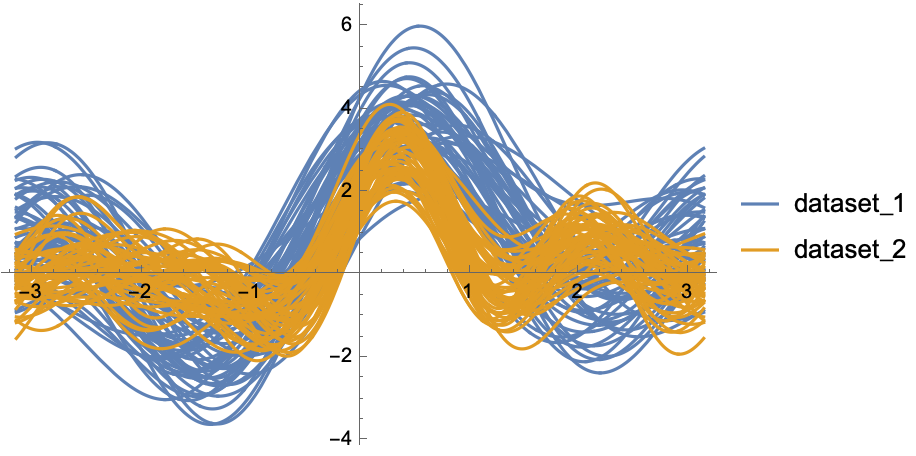 |
Visualize the famous Fisher's Irises dataset:
| In[6]:= |
| Out[6]= | 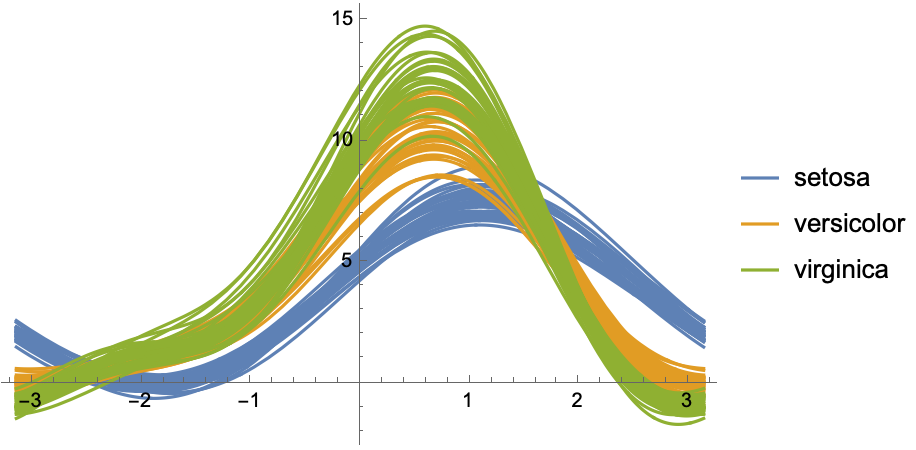 |
Visualize the features of wine bottles at three different quality score:
| In[7]:= | ![ResourceFunction["AndrewsPlot"][
KeyTake[GroupBy[
ResourceData["Sample Data: Wine Quality", "TrainingData"], Last -> First], {3., 7., 9.}]]](https://www.wolframcloud.com/obj/resourcesystem/images/159/15936896-8023-4b73-b834-165faa40e96f/7cf000307cd47230.png) |
| Out[7]= | 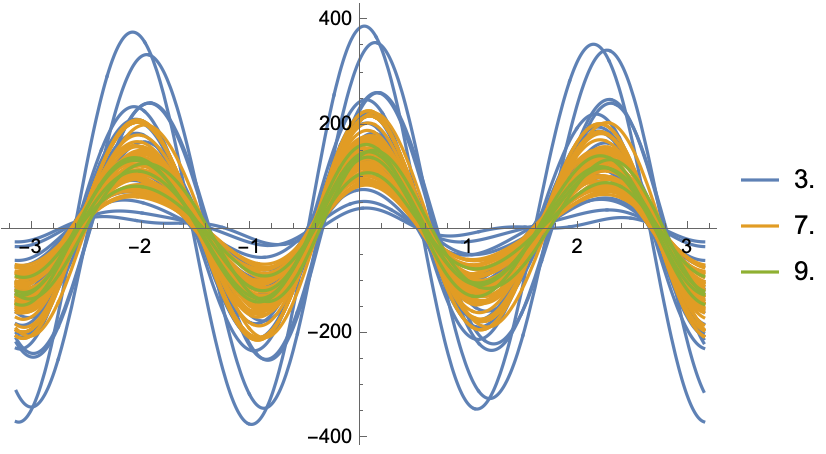 |
This work is licensed under a Creative Commons Attribution 4.0 International License