Wolfram Function Repository
Instant-use add-on functions for the Wolfram Language
Function Repository Resource:
Plot the trajectory of the azimuth and altitude of the solar position over a year
ResourceFunction["AnalemmaPlot"][location, year, time, timezone] Plots the analemma of the sun for location for the year year at time of the day for a timezone timezone. |
Plots the 2023 analemma at the Royal Observatory in Greenwich at noon:
| In[1]:= |
| Out[1]= |  |
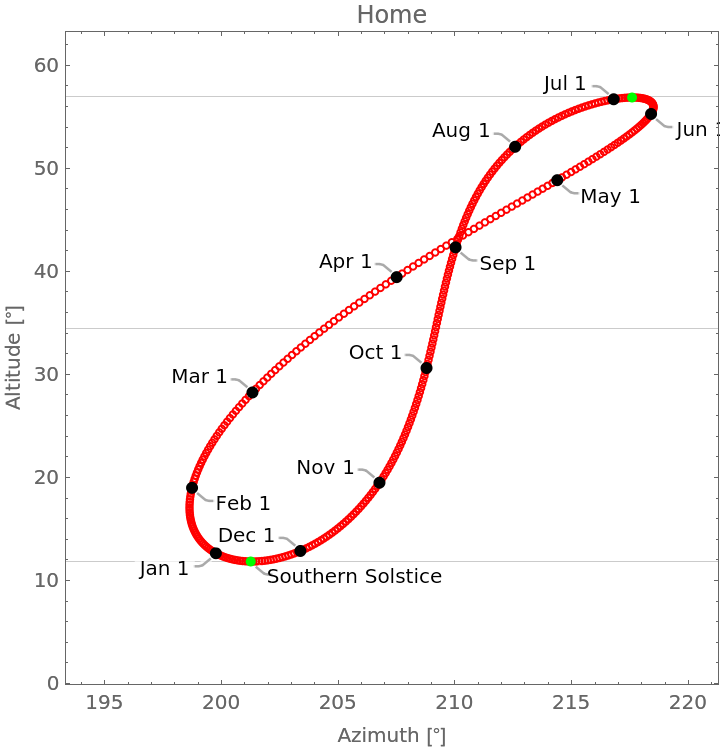
Plot the 2021 analemma curve at 14:00 in the local timezone:
| In[2]:= |
| Out[2]= |  |
Wolfram Language 13.0 (December 2021) or above
This work is licensed under a Creative Commons Attribution 4.0 International License
![ResourceFunction["AnalemmaPlot"][
Entity["City", {"Enschede", "Overijssel", "Netherlands"}], 2021, 14, Automatic, PlotStyle -> {Red, Black, Green}, AspectRatio -> 1, PlotRangePadding -> Scaled[0.1], PlotLabel -> "Home"]](https://www.wolframcloud.com/obj/resourcesystem/images/d7e/d7e1908a-3b16-4811-a9d0-9193856f73f1/7fe0a6390e055260.png)