Wolfram Function Repository
Instant-use add-on functions for the Wolfram Language
Function Repository Resource:
Measure the two-sample phase/frequency stability
ResourceFunction["AllanDeviation"][data,r,taus] calculates the two-sample deviation of data along sample times taus at rate r. |
| {{n}} | attempts to place n logarithmic spaced samples |
| d | places logarithmic spaced samplings with log base d |
| {τ1,τ2,…} | tries to use the specified sample times |
| All | uses all possible sample times |
| Automatic | tries to place a reasonable amount of samples along the whole possible time range |
Calculate the overlapping Allan deviation of white noise at a rate of 0.1 for automatically chosen sampling points:
| In[1]:= |
| Out[2]= | 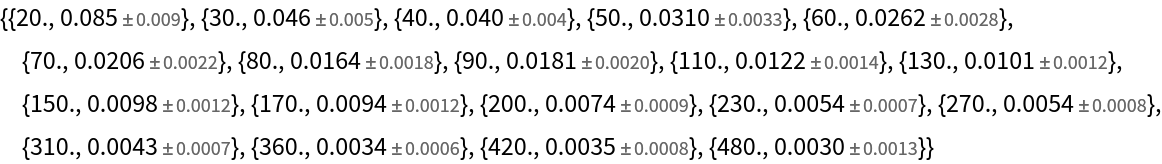 |
Plot the results:
| In[3]:= |
| Out[3]= | 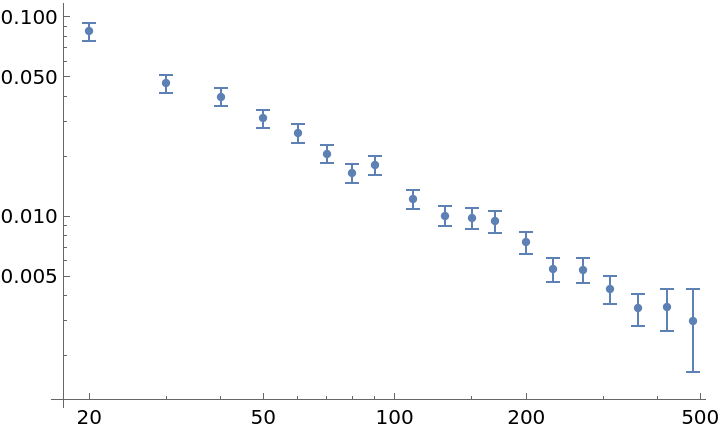 |
Display the overlapping Allan deviation of white noise at a rate of 0.1 for specified sampling points:
| In[4]:= | ![data = RandomFunction[WhiteNoiseProcess[1], {100}]["Values"];
adev = ResourceFunction["AllanDeviation"][data, 0.1, {20, 50, 100, 200, 400}];
ListLogLogPlot[adev, GridLines -> Automatic]](https://www.wolframcloud.com/obj/resourcesystem/images/e19/e195dffa-ce12-4e68-9ec8-a82c866d0edb/69fe2da4865d5c75.png) |
| Out[6]= | 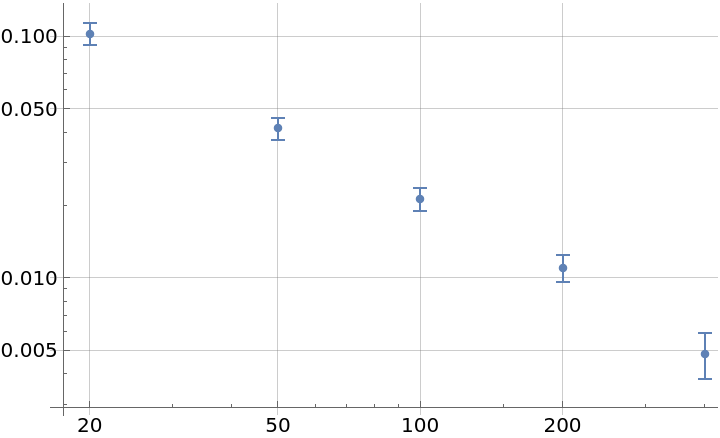 |
Sample at all possible times:
| In[7]:= | ![data = RandomFunction[WhiteNoiseProcess[1], {100}]["Values"];
adev = ResourceFunction["AllanDeviation"][data, 1, All];
ListLogLogPlot[adev]](https://www.wolframcloud.com/obj/resourcesystem/images/e19/e195dffa-ce12-4e68-9ec8-a82c866d0edb/7848ee8eb4c07e2c.png) |
| Out[9]= | 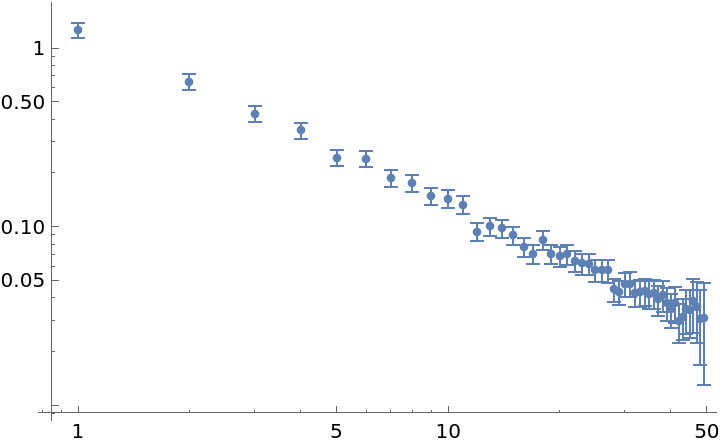 |
Try to sample at five different time values:
| In[10]:= |
| Out[11]= | 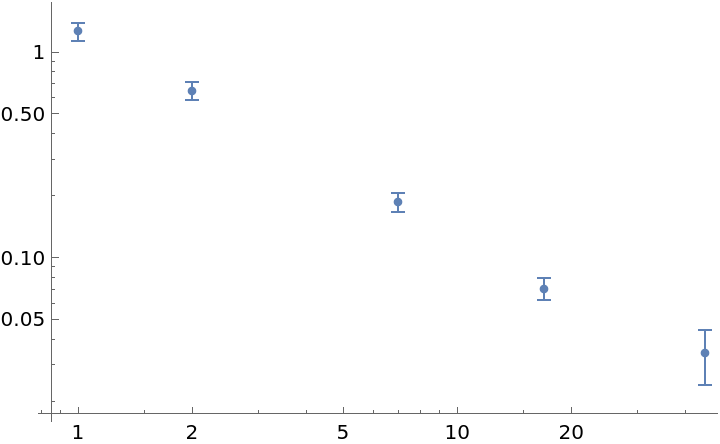 |
The function will try to use a fast evaluation method when the data array is fully real, and otherwise prints a warning:
| In[12]:= | ![data = RandomFunction[WhiteNoiseProcess[1], {100}]["Values"];
adev = ResourceFunction["AllanDeviation"][data~Join~{Pi}, 1, Automatic];
ListLogLogPlot[adev]](https://www.wolframcloud.com/obj/resourcesystem/images/e19/e195dffa-ce12-4e68-9ec8-a82c866d0edb/3b90c03afe89c848.png) |
| Out[14]= | 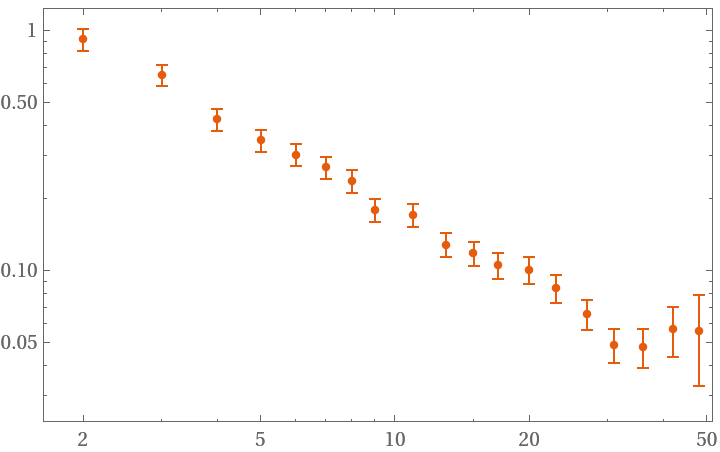 |
"FrequencyData" accepts a Boolean value. True signals the use of frequency data as opposed to phase data:
| In[15]:= | ![data = RandomFunction[WhiteNoiseProcess[1], {100}]["Values"];
adev = ResourceFunction["AllanDeviation"][data, 1, All, "FrequencyData" -> True];
ListLogLogPlot[adev]](https://www.wolframcloud.com/obj/resourcesystem/images/e19/e195dffa-ce12-4e68-9ec8-a82c866d0edb/3e113549d682188c.png) |
| Out[16]= | 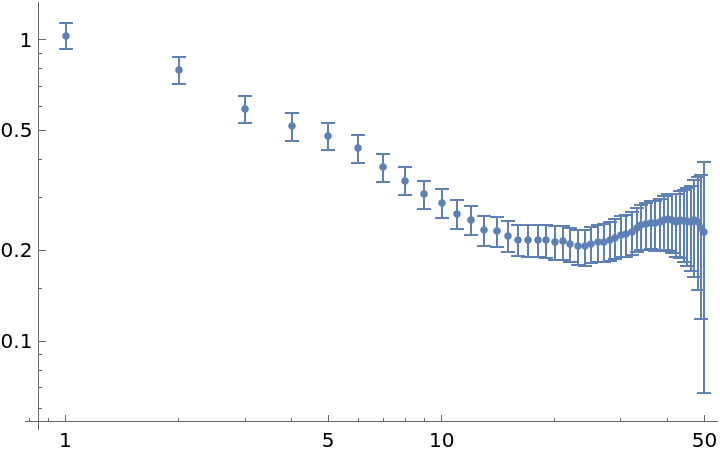 |
"Overlapping" accepts a Boolean value. False signals the use of non-overlapping strides in the deviation sampling:
| In[17]:= | ![data = RandomFunction[WhiteNoiseProcess[1], {100}]["Values"];
adev = ResourceFunction["AllanDeviation"][data, 1, All, "Overlapping" -> False];
ListLogLogPlot[adev]](https://www.wolframcloud.com/obj/resourcesystem/images/e19/e195dffa-ce12-4e68-9ec8-a82c866d0edb/187da39aaa4f61ad.png) |
| Out[18]= | 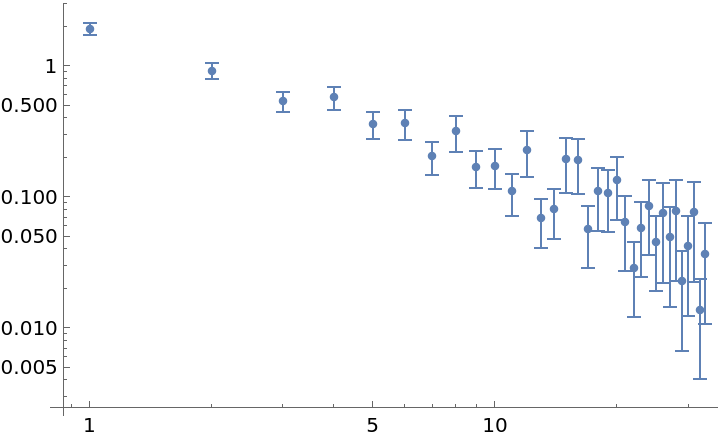 |
Distinguish a random walk from white noise by their distinct slopes:
| In[19]:= | ![datas = N[
RandomFunction[#, {10000}]["Values"]] & /@ {WhiteNoiseProcess[], RandomWalkProcess[0.5]};
adevs = ResourceFunction["AllanDeviation"][#, 1, Automatic] & /@ datas;
ListLogLogPlot[adevs]](https://www.wolframcloud.com/obj/resourcesystem/images/e19/e195dffa-ce12-4e68-9ec8-a82c866d0edb/508539f20e4c141c.png) |
| Out[20]= | 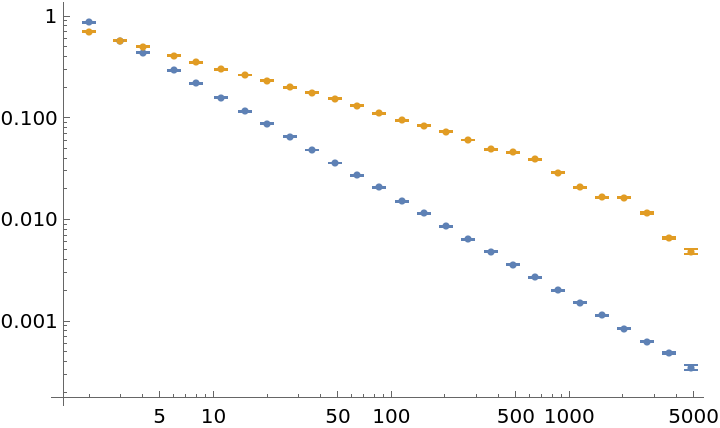 |
Detect a drift in frequency data by a rising slope in longer sample times:
| In[21]:= | ![data = RandomFunction[WhiteNoiseProcess[], {10000}]["Values"] + Accumulate[ConstantArray[10^-4, 10001]];
adev = ResourceFunction["AllanDeviation"][data, 1.0, Automatic, "FrequencyData" -> True];
ListLogLogPlot[adev]](https://www.wolframcloud.com/obj/resourcesystem/images/e19/e195dffa-ce12-4e68-9ec8-a82c866d0edb/6e4b40514e430051.png) |
| Out[22]= | 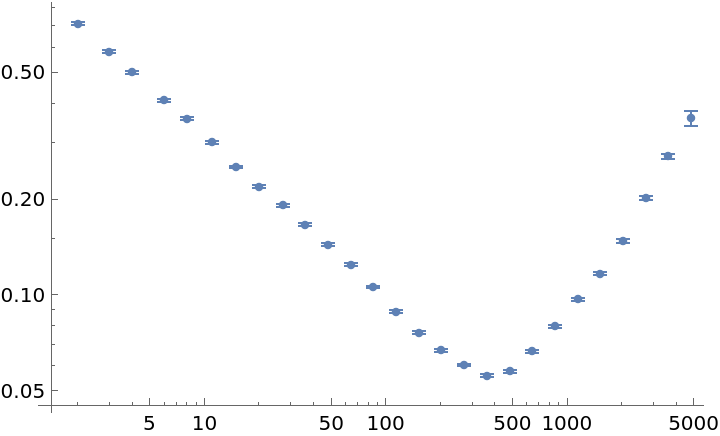 |
Using the fast algorithm for numeric data is approximately two times faster:
| In[23]:= |
| Out[24]= |
| In[25]:= |
| Out[25]= |
The function can process Around objects as well as exact inputs directly:
| In[26]:= | ![data = Table[
Around[RandomVariate[NormalDistribution[0, 2]], 2], {i, 1, 1000}];
adev = ResourceFunction["AllanDeviation"][data, 1, Automatic];
ListLogLogPlot[adev]](https://www.wolframcloud.com/obj/resourcesystem/images/e19/e195dffa-ce12-4e68-9ec8-a82c866d0edb/34ce7c62a909ffe0.png) |
| Out[27]= | 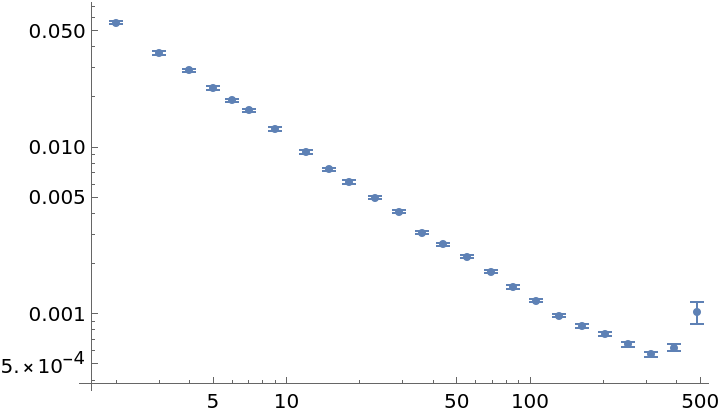 |
Requesting a certain number of samples will not necessarily result in this number of deviations:
| In[28]:= |
| Out[29]= |
This work is licensed under a Creative Commons Attribution 4.0 International License