Wolfram Function Repository
Instant-use add-on functions for the Wolfram Language
Function Repository Resource:
Compute the Wiener index of a graph
ResourceFunction["WienerIndex"][g] computes the Wiener index of the graph g. |
The Wiener index of a simple graph:
| In[1]:= | ![ResourceFunction["WienerIndex"][\!\(\*
GraphicsBox[
NamespaceBox["NetworkGraphics",
DynamicModuleBox[{Typeset`graph = HoldComplete[
Graph[{1, 2, 3, 4}, {Null, {{1, 2}, {1, 3}, {1, 4}}}, {GraphLayout -> "StarEmbedding"}]]},
TagBox[GraphicsGroupBox[
GraphicsComplexBox[{{0., 0.}, {
0.8660254037844389, -0.5000000000000012}, {
1.8369701987210297`*^-16, 1.}, {-0.8660254037844386, -0.49999999999999917`}}, {
{Hue[0.6, 0.7, 0.5], Opacity[0.7], Arrowheads[0.], ArrowBox[{{1, 2}, {1, 3}, {1, 4}}, 0.020399597244776413`]},
{Hue[0.6, 0.2, 0.8], EdgeForm[{GrayLevel[0], Opacity[0.7]}], DiskBox[1, 0.020399597244776413], DiskBox[2, 0.020399597244776413], DiskBox[3, 0.020399597244776413], DiskBox[4, 0.020399597244776413]}}]],
MouseAppearanceTag["NetworkGraphics"]],
AllowKernelInitialization->False]],
DefaultBaseStyle->"NetworkGraphics",
FormatType->TraditionalForm,
FrameTicks->None]\)]](https://www.wolframcloud.com/obj/resourcesystem/images/9ba/9ba8469e-bb44-4328-b404-e0a9944b880a/75e2160547e10ec3.png) |
| Out[1]= |
More densely connected graphs have lower WienerIndex values:
| In[2]:= | ![ResourceFunction["WienerIndex"][\!\(\*
GraphicsBox[
NamespaceBox["NetworkGraphics",
DynamicModuleBox[{Typeset`graph = HoldComplete[
Graph[{1, 2, 3, 4}, {Null,
SparseArray[
Automatic, {4, 4}, 0, {1, {{0, 3, 6, 9, 12}, {{2}, {3}, {4}, {1}, {3}, {4}, {
1}, {2}, {4}, {1}, {2}, {3}}}, Pattern}]}, {GraphLayout -> "StarEmbedding"}]]},
TagBox[GraphicsGroupBox[
GraphicsComplexBox[{{0., 0.}, {
0.8660254037844389, -0.5000000000000012}, {
1.8369701987210297`*^-16, 1.}, {-0.8660254037844386, -0.49999999999999917`}}, {
{Hue[0.6, 0.7, 0.5], Opacity[0.7], Arrowheads[0.], ArrowBox[{{1, 2}, {1, 3}, {1, 4}, {2, 3}, {2, 4}, {3, 4}}, 0.020399597244776413`]},
{Hue[0.6, 0.2, 0.8], EdgeForm[{GrayLevel[0], Opacity[0.7]}], DiskBox[1, 0.020399597244776413], DiskBox[2, 0.020399597244776413], DiskBox[3, 0.020399597244776413], DiskBox[4, 0.020399597244776413]}}]],
MouseAppearanceTag["NetworkGraphics"]],
AllowKernelInitialization->False]],
DefaultBaseStyle->"NetworkGraphics",
FormatType->TraditionalForm,
FrameTicks->None]\)]](https://www.wolframcloud.com/obj/resourcesystem/images/9ba/9ba8469e-bb44-4328-b404-e0a9944b880a/504c79f4df17ae53.png) |
| Out[2]= |
| In[3]:= |
| Out[3]= |
By default, the WienerIndex of a molecule is the WienerIndex of the hydrogen-depleted molecule graph. That is, the molecule graph with all hydrogen atoms removed:
| In[4]:= | ![ResourceFunction["WienerIndex"][
Molecule[{"C", "C", "C", "C", "H", "H", "H", "H", "H", "H", "H", "H", "H", "H"}, {
Bond[{1, 2}, "Single"],
Bond[{1, 3}, "Single"],
Bond[{1, 4}, "Single"],
Bond[{1, 5}, "Single"],
Bond[{2, 6}, "Single"],
Bond[{2, 7}, "Single"],
Bond[{2, 8}, "Single"],
Bond[{3, 9}, "Single"],
Bond[{3, 10}, "Single"],
Bond[{3, 11}, "Single"],
Bond[{4, 12}, "Single"],
Bond[{4, 13}, "Single"],
Bond[{4, 14}, "Single"]}, {AtomCoordinates -> QuantityArray[
StructuredArray`StructuredData[{14, 3}, {CompressedData["
1:eJxTTMoPSmViYGDgA2JmBkwQ/kZ/tzr/9f1bT5Ttmy/1cP/azHuFXX1f7U8+
tV9yf98++9yj/zZVf/pmv/ZXDJB5aj9MXP1Q2/LwU2/2nwRp0/8EF0c3v4/t
g5hHwPf9H5PPxHqfeLi/TtYi3SXzm/3UK5wZSjmf7Ws+bQjInrXd/qtXZJtF
GKMDhH9+v0fAH4ni6z/2v2IxETSz+WEPE3dMeHpB6fZ3++cg6/jO7GdvnOrc
DTRnP98c40VbGBwg7npk/7kvuERl+vn9F11ufPji9dd+8sqmQM+5n/bDzCnd
Kvr79Lu3+z85nk+7+vzTfph7OsEWPNxvDmYwHICp/xn8eOnsI//2PwPb+wFu
DgBbdbEe
"], "Angstroms", {{1}, {2}}}]], AtomDiagramCoordinates -> {{2.865999937057495, 0.25}, {
3.7320001125335693`, 0.75}, {2., 0.75}, {
2.865999937057495, -0.75}, {2.865999937057495, 0.8700000047683716}, {4.041999816894531, 0.21310000121593475`}, {
4.269000053405762, 1.059999942779541}, {3.421999931335449, 1.2869000434875488`}, {2.309999942779541, 1.2869000434875488`}, {
1.4630999565124512`, 1.059999942779541}, {1.690000057220459, 0.21310000121593475`}, {2.246000051498413, -0.75}, {
2.865999937057495, -1.3700000047683716`}, {
3.4860000610351562`, -0.75}}}]]](https://www.wolframcloud.com/obj/resourcesystem/images/9ba/9ba8469e-bb44-4328-b404-e0a9944b880a/66e91dcde318f122.png) |
| Out[4]= |
A different isomer with the same atoms can have a different WienerIndex:
| In[5]:= | ![ResourceFunction["WienerIndex"][
Molecule[{"C", "C", "C", "C", "H", "H", "H", "H", "H", "H", "H", "H", "H", "H"}, {
Bond[{1, 2}, "Single"],
Bond[{1, 3}, "Single"],
Bond[{1, 5}, "Single"],
Bond[{1, 6}, "Single"],
Bond[{2, 4}, "Single"],
Bond[{2, 7}, "Single"],
Bond[{2, 8}, "Single"],
Bond[{3, 9}, "Single"],
Bond[{3, 10}, "Single"],
Bond[{3, 11}, "Single"],
Bond[{4, 12}, "Single"],
Bond[{4, 13}, "Single"],
Bond[{4, 14}, "Single"]}, {AtomCoordinates -> QuantityArray[
StructuredArray`StructuredData[{14, 3}, {CompressedData["
1:eJwBYQGe/iFib1JlAgAAAA4AAAADAAAAyXGndLD+2D9VNNb+zvbRv29JDtjV
5OK/yqFFtvP92L8hsd09QPfRP+Z4BaIn5eI/dqvnpPcN/D/jj6LO3EPZP/yP
TIdOT+W/dqvnpPcN/L9INlfNc0TZvzsZHCWvTuU/9DP1ukXg4D/VYBqGjwj2
v7cr9MEyNt2/BRTq6SPwxb8kjFU5o5y2vzZeukkMgvi/DECjdOnf4L8prir7
rgj2P9JyoIfaNt0/dbUV+8vuxT+NzMjFvZ62P8SZX80Bgvg/gJpattaXAkDa
l8f1SrSPv5+rrdhfdvi/PtAKDFnd+T/qymd5Htz3P8nJxK2CmOm/hEcbR6yF
AkC/vtalRujJPwg8MIDwodE/gJpattaXAsAuyzIfa6GPPxKI1/ULdvg/BOJ1
/YLd+b+WfVcE/9v3v7hYUYNpmOk/TOXtCKeFAsBy/5Hp0OnJv/oq+dhdoNG/
KH7CaA==
"], "Angstroms", {{1}, {2}}}]], AtomDiagramCoordinates -> {{2.865999937057495, -0.25}, {
3.732100009918213, 0.25}, {2., 0.25}, {
4.598100185394287, -0.25}, {
2.4674999713897705`, -0.7249000072479248}, {
3.2646000385284424`, -0.7249000072479248}, {4.1305999755859375`, 0.7249000072479248}, {3.3334999084472656`, 0.7249000072479248}, {
2.309999942779541, 0.786899983882904}, {1.4630999565124512`, 0.5600000023841858}, {1.690000057220459, -0.28690001368522644`}, {
4.288099765777588, -0.786899983882904}, {
5.135000228881836, -0.5600000023841858}, {4.908100128173828, 0.28690001368522644`}}}]]](https://www.wolframcloud.com/obj/resourcesystem/images/9ba/9ba8469e-bb44-4328-b404-e0a9944b880a/562373d5ec84885a.png) |
| Out[5]= |
WienerIndex can accept "Graph" or "Chemical" entities:
| In[6]:= |
| Out[6]= |
| In[7]:= |
| Out[7]= |
WienerIndex of a molecule ignores hydrogen atoms:
| In[8]:= |
| Out[8]= |
The option IncludeHydrogens→ All will have them taken into account:
| In[9]:= |
| Out[9]= |
Create OEIS sequence A292054 - the Wiener index of n×n knight's tour graphs:
| In[10]:= |
| Out[10]= |
Create OEIS sequence A034828 - the Wiener index of n-cycle graphs:
| In[11]:= |
| Out[11]= |
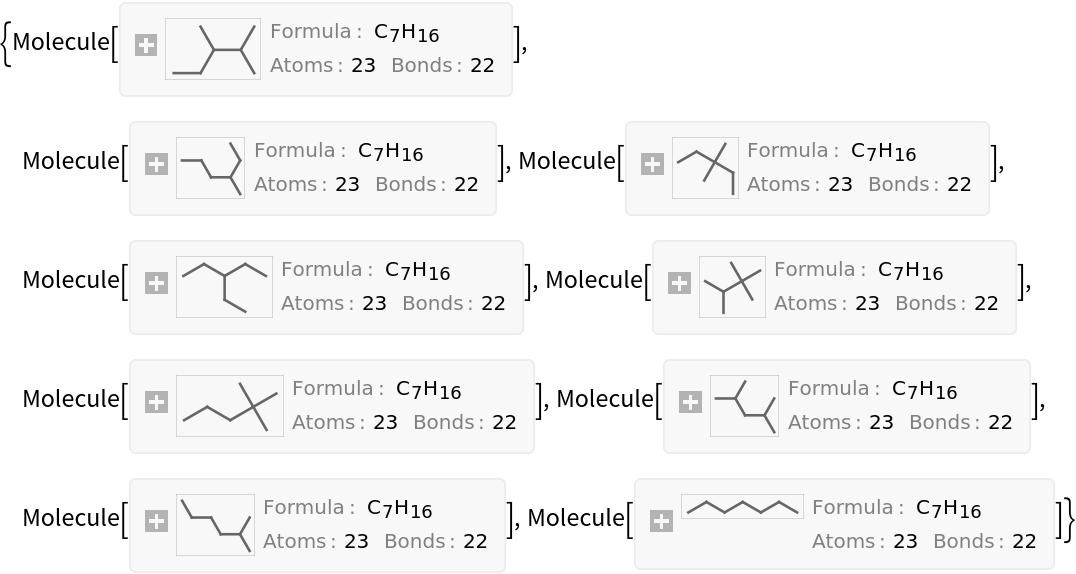
Generate all alkanes with 7 carbon atoms (heptanes) using the resource function AlkaneIsomers:
| In[12]:= |
| Out[12]= |  |
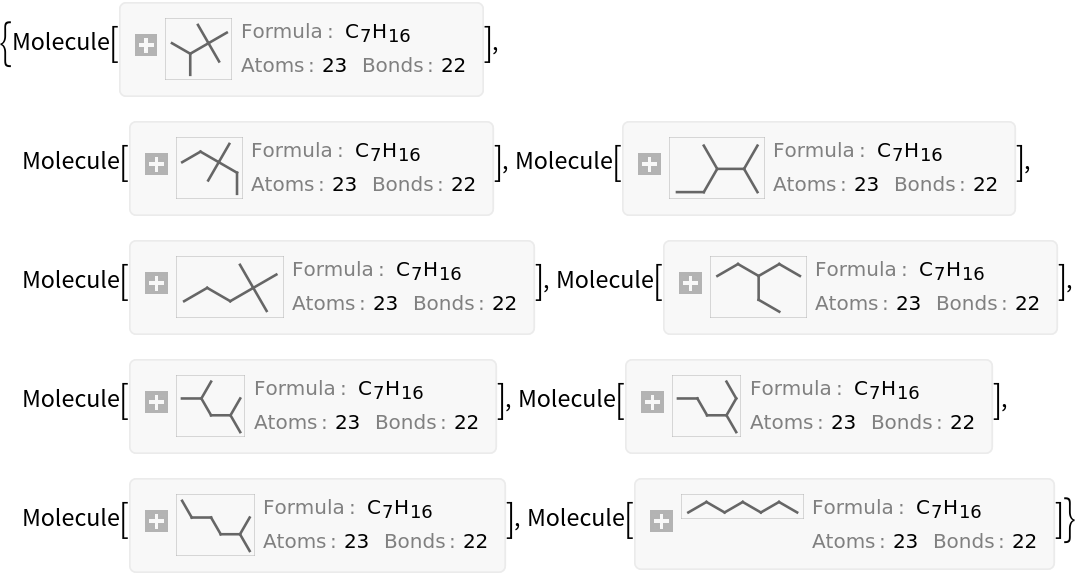
Sort the heptane isomers by their Wiener index. This effectively sorts them from "most branched" to "least branched":
| In[13]:= |
| Out[13]= |  |
For an acyclic graph the Wiener index is the same as the Szeged index:
| In[14]:= | ![ResourceFunction["WienerIndex"][ \!\(\*
GraphicsBox[
NamespaceBox["NetworkGraphics",
DynamicModuleBox[{Typeset`graph = HoldComplete[
Graph[{1, 2, 3, 4, 5, 6, 7, 8, 9, 10}, {Null, {{3, 4}, {5, 6}, {5, 3}, {7, 8}, {7, 1}, {7, 2}, {
7, 3}, {9, 10}, {9, 2}}}]]},
TagBox[GraphicsGroupBox[
GraphicsComplexBox[{{0., 1.466033332275663}, {
0.7330166661378313, 1.466033332275663}, {1.8325416653445783`,
1.466033332275663}, {1.4660333322756627`, 0.7330166661378315}, {2.199049998413494, 0.7330166661378315}, {2.199049998413494, 0.}, {
1.2827791657412049`, 2.199049998413494}, {
2.5655583314824097`, 1.466033332275663}, {0.7330166661378313,
0.7330166661378315}, {0.7330166661378313, 0.}}, {
{Hue[0.6, 0.7, 0.5], Opacity[0.7], Arrowheads[0.], ArrowBox[{{1, 7}, {2, 7}, {2, 9}, {3, 4}, {3, 5}, {3, 7}, {
5, 6}, {7, 8}, {9, 10}}, 0.027040802458717428`]},
{Hue[0.6, 0.2, 0.8], EdgeForm[{GrayLevel[0], Opacity[0.7]}], DiskBox[1, 0.027040802458717428], DiskBox[2, 0.027040802458717428], DiskBox[3, 0.027040802458717428], DiskBox[4, 0.027040802458717428], DiskBox[5, 0.027040802458717428], DiskBox[6, 0.027040802458717428], DiskBox[7, 0.027040802458717428], DiskBox[8, 0.027040802458717428], DiskBox[9, 0.027040802458717428], DiskBox[10, 0.027040802458717428]}}]],
MouseAppearanceTag["NetworkGraphics"]],
AllowKernelInitialization->False]],
DefaultBaseStyle->"NetworkGraphics",
FormatType->TraditionalForm,
FrameTicks->None]\)]](https://www.wolframcloud.com/obj/resourcesystem/images/9ba/9ba8469e-bb44-4328-b404-e0a9944b880a/3df6d0420cdae96c.png) |
| Out[14]= |
| In[15]:= | ![ResourceFunction["SzegedIndex"][\!\(\*
GraphicsBox[
NamespaceBox["NetworkGraphics",
DynamicModuleBox[{Typeset`graph = HoldComplete[
Graph[{1, 2, 3, 4, 5, 6, 7, 8, 9, 10}, {Null, {{3, 4}, {5, 6}, {5, 3}, {7, 8}, {7, 1}, {7, 2}, {
7, 3}, {9, 10}, {9, 2}}}]]},
TagBox[GraphicsGroupBox[
GraphicsComplexBox[{{0., 1.466033332275663}, {
0.7330166661378313, 1.466033332275663}, {1.8325416653445783`,
1.466033332275663}, {1.4660333322756627`, 0.7330166661378315}, {2.199049998413494, 0.7330166661378315}, {2.199049998413494, 0.}, {
1.2827791657412049`, 2.199049998413494}, {
2.5655583314824097`, 1.466033332275663}, {0.7330166661378313,
0.7330166661378315}, {0.7330166661378313, 0.}}, {
{Hue[0.6, 0.7, 0.5], Opacity[0.7], Arrowheads[0.], ArrowBox[{{1, 7}, {2, 7}, {2, 9}, {3, 4}, {3, 5}, {3, 7}, {
5, 6}, {7, 8}, {9, 10}}, 0.027040802458717428`]},
{Hue[0.6, 0.2, 0.8], EdgeForm[{GrayLevel[0], Opacity[0.7]}], DiskBox[1, 0.027040802458717428], DiskBox[2, 0.027040802458717428], DiskBox[3, 0.027040802458717428], DiskBox[4, 0.027040802458717428], DiskBox[5, 0.027040802458717428], DiskBox[6, 0.027040802458717428], DiskBox[7, 0.027040802458717428], DiskBox[8, 0.027040802458717428], DiskBox[9, 0.027040802458717428], DiskBox[10, 0.027040802458717428]}}]],
MouseAppearanceTag["NetworkGraphics"]],
AllowKernelInitialization->False]],
DefaultBaseStyle->"NetworkGraphics",
FormatType->TraditionalForm,
FrameTicks->None]\)]](https://www.wolframcloud.com/obj/resourcesystem/images/9ba/9ba8469e-bb44-4328-b404-e0a9944b880a/267e25a2f784578b.png) |
| Out[15]= |
GraphData provides the pre-computed WienerIndex for many special graphs:
| In[16]:= |
| Out[16]= |
We can confirm this number by computing it on the graph:
| In[17]:= |
| Out[17]= |
Wolfram Language 12.3 (May 2021) or above
This work is licensed under a Creative Commons Attribution 4.0 International License