Wolfram Function Repository
Instant-use add-on functions for the Wolfram Language
Function Repository Resource:
Compute the contingency table for a two- or three- column dataset or array
ResourceFunction["CrossTabulate"][data] finds the contingency table for the Dataset or array data. |
Here is an array of random integer-word pairs:
| In[1]:= | ![SeedRandom[4];
iwPairs = Transpose[{RandomInteger[5, 200], RandomChoice[RandomWord[5], 200]}];
Short[iwPairs]](https://www.wolframcloud.com/obj/resourcesystem/images/988/98876456-12c5-4321-aa4b-206da2a48155/1ae12edcd57edcf2.png) |
| Out[3]= |
Compute the contingency table:
| In[4]:= |
| Out[4]= | 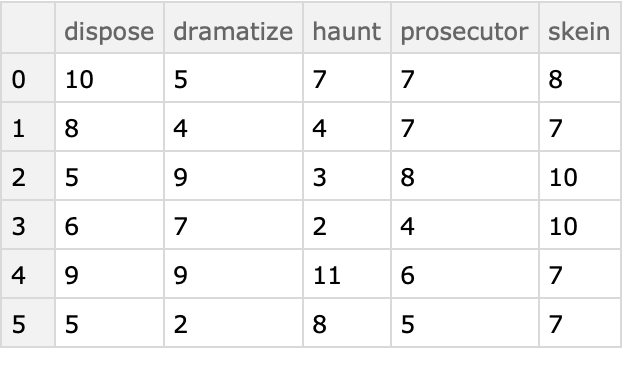 |
Here is a Dataset, the first two columns of which are categorical columns and the third column which is numeric:
| In[5]:= | ![dataset = Dataset[{
<|"a" -> 1, "b" -> "x", "c" -> 5|>,
<|"a" -> 2, "b" -> "y", "c" -> 6|>,
<|"a" -> 3, "b" -> "z", "c" -> 4.5|>,
<|"a" -> 1, "b" -> "x", "c" -> 10|>,
<|"a" -> 2, "b" -> "y", "c" -> 100|>,
<|"a" -> 3, "b" -> "z", "c" -> Missing[]|>}]](https://www.wolframcloud.com/obj/resourcesystem/images/988/98876456-12c5-4321-aa4b-206da2a48155/70b293b9dabcdbf8.png) |
| Out[5]= | 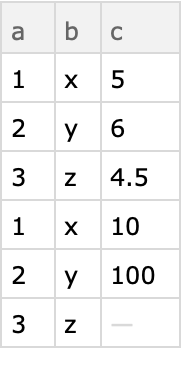 |
Compute the contingency table:
| In[6]:= |
| Out[6]= | 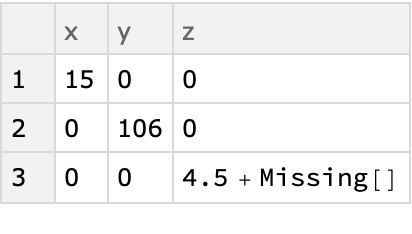 |
For large contingency tables instead of using Dataset it is faster and more convenient to use sparse arrays. That is specified with the option “Sparse”:
| In[7]:= | ![Block[{n = 30},
SeedRandom[32];
sarr = Transpose[{RandomChoice[CharacterRange["A", "D"], n], RandomChoice[RandomWord["CommonWords", 5], n], RandomReal[100, n]}]
]](https://www.wolframcloud.com/obj/resourcesystem/images/988/98876456-12c5-4321-aa4b-206da2a48155/19ee18a8cc0ffd46.png) |
| Out[7]= |  |
| In[8]:= |
| Out[8]= |
Here is a full array with three columns:
| In[9]:= | ![Block[{n = 30},
SeedRandom[32];
sarr = Transpose[{RandomChoice[CharacterRange["A", "D"], n], RandomChoice[RandomWord["CommonWords", 5], n], RandomReal[100, n]}]
]](https://www.wolframcloud.com/obj/resourcesystem/images/988/98876456-12c5-4321-aa4b-206da2a48155/0d015054b4b05cf4.png) |
| Out[9]= |  |
Compute the contingency table of the co-occurrences of each letter and with each word found by cross tabulating over the first two columns only:
| In[10]:= |
| Out[10]= | 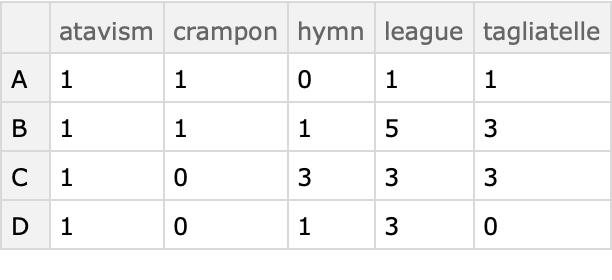 |
Here the cross tabulation uses the third column -- for each unique letter-word pair the corresponding values of the third column are added:
| In[11]:= |
| Out[11]= |  |
If any of the columns have missing values they are shown in the contingency table:
| In[12]:= | ![dataset2 = Dataset[{
<|"a" -> 1, "b" -> "x", "c" -> 5|>,
<|"a" -> Missing["first"], "b" -> "x", "c" -> 6|>,
<|"a" -> 3, "b" -> "z", "c" -> 4.5|>,
<|"a" -> 1, "b" -> "x", "c" -> 10|>,
<|"a" -> 2, "b" -> "y", "c" -> 100|>,
<|"a" -> 3, "b" -> "z", "c" -> Missing[]|>}]](https://www.wolframcloud.com/obj/resourcesystem/images/988/98876456-12c5-4321-aa4b-206da2a48155/234cfb9f4c36f127.png) |
| Out[12]= | 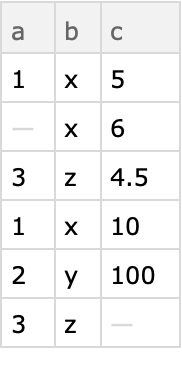 |
| In[13]:= |
| Out[13]= | 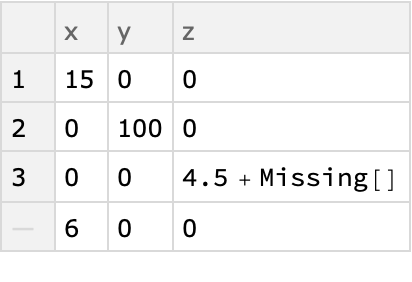 |
The result of CrossTabulate is a Dataset by default. With the option setting "Sparse"→True the result is an Association with three elements: a sparse matrix with the contingency values, row names, and column names.
Here is an example:
| In[14]:= | ![Block[{n = 40},
data = Transpose[{ToString /@ RandomInteger[{10, 20}, n], ToString /@ RandomInteger[{1, 6}, n]}]
];](https://www.wolframcloud.com/obj/resourcesystem/images/988/98876456-12c5-4321-aa4b-206da2a48155/24598487315137f0.png) |
| In[15]:= |
| Out[15]= |  |
Using MatrixForm we can visualize the result:
| In[16]:= |
| Out[16]= |  |
Take the Titanic dataset:
| In[17]:= |
Find how many males and females are in each passenger class:
| In[18]:= |
| Out[18]= | 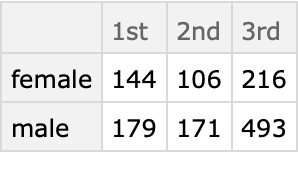 |
Find how many males and females survived:
| In[19]:= |
| Out[19]= | 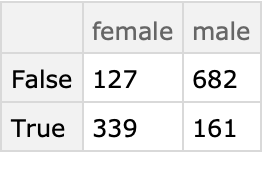 |
Find the aggregated ages of the class-sex breakdown:
| In[20]:= |
| Out[20]= | 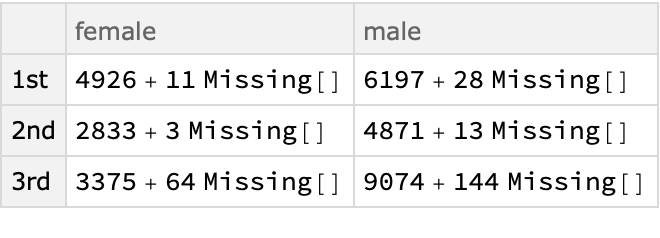 |
Here is a function to plot sparse contingency tables:
| In[21]:= | ![CTMatrixPlot[x_Association /; KeyExistsQ[x, "SparseMatrix"], opts___] :=
MatrixPlot[#1, Append[{opts}, FrameLabel -> {{Keys[x][[2]], None}, {Keys[x][[3]], None}}]] & @@
x;](https://www.wolframcloud.com/obj/resourcesystem/images/988/98876456-12c5-4321-aa4b-206da2a48155/6aa6ad25a9e7edbc.png) |
| In[22]:= |
| Out[22]= | 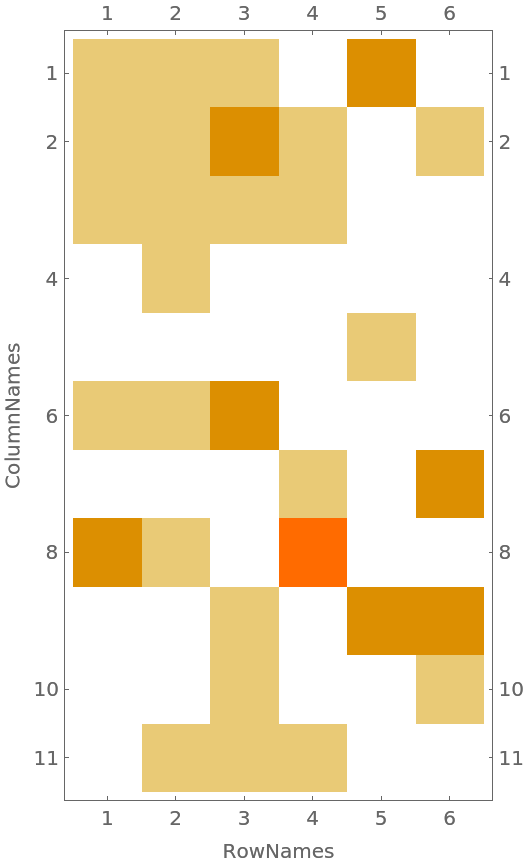 |
Start with movie review data:
| In[23]:= | ![movieReviewData = Flatten@*List @@@ ExampleData[{"MachineLearning", "MovieReview"}, "Data"];
Dimensions[movieReviewData]](https://www.wolframcloud.com/obj/resourcesystem/images/988/98876456-12c5-4321-aa4b-206da2a48155/413bc9c6e99797b1.png) |
| Out[22]= |
For each movie review we make a list of word-sentiment pairs and then join them into one big list:
| In[24]:= | ![movieReviewData = Join @@ Map[
Thread[{DeleteStopwords[StringSplit[#[[1]]]], #[[2]]}] &, movieReviewData];
Dimensions[movieReviewData]](https://www.wolframcloud.com/obj/resourcesystem/images/988/98876456-12c5-4321-aa4b-206da2a48155/5b75bf0d1300dba7.png) |
| Out[20]= |
Here is a sample:
| In[25]:= |
| Out[25]= |
Here we find the word-sentiment contingency table as a sparse matrix in order to plot it below:
| In[26]:= |
Here is a function to plot sparse contingency tables:
| In[27]:= | ![CTMatrixPlot[x_Association /; KeyExistsQ[x, "SparseMatrix"], opts___] :=
MatrixPlot[#1, Append[{opts}, FrameLabel -> {{Keys[x][[2]], None}, {Keys[x][[3]], None}}]] & @@
x;](https://www.wolframcloud.com/obj/resourcesystem/images/988/98876456-12c5-4321-aa4b-206da2a48155/7ebd1c7e6bcd5e38.png) |
Plot the contingency table:
| In[28]:= |
| Out[28]= | 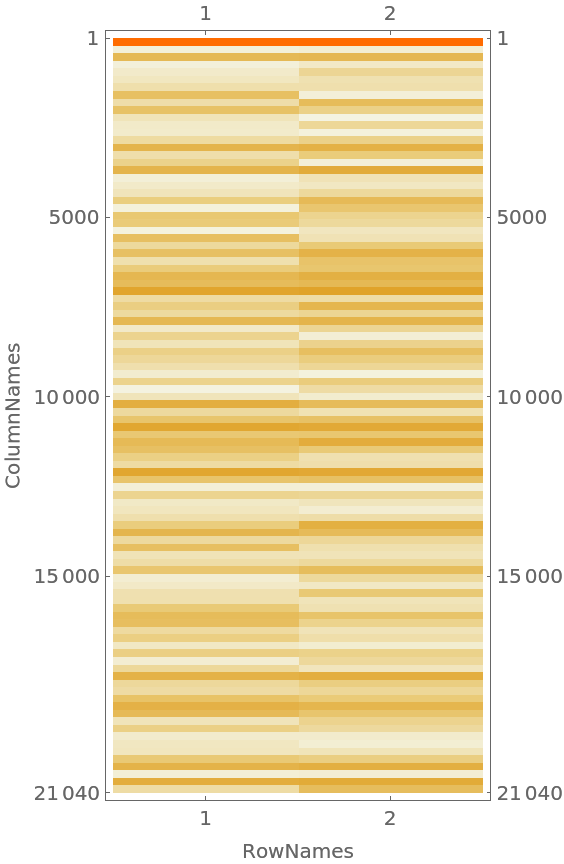 |
Find the contingency table Dataset:
| In[29]:= |
Show the most prominent words for negative reviews:
| In[30]:= |
| Out[30]= | 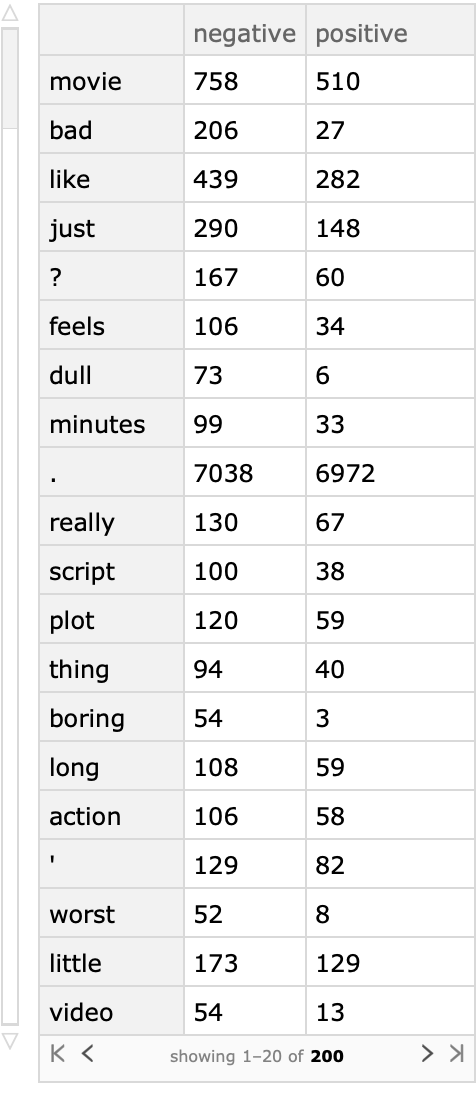 |
The functionality of CrossTabulate can be emulated with Tally or GroupBy.
Here is a contingency matrix of a two column array:
| In[31]:= | ![Block[{n = 30},
SeedRandom[32];
sarr = Transpose[{RandomChoice[CharacterRange["A", "D"], n], RandomChoice[RandomWord["CommonWords", 5], n], RandomReal[100, n]}]
];
ResourceFunction["CrossTabulate"][sarr[[All, 1 ;; 2]]]](https://www.wolframcloud.com/obj/resourcesystem/images/988/98876456-12c5-4321-aa4b-206da2a48155/28312d7ff4bc1130.png) |
| Out[31]= |  |
Obtain the contingency value triplets using Tally:
| In[32]:= |
| Out[32]= |  |
Obtain the contingency values rules using GroupBy:
| In[33]:= |
| Out[33]= |  |
GroupBy generalizes better than Tally -- we can use GroupBy to get the contingency values for three column data:
| In[34]:= |
| Out[34]= |  |
Find the corresponding result of CrossTabulate:
| In[35]:= |
| Out[35]= |  |
Convert the Association obtained with the option setting "Sparse"→True into a Dataset:
| In[36]:= | ![Block[{n = 30},
SeedRandom[32];
sarr = Transpose[{RandomChoice[CharacterRange["A", "D"], n], RandomChoice[RandomWord["CommonWords", 5], n], RandomReal[100, n]}]
];
res = ResourceFunction["CrossTabulate"][sarr, "Sparse" -> True]](https://www.wolframcloud.com/obj/resourcesystem/images/988/98876456-12c5-4321-aa4b-206da2a48155/1f9cddf14917987b.png) |
| Out[36]= |  |
| In[37]:= |
| Out[37]= | 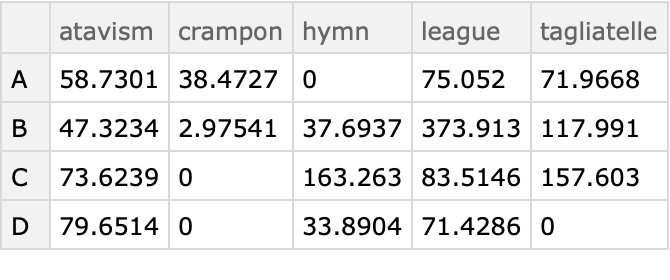 |
If the second variable is numerical or has missing values the resulting Dataset would not have a tabular form:
| In[38]:= | ![sarr2 = iwPairs;
sarr2[[2, 1]] = Missing[];
sarr2[[4, 2]] = Missing[\[Infinity]];
ResourceFunction["CrossTabulate"][sarr2]](https://www.wolframcloud.com/obj/resourcesystem/images/988/98876456-12c5-4321-aa4b-206da2a48155/011c6bdbc031cb1f.png) |
| Out[38]= | 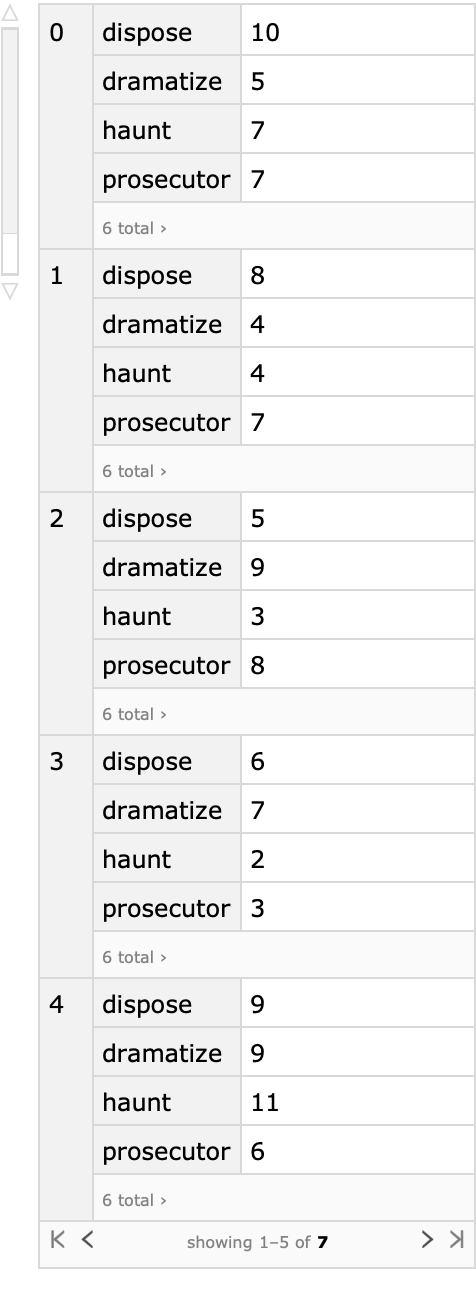 |
One way to get a tabular form is to replace Missing[___] with a string:
| In[39]:= |
| Out[39]= | 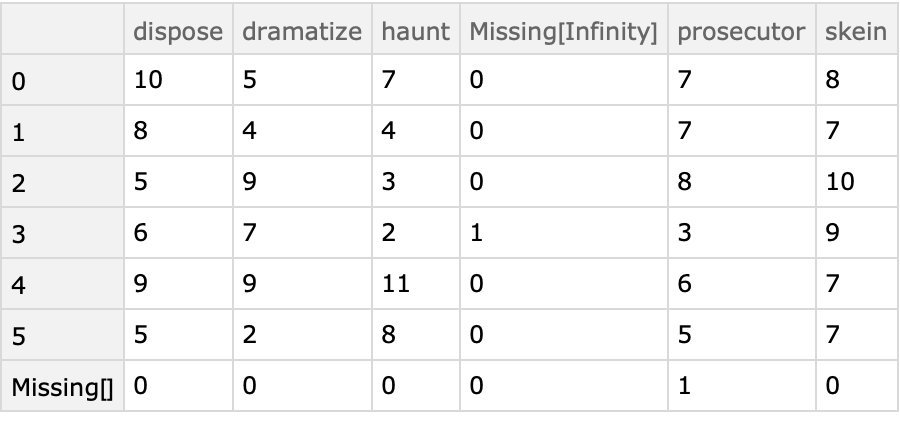 |
Find the co-occurrence of the integers [1,3] in a list of random integer pairs:
| In[40]:= |
| Out[40]= | 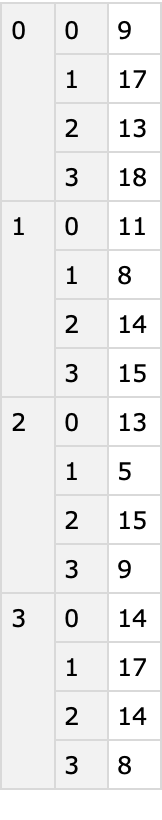 |
Again, replacing the integer values with strings produces tabular form:
| In[41]:= |
| Out[41]= | 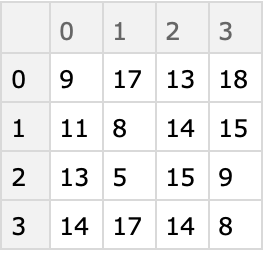 |
Here is a grid of contingency tables showing various breakdown perspectives of the Titanic data:
| In[42]:= | ![titanic = ExampleData[{"Dataset", "Titanic"}];
columnNames = {"sex", "class", "survived"};
res = Outer[
If[#1 == #2, "", ResourceFunction["CrossTabulate"][titanic[All, {#1, #2}]]] &, columnNames, columnNames];
Grid[Prepend[MapThread[Prepend, {res, columnNames}], Prepend[columnNames, ""]], Dividers -> All]](https://www.wolframcloud.com/obj/resourcesystem/images/988/98876456-12c5-4321-aa4b-206da2a48155/2c23d418485685b0.png) |
| Out[38]= | 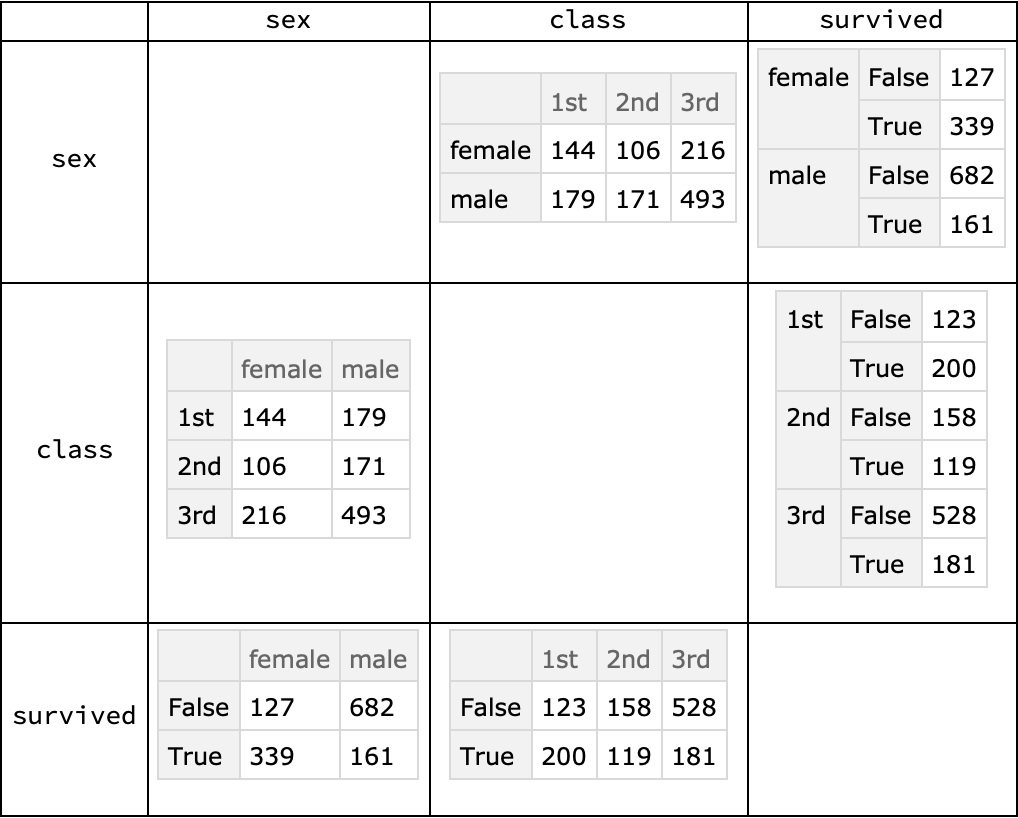 |
This work is licensed under a Creative Commons Attribution 4.0 International License