Wolfram Function Repository
Instant-use add-on functions for the Wolfram Language
Function Repository Resource:
Return the non-isomorphic components of a graph
ResourceFunction["NonIsomorphicComponents"][g] returns the non-isomorphic components of the graph g. |
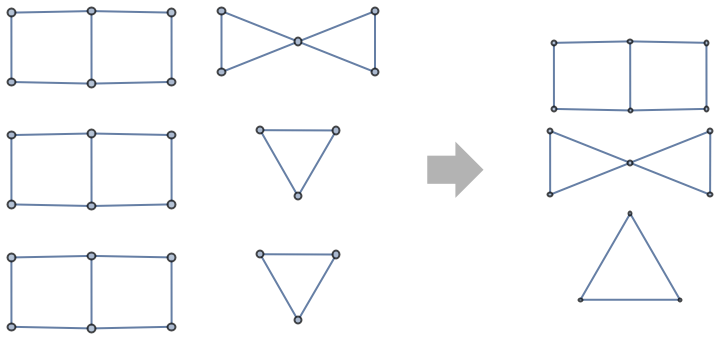
Find the non isomorphic components in a graph:
| In[1]:= | ![ResourceFunction["NonIsomorphicComponents"][\!\(\*
GraphicsBox[
NamespaceBox["NetworkGraphics",
DynamicModuleBox[{Typeset`graph = HoldComplete[
Graph[{1, 2, 3, 4, 5, 6, 7, 8, 9, 10, 11, 12, 13, 14, 15, 16, 17, 18, 19, 20, 21, 22, 23, 24, 25, 26, 27, 28, 29}, {Null, {{1, 3}, {1, 5}, {2, 4}, {2, 6}, {3, 5}, {4, 6}, {
7, 8}, {7, 9}, {8, 10}, {9, 10}, {9, 11}, {10, 12}, {11, 12}, {13, 14}, {13, 15}, {14, 16}, {15, 16}, {15, 17}, {16, 18}, {17, 18}, {19, 20}, {19, 21}, {20, 22}, {21, 22}, {21, 23}, {22, 24}, {23, 24}, {25, 27}, {25, 26}, {26, 27}, {27, 28}, {27, 29}, {28, 29}}}]]},
TagBox[GraphicsGroupBox[GraphicsComplexBox[CompressedData["
1:eJxTTMoPSmViYGCQBWIQ/d3UrjM9QcDhR+fCIMsJggdg/A1cfrtniLIdOMph
sKknWcgh7s27lEozHjjf9tjnr3bh//avW7Nvu8xxHodcqUsKJvo8B2D8KKVd
uVs8/u3fsItrbe/PK/aGTLPvefn/329hsSFkKctVe+4JX1f8+ch2YILNqaoT
It/sn5tt9Pv2699+I7vaKzoS3+wfG5zVTZRlP2BUrhr8q4TZ4dcDjiXsvv/3
dxSfW3+sjNnh7IbO5h8f2A7AzDc7yvLwXSvPAZj5IllhvMovBOHmT7jPP/NI
NM8BmPkNVof8r/4VhJs/a8tu57MtPAdg5pdWLfi14Lkg3Pw7zze+ue91De7+
u9Nr8tLUv+yHmb8Fog7u/p6b2hX6dV/2w8xnSM5kuux4De7++JtLlONUv+xn
OtfG0JYj4vBihu3F7f+u7D9cfVTXC8gXknq1WUfk0/7VS6OucCULOJTdfSYR
Fvx8v6mSoLTWVg4HmH1VEt9XrgTyHzJtWlQr+mk/ANLI5ns=
"], {
{Hue[0.6, 0.7, 0.5], Opacity[0.7], Arrowheads[0.], ArrowBox[{{1, 3}, {1, 5}, {2, 4}, {2, 6}, {3, 5}, {4, 6}, {
7, 8}, {7, 9}, {8, 10}, {9, 10}, {9, 11}, {10, 12}, {11, 12}, {13, 14}, {13, 15}, {14, 16}, {15, 16}, {15, 17}, {
16, 18}, {17, 18}, {19, 20}, {19, 21}, {20, 22}, {21, 22}, {21, 23}, {22, 24}, {23, 24}, {25, 26}, {25, 27}, {
26, 27}, {27, 28}, {27, 29}, {28, 29}}, 0.04176463281444433]},
{Hue[0.6, 0.2, 0.8], EdgeForm[{GrayLevel[0], Opacity[0.7]}], DiskBox[1, 0.04176463281444433], DiskBox[2, 0.04176463281444433], DiskBox[3, 0.04176463281444433], DiskBox[4, 0.04176463281444433], DiskBox[5, 0.04176463281444433], DiskBox[6, 0.04176463281444433], DiskBox[7, 0.04176463281444433], DiskBox[8, 0.04176463281444433], DiskBox[9, 0.04176463281444433], DiskBox[10, 0.04176463281444433], DiskBox[11, 0.04176463281444433], DiskBox[12, 0.04176463281444433], DiskBox[13, 0.04176463281444433], DiskBox[14, 0.04176463281444433], DiskBox[15, 0.04176463281444433], DiskBox[16, 0.04176463281444433], DiskBox[17, 0.04176463281444433], DiskBox[18, 0.04176463281444433], DiskBox[19, 0.04176463281444433], DiskBox[20, 0.04176463281444433], DiskBox[21, 0.04176463281444433], DiskBox[22, 0.04176463281444433], DiskBox[23, 0.04176463281444433], DiskBox[24, 0.04176463281444433], DiskBox[25, 0.04176463281444433], DiskBox[26, 0.04176463281444433], DiskBox[27, 0.04176463281444433], DiskBox[28, 0.04176463281444433], DiskBox[29, 0.04176463281444433]}}]],
MouseAppearanceTag["NetworkGraphics"]],
AllowKernelInitialization->False]],
DefaultBaseStyle->"NetworkGraphics",
FormatType->TraditionalForm,
FrameTicks->None,
ImageSize->{193.2, Automatic}]\)]](https://www.wolframcloud.com/obj/resourcesystem/images/920/92078c16-1ba4-4319-b13f-72906757231e/230516f4177a6b3e.png) |
| Out[1]= | 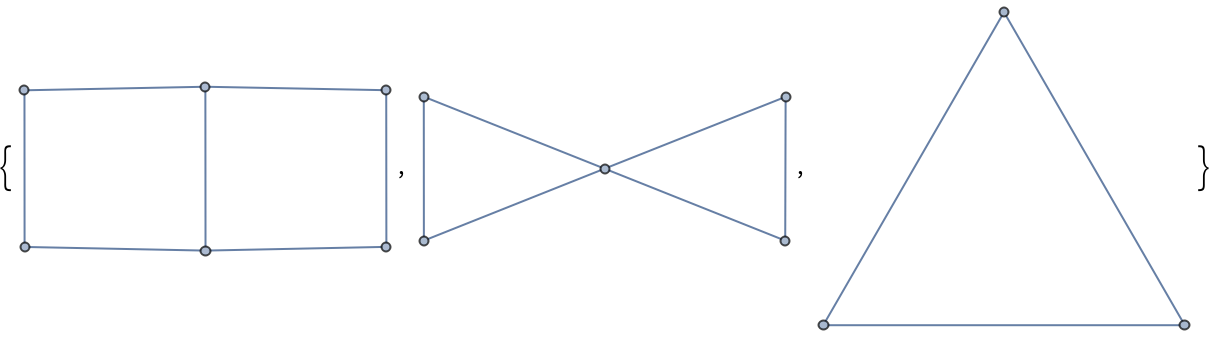 |
Works with undirected graphs:
| In[2]:= |
| Out[2]= | 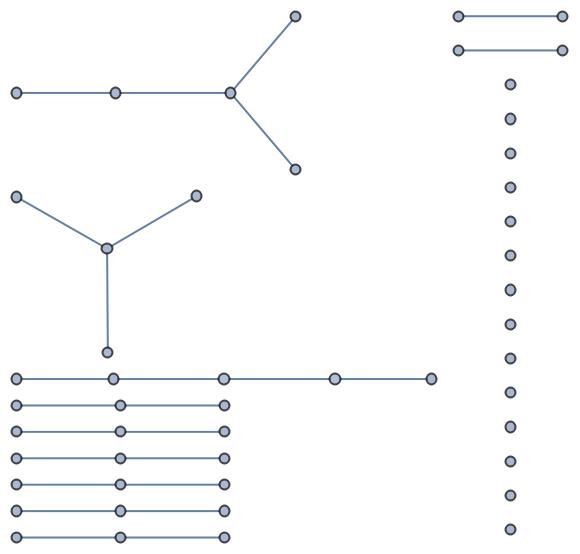 |
| In[3]:= |
| Out[3]= | 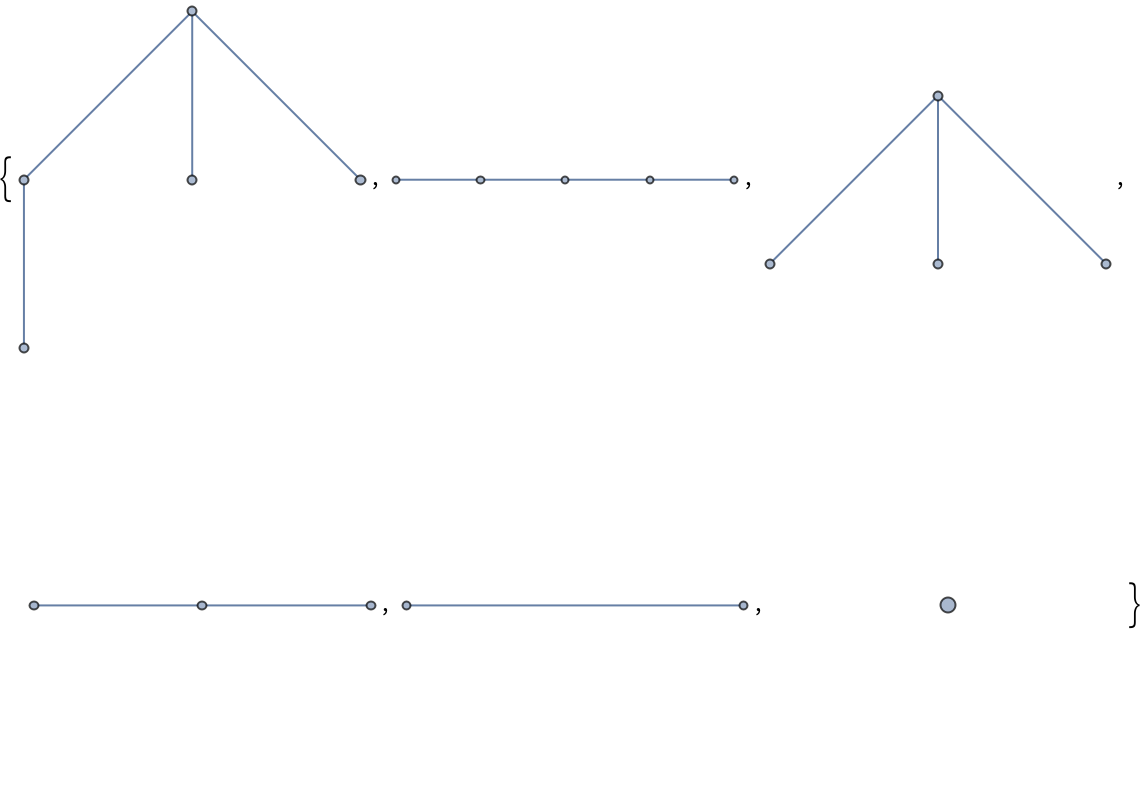 |
Directed graphs:
| In[4]:= |
| Out[4]= | 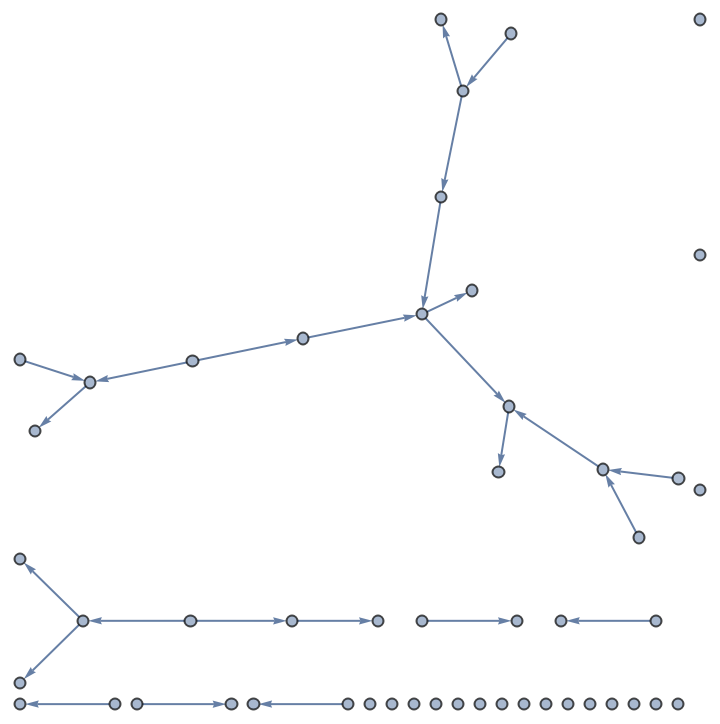 |
| In[5]:= |
| Out[5]= | 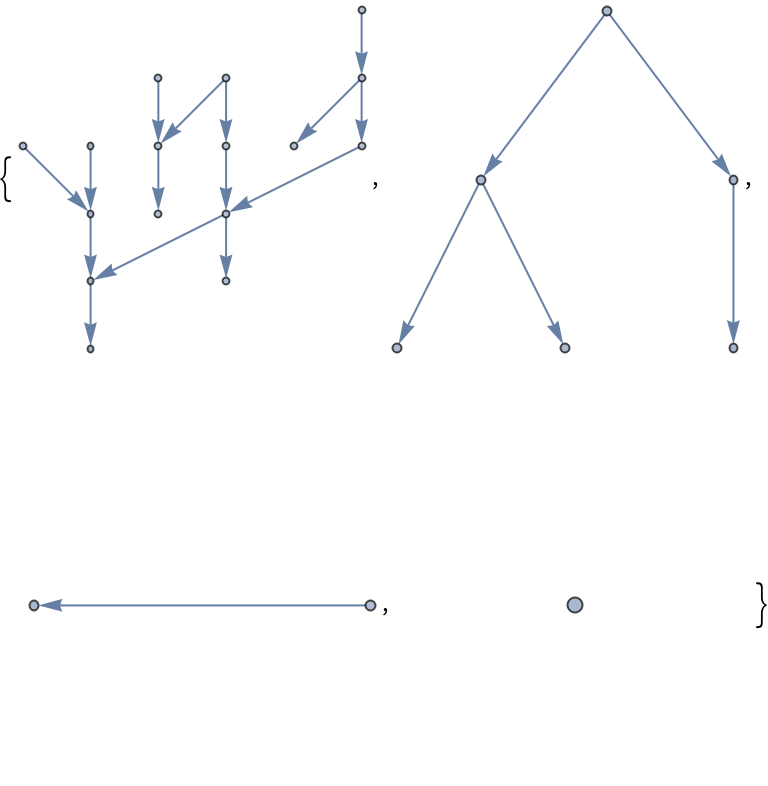 |
Weighted graphs:
| In[6]:= | ![ResourceFunction["NonIsomorphicComponents"][\!\(\*
GraphicsBox[
NamespaceBox["NetworkGraphics",
DynamicModuleBox[{Typeset`graph = HoldComplete[
Graph[{1, 2, 3, 4, 5}, {Null, SparseArray[
Automatic, {5, 5}, 0, {1, {{0, 3, 6, 8, 9, 10}, {{2}, {3}, {4}, {2}, {3}, {
5}, {4}, {5}, {5}, {5}}}, {1, 1, 1, 1, 1, 1, 1, 1, 1, 1}}]}, {EdgeWeight -> {1.2369696639583552`, 4.812258229681952, 8.607929577404715, 7.431845779784997, 8.574488000789195, 8.006160372677755, 2.8301481232102947`, 9.121065878848466, 2.3183507378286023`, 1.7298078679288516`}, FormatType -> TraditionalForm, GraphLayout -> {"Dimension" -> 2}, ImageSize -> {131.4000000000001, Automatic}, VertexLabels -> {
Placed[Automatic, Center]}, VertexSize -> {0.25}, VertexStyle -> {
GrayLevel[1]}}]]},
TagBox[GraphicsGroupBox[{
{Hue[0.6, 0.7, 0.5], Opacity[0.7], Arrowheads[0.], ArrowBox[{{0., 0.012484330888018924`}, {
0.011333771416589089`, 1.1666638939968836`}}, 0.10192290483023064`], ArrowBox[{{0., 0.012484330888018924`}, {0.5818822250328072, 0.5841484109973273}}, 0.10192290483023064`], ArrowBox[{{0., 0.012484330888018924`}, {1.1541843168018768`,
0.}}, 0.10192290483023064`], ArrowBox[
BezierCurveBox[{{0.011333771416589089`, 1.1666638939968836`}, {-0.18684105756379346`, 1.0962815719756591`}, {-0.3663390917212296, 1.1988433261781792`}, {-0.4132538528198191, 1.3309407689787274`}, {-0.14439391571122775`, 1.5944610769823941`}, {-0.013264036975934812`, 1.544906217419994}, {0.08567681402759109, 1.3633871669206583`}, {0.011333771416589089`, 1.1666638939968836`}},
SplineDegree->7], 0.10192290483023064`], ArrowBox[{{0.011333771416589089`, 1.1666638939968836`}, {
0.5818822250328072, 0.5841484109973273}}, 0.10192290483023064`], ArrowBox[{{0.011333771416589089`, 1.1666638939968836`}, {
1.1666848480058034`, 1.1548334540590575`}}, 0.10192290483023064`], ArrowBox[{{0.5818822250328072, 0.5841484109973273}, {
1.1541843168018768`, 0.}}, 0.10192290483023064`], ArrowBox[{{0.5818822250328072, 0.5841484109973273}, {
1.1666848480058034`, 1.1548334540590575`}}, 0.10192290483023064`], ArrowBox[{{1.1541843168018768`, 0.}, {1.1666848480058034`, 1.1548334540590575`}}, 0.10192290483023064`], ArrowBox[
BezierCurveBox[{{1.1666848480058034`, 1.1548334540590575`}, {1.096428457927411, 1.3530529650328658`}, {1.1990740340904533`, 1.532488387080747}, {1.3311868766939918`, 1.579333895788655}, {1.5945558474459913`, 1.3103582119248316`}, {1.5449381846459758`, 1.1792613301726174`}, {1.3633806566239384`, 1.0804177719107293`}, {1.1666848480058034`, 1.1548334540590575`}},
SplineDegree->7], 0.10192290483023064`]},
{GrayLevel[1], EdgeForm[{GrayLevel[0], Opacity[
0.7]}], {
DiskBox[{0., 0.012484330888018924`}, 0.10192290483023064], InsetBox["1", {0., 0.012484330888018924},
BaseStyle->"Graphics"]}, {
DiskBox[{0.011333771416589089`, 1.1666638939968836`}, 0.10192290483023064], InsetBox["2", {0.011333771416589089, 1.1666638939968836},
BaseStyle->"Graphics"]}, {
DiskBox[{0.5818822250328072, 0.5841484109973273}, 0.10192290483023064], InsetBox["3", {0.5818822250328072, 0.5841484109973273},
BaseStyle->"Graphics"]}, {
DiskBox[{1.1541843168018768`, 0.}, 0.10192290483023064], InsetBox["4", {1.1541843168018768, 0.},
BaseStyle->"Graphics"]}, {
DiskBox[{1.1666848480058034`, 1.1548334540590575`}, 0.10192290483023064], InsetBox["5", {1.1666848480058034, 1.1548334540590575},
BaseStyle->"Graphics"]}}}],
MouseAppearanceTag["NetworkGraphics"]],
AllowKernelInitialization->False]],
DefaultBaseStyle->"NetworkGraphics",
FormatType->TraditionalForm,
FrameTicks->None,
ImageSize->{131.4000000000001, Automatic}]\)]](https://www.wolframcloud.com/obj/resourcesystem/images/920/92078c16-1ba4-4319-b13f-72906757231e/4a30fcc30c954ad8.png) |
| Out[6]= | 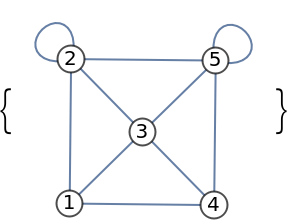 |
Multigraphs:
| In[7]:= | ![ResourceFunction["NonIsomorphicComponents"][\!\(\*
GraphicsBox[
NamespaceBox["NetworkGraphics",
DynamicModuleBox[{Typeset`graph = HoldComplete[
Graph[{1, 2, 3, 4, 5}, {Null, SparseArray[
Automatic, {5, 5}, 0, {1, {{0, 3, 6, 8, 9, 10}, {{2}, {3}, {4}, {2}, {3}, {
5}, {4}, {5}, {5}, {5}}}, {2, 1, 1, 1, 1, 1, 1, 1, 2, 1}}]}, {GraphLayout -> {"Dimension" -> 2}, ImageSize -> {131.4000000000001, Automatic}, VertexLabels -> {
Placed[Automatic, Center]}, VertexSize -> {0.25}, VertexStyle -> {
GrayLevel[1]}}]]},
TagBox[GraphicsGroupBox[{
{Hue[0.6, 0.7, 0.5], Opacity[0.7], Arrowheads[0.], ArrowBox[
BezierCurveBox[{{0., 0.012484330888018924`}, {-0.18412726403280927`, 0.5914378462825931}, {0.011333771416589089`, 1.1666638939968836`}}], 0.10192290483023064`], ArrowBox[
BezierCurveBox[{{0., 0.012484330888018924`}, {
0.195461035449399, 0.5877103786023026}, {
0.011333771416589089`, 1.1666638939968836`}}], 0.10192290483023064`], ArrowBox[{{0., 0.012484330888018924`}, {0.5818822250328072, 0.5841484109973273}}, 0.10192290483023064`], ArrowBox[{{0., 0.012484330888018924`}, {1.1541843168018768`,
0.}}, 0.10192290483023064`], ArrowBox[
BezierCurveBox[{{0.011333771416589089`, 1.1666638939968836`}, {-0.18684105756379346`, 1.0962815719756591`}, {-0.3663390917212296, 1.1988433261781792`}, {-0.4132538528198191, 1.3309407689787274`}, {-0.14439391571122775`, 1.5944610769823941`}, {-0.013264036975934812`, 1.544906217419994}, {0.08567681402759109, 1.3633871669206583`}, {0.011333771416589089`, 1.1666638939968836`}},
SplineDegree->7], 0.10192290483023064`], ArrowBox[{{0.011333771416589089`, 1.1666638939968836`}, {
0.5818822250328072, 0.5841484109973273}}, 0.10192290483023064`], ArrowBox[{{0.011333771416589089`, 1.1666638939968836`}, {
1.1666848480058034`, 1.1548334540590575`}}, 0.10192290483023064`], ArrowBox[{{0.5818822250328072, 0.5841484109973273}, {
1.1541843168018768`, 0.}}, 0.10192290483023064`], ArrowBox[{{0.5818822250328072, 0.5841484109973273}, {
1.1666848480058034`, 1.1548334540590575`}}, 0.10192290483023064`], ArrowBox[
BezierCurveBox[{{1.1541843168018768`, 0.}, {
0.9705329063463092, 0.5794723237208922}, {
1.1666848480058034`, 1.1548334540590575`}}], 0.10192290483023064`], ArrowBox[
BezierCurveBox[{{1.1541843168018768`, 0.}, {
1.3503362584613736`, 0.5753611303381693}, {
1.1666848480058034`, 1.1548334540590575`}}], 0.10192290483023064`], ArrowBox[
BezierCurveBox[{{1.1666848480058034`, 1.1548334540590575`}, {1.096428457927411, 1.3530529650328658`}, {1.1990740340904533`, 1.532488387080747}, {1.3311868766939918`, 1.579333895788655}, {1.5945558474459913`, 1.3103582119248316`}, {1.5449381846459758`, 1.1792613301726174`}, {1.3633806566239384`, 1.0804177719107293`}, {1.1666848480058034`, 1.1548334540590575`}},
SplineDegree->7], 0.10192290483023064`]},
{GrayLevel[1], EdgeForm[{GrayLevel[0], Opacity[
0.7]}], {
DiskBox[{0., 0.012484330888018924`}, 0.10192290483023064], InsetBox["1", {0., 0.012484330888018924},
BaseStyle->"Graphics"]}, {
DiskBox[{0.011333771416589089`, 1.1666638939968836`}, 0.10192290483023064], InsetBox["2", {0.011333771416589089, 1.1666638939968836},
BaseStyle->"Graphics"]}, {
DiskBox[{0.5818822250328072, 0.5841484109973273}, 0.10192290483023064], InsetBox["3", {0.5818822250328072, 0.5841484109973273},
BaseStyle->"Graphics"]}, {
DiskBox[{1.1541843168018768`, 0.}, 0.10192290483023064], InsetBox["4", {1.1541843168018768, 0.},
BaseStyle->"Graphics"]}, {
DiskBox[{1.1666848480058034`, 1.1548334540590575`}, 0.10192290483023064], InsetBox["5", {1.1666848480058034, 1.1548334540590575},
BaseStyle->"Graphics"]}}}],
MouseAppearanceTag["NetworkGraphics"]],
AllowKernelInitialization->False]],
DefaultBaseStyle->"NetworkGraphics",
FormatType->TraditionalForm,
FrameTicks->None,
ImageSize->{131.4000000000001, Automatic}]\)]](https://www.wolframcloud.com/obj/resourcesystem/images/920/92078c16-1ba4-4319-b13f-72906757231e/349dc4c122a75883.png) |
| Out[7]= | 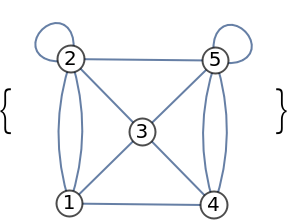 |
Mixed graphs:
| In[8]:= | ![ResourceFunction["NonIsomorphicComponents"][\!\(\*
GraphicsBox[
NamespaceBox["NetworkGraphics",
DynamicModuleBox[{Typeset`graph = HoldComplete[
Graph[{2, 1, 3, 4, 5}, {{{1, 2}, {4, 2}, {3, 1}, {3, 5}, {5, 5}}, {{3, 2}, {1, 1}, {5, 1}, {5, 4}}}, {FormatType -> TraditionalForm, GraphLayout -> {"Dimension" -> 2}, VertexLabels -> {
Placed[Automatic, Center]}, VertexSize -> {0.2}, VertexStyle -> {
GrayLevel[1]}}]]},
TagBox[GraphicsGroupBox[{
{Hue[0.6, 0.7, 0.5], Opacity[0.7], Arrowheads[Medium],
{Arrowheads[0.], ArrowBox[
BezierCurveBox[{{1.7750956636961295`, 0.13226206424409698`}, {1.966185455332654, 0.22007793074812088`}, {2.154132967190708, 0.1340028601544194}, {2.2126817457067816`, 0.0066437403350446955`}, {
1.968508088505095, -0.27987041008990765`}, {
1.8334766867831747`, -0.2422562449934525}, {
1.718689729212581, -0.07033434597232444}, {
1.7750956636961295`, 0.13226206424409698`}},
SplineDegree->7], 0.07142150267772777]},
{Arrowheads[0.], ArrowBox[{{1.7750956636961295`, 0.13226206424409698`}, {
0.943188822949299, 0.}}, 0.07142150267772777]}, ArrowBox[{{1.7750956636961295`, 0.13226206424409698`}, {
0.9446927018534159, 0.979176716752343}}, 0.07142150267772777],
{Arrowheads[0.], ArrowBox[{{0.9446927018534159, 0.979176716752343}, {
1.7739785995788884`, 0.8464762174518206}}, 0.07142150267772777]}, ArrowBox[{{1.7739785995788884`, 0.8464762174518206}, {
1.7750956636961295`, 0.13226206424409698`}}, 0.07142150267772777], ArrowBox[{{1.7739785995788884`, 0.8464762174518206}, {
0.943188822949299, 0.}}, 0.07142150267772777],
{Arrowheads[0.], ArrowBox[{{0., 0.4896215582219036}, {0.943188822949299, 0.}}, 0.07142150267772777]}, ArrowBox[{{0., 0.4896215582219036}, {0.9446927018534159, 0.979176716752343}}, 0.07142150267772777], ArrowBox[
BezierCurveBox[{{0.943188822949299, 0.}, {
1.1211614620882508`, -0.12504457378621806`}, {
1.1394455650204758`, -0.32804828408198256`}, {
1.0602355701475654`, -0.44122719423721557`}, {
0.6928479934285716, -0.38172090202006825`}, {
0.6534140914385866, -0.2493250698895323}, {
0.7348438308049134, -0.06247215350711399}, {
0.943188822949299, 0.}},
SplineDegree->7], 0.07142150267772777]},
{GrayLevel[1], EdgeForm[{GrayLevel[0], Opacity[
0.7]}], {
DiskBox[{1.7750956636961295`, 0.13226206424409698`}, 0.07142150267772777], InsetBox["2", {1.7750956636961295, 0.13226206424409698},
BaseStyle->"Graphics"]}, {
DiskBox[{0.9446927018534159, 0.979176716752343}, 0.07142150267772777], InsetBox["1", {0.9446927018534159, 0.979176716752343},
BaseStyle->"Graphics"]}, {
DiskBox[{1.7739785995788884`, 0.8464762174518206}, 0.07142150267772777], InsetBox["3", {1.7739785995788884, 0.8464762174518206},
BaseStyle->"Graphics"]}, {
DiskBox[{0., 0.4896215582219036}, 0.07142150267772777], InsetBox["4", {0., 0.4896215582219036},
BaseStyle->"Graphics"]}, {
DiskBox[{0.943188822949299, 0.}, 0.07142150267772777], InsetBox["5", {0.943188822949299, 0.},
BaseStyle->"Graphics"]}}}],
MouseAppearanceTag["NetworkGraphics"]],
AllowKernelInitialization->False]],
DefaultBaseStyle->"NetworkGraphics",
FormatType->TraditionalForm,
FrameTicks->None,
ImageSize->{189.5999999999999, Automatic}]\)]](https://www.wolframcloud.com/obj/resourcesystem/images/920/92078c16-1ba4-4319-b13f-72906757231e/51947b58a64c8587.png) |
| Out[8]= | 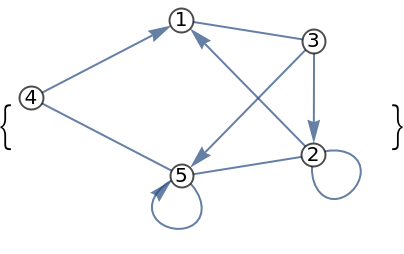 |
Explore and analyze the patterns or structures within a network:
| In[9]:= |
| In[10]:= |
| Out[10]= | 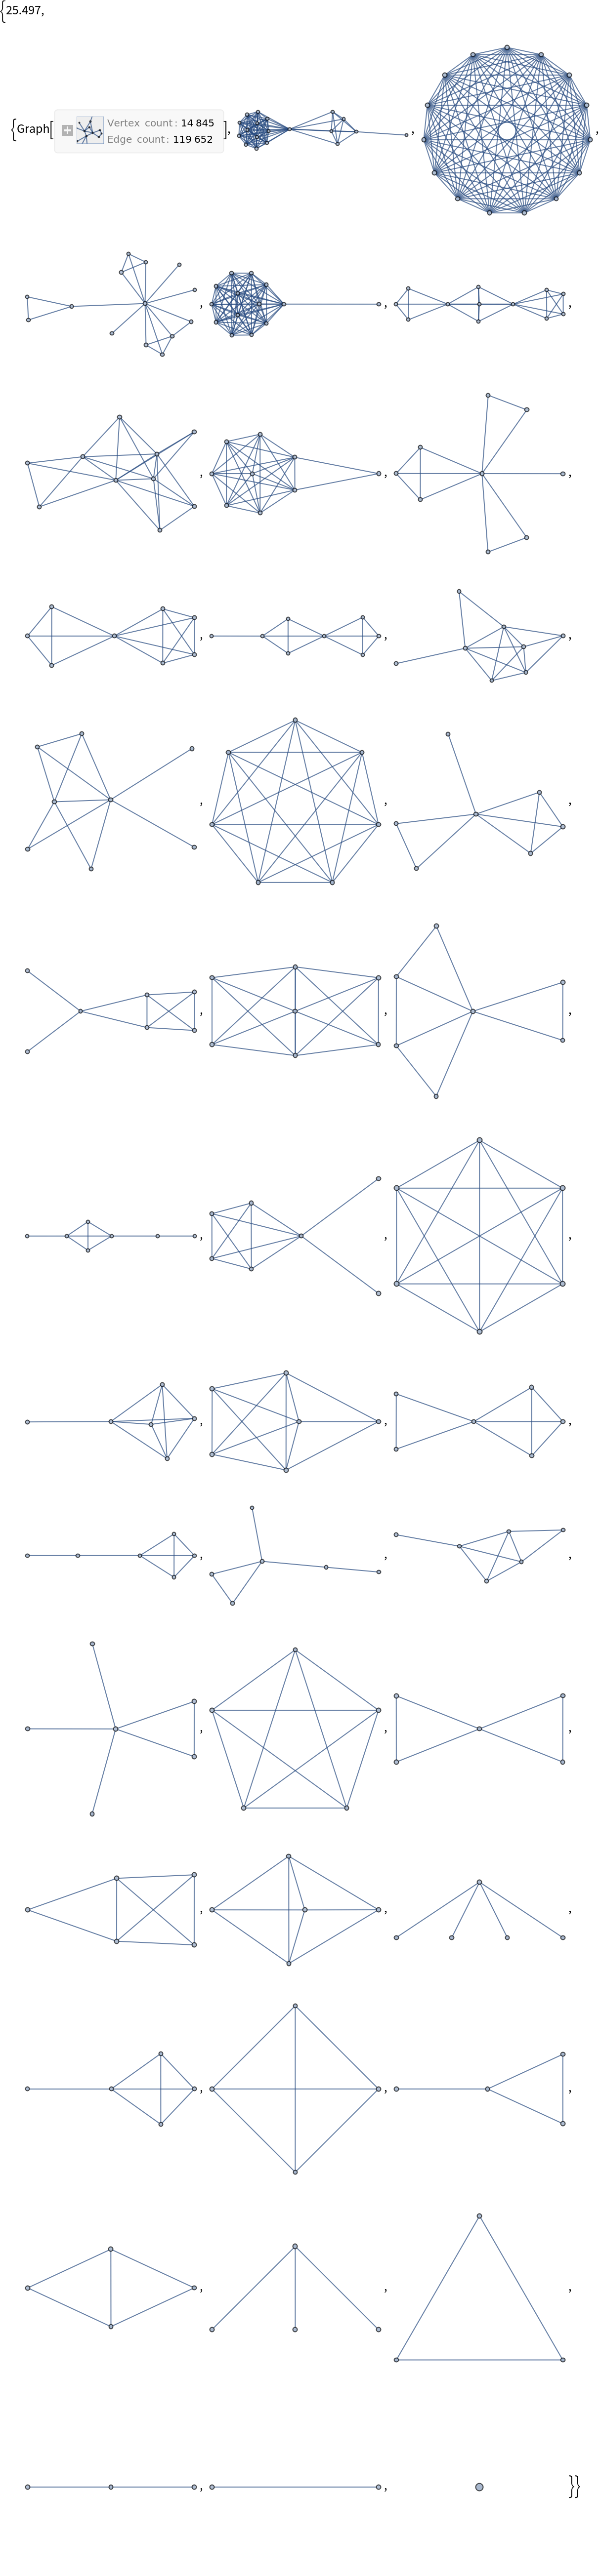 |
We can also identify the number of non-isomorphic components:
| In[11]:= |
| In[12]:= |
| Out[12]= |
Wolfram Language 13.0 (December 2021) or above
This work is licensed under a Creative Commons Attribution 4.0 International License