Wolfram Function Repository
Instant-use add-on functions for the Wolfram Language
Function Repository Resource:
Display different vertical axes for two plotted expressions
ResourceFunction["MultipleAxesPlot"][{expr1,expr2},{x,xmin,xmax}] generates a plot of expr1 and expr2 with two y-axes. |
Plot two functions with different scales:
| In[1]:= |
| Out[1]= | 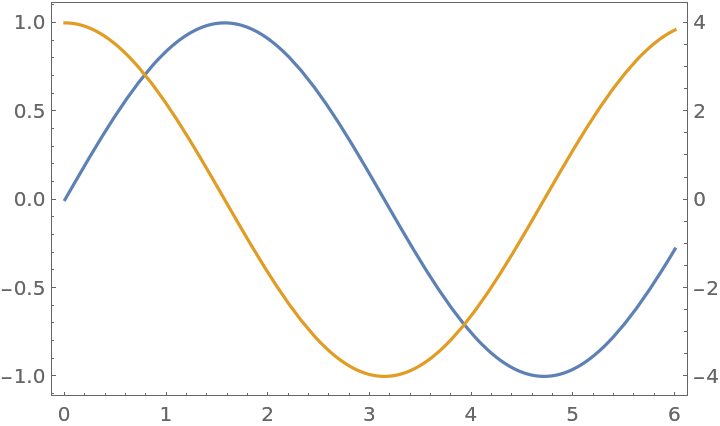 |
To make it clearer which axes refers to which line, you can use "SecondaryAxesColor":
| In[2]:= |
| Out[2]= | 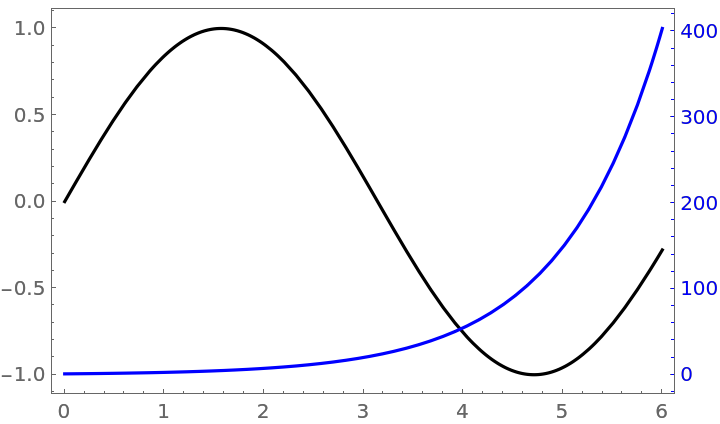 |
You can control the plot ranges of the two lines using PlotRange and "SecondaryPlotRange":
| In[3]:= |
| Out[3]= | 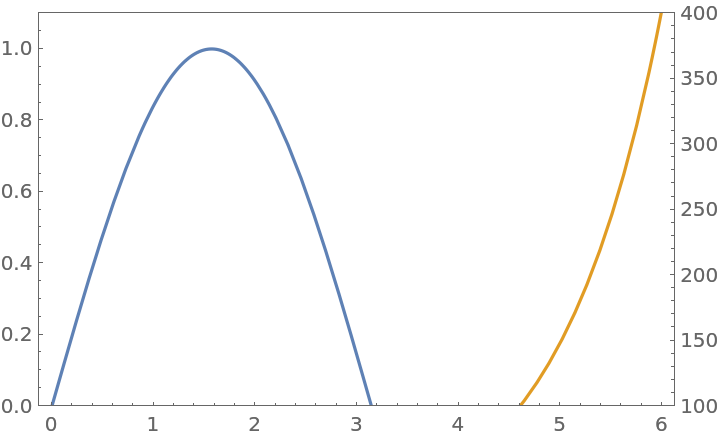 |
PlotRangePadding applies to both functions but uses the coordinate system of the first function:
| In[4]:= |
| Out[4]= | 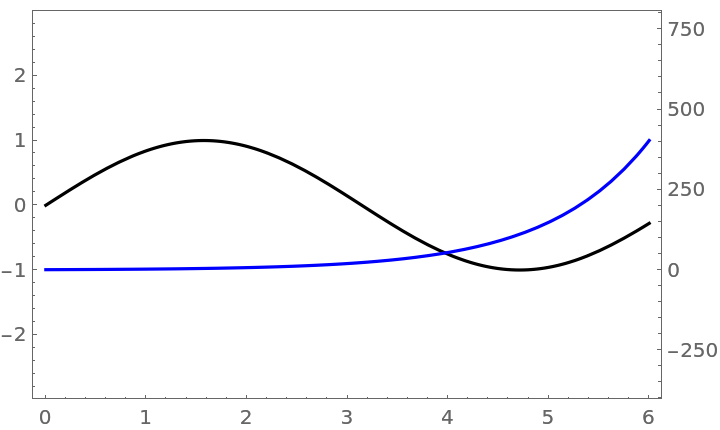 |
This work is licensed under a Creative Commons Attribution 4.0 International License