Wolfram Function Repository
Instant-use add-on functions for the Wolfram Language
Function Repository Resource:
Generate a graph corresponding to a triangular grid
ResourceFunction["TriangularLatticeGraph"][n] returns a triangular lattice graph with dimensions n×n. | |
ResourceFunction["TriangularLatticeGraph"][{rows,columns}] returns a triangular lattice graph with dimensions rows×columns. |
A 4×7 triangular grid graph:
| In[1]:= |
| Out[1]= | 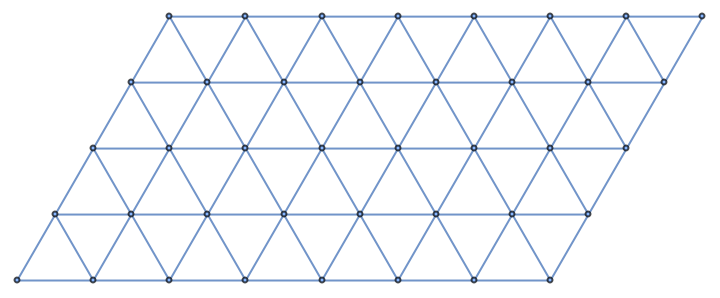 |
A triangular grid graph using only one argument:
| In[2]:= |
| Out[2]= | 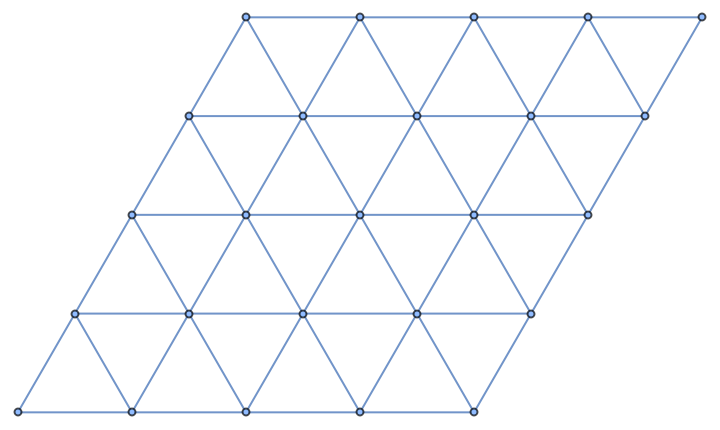 |
Use a non-default graph embedding:
| In[3]:= |
| Out[3]= | 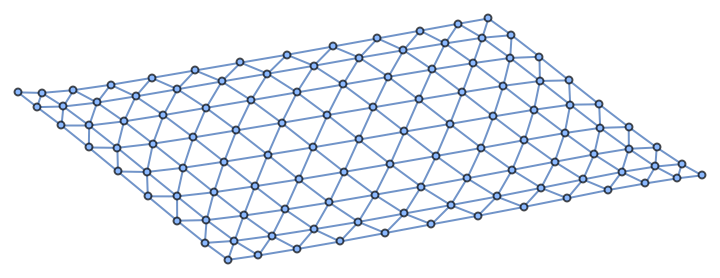 |
Use a different plot theme:
| In[4]:= |
| Out[4]= | 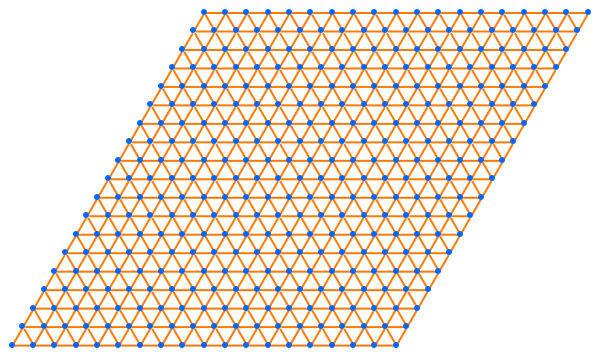 |
Make a (full) triangular grid graph with vertices that are the centers of a hexagonal graph:
| In[5]:= | ![g1 = ResourceFunction["HexagonalGridGraph"][{7, 4}];
g2 = ResourceFunction["TriangularLatticeGraph"][{3, 6}];
g2 = Graph[g2, VertexCoordinates -> Thread[VertexList[g2] -> Map[# + {Sqrt[3], 1} &, GraphEmbedding[g2]]]];
Show[g1, HighlightGraph[g2, g2]]](https://www.wolframcloud.com/obj/resourcesystem/images/79d/79d6e251-da5b-4e87-82e9-8325ede67c07/538f0252dc5b4f21.png) |
| Out[6]= | 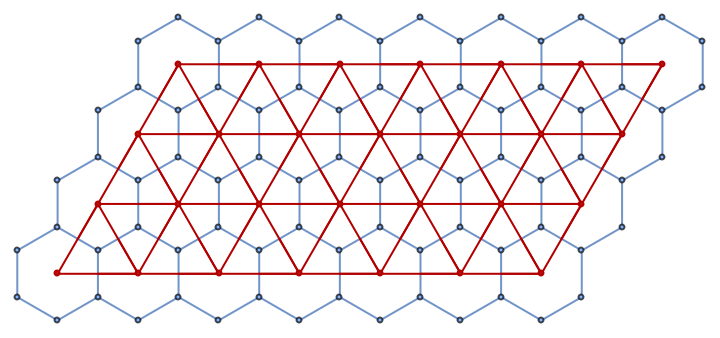 |
The resource function "HexagonalGridGraph" takes width and height as arguments whereas TriangularLatticeGraph takes rows and columns, which is more consistent with GridGraph:
| In[7]:= | ![Row[{ResourceFunction["HexagonalGridGraph"][{3, 6}], ResourceFunction["TriangularLatticeGraph"][{3, 6}], GridGraph[{3, 6}]}]](https://www.wolframcloud.com/obj/resourcesystem/images/79d/79d6e251-da5b-4e87-82e9-8325ede67c07/35eac089ec41e30b.png) |
| Out[7]= | 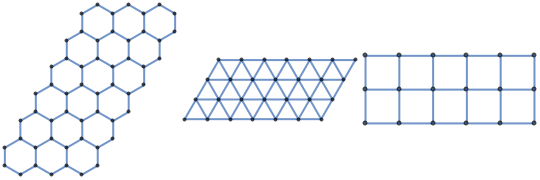 |
The resource function "TriangularGridGraph" takes only one argument for the graph size and makes triangle shaped graphs:
| In[8]:= |
| Out[8]= | 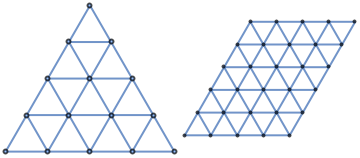 |
The mesh points of the Voronoi tessellation of the points of a triangular lattice graph contain the points of a hexagonal grid graph:
| In[9]:= | ![n = 10;
points = GraphEmbedding@ResourceFunction["TriangularLatticeGraph"][n];
\[ScriptCapitalR] = VoronoiMesh[points];
lines = MeshPrimitives[\[ScriptCapitalR], "Lines"];
Legended[
Graphics[{GrayLevel[0.7], lines, Red, Point@Map[# + 2*{Sqrt[3], 1} &, GraphEmbedding@
ResourceFunction["HexagonalGridGraph"][{n - 1, n - 1}]], Black, Point[points]}, ImageSize -> Large],
SwatchLegend[{GrayLevel[0.7], Red, Black}, {"Voronoi mesh", "Hexagonal grid graph embedding", "Triangular lattice graph embedding"}]]](https://www.wolframcloud.com/obj/resourcesystem/images/79d/79d6e251-da5b-4e87-82e9-8325ede67c07/2392ea3fde1ee7e7.png) |
| Out[13]= | 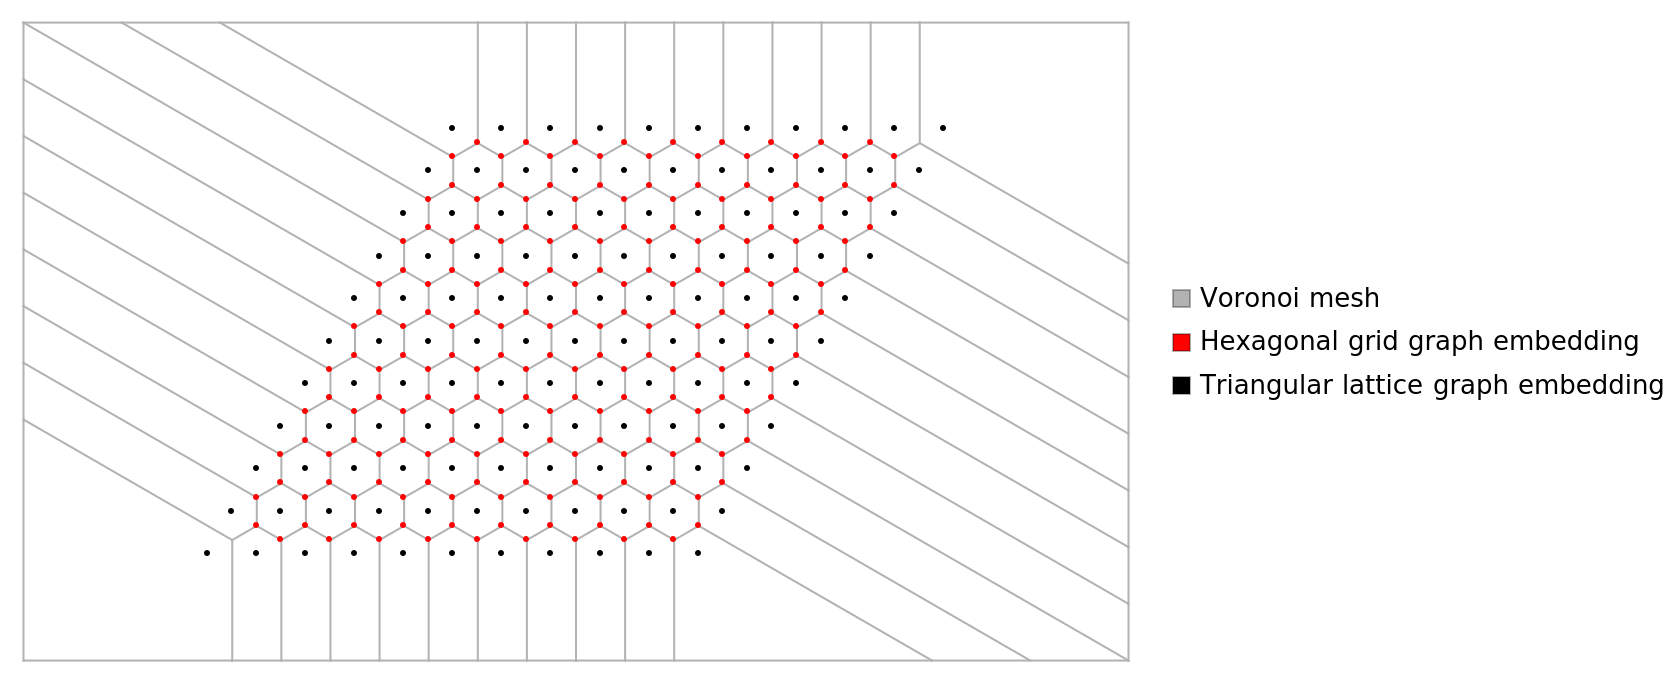 |
The opposite is also true:
| In[14]:= |
| Out[14]= | 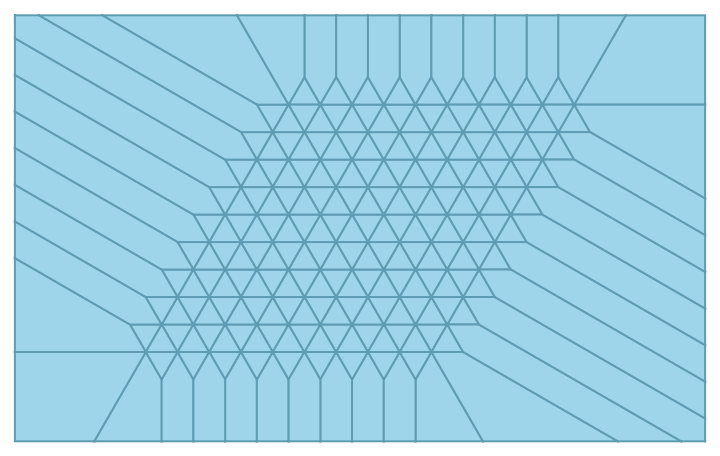 |
Large graphs may be formatted differently in OutputForm than smaller ones; this 50×60 sample shows all edges:
| In[15]:= |
| Out[15]= | 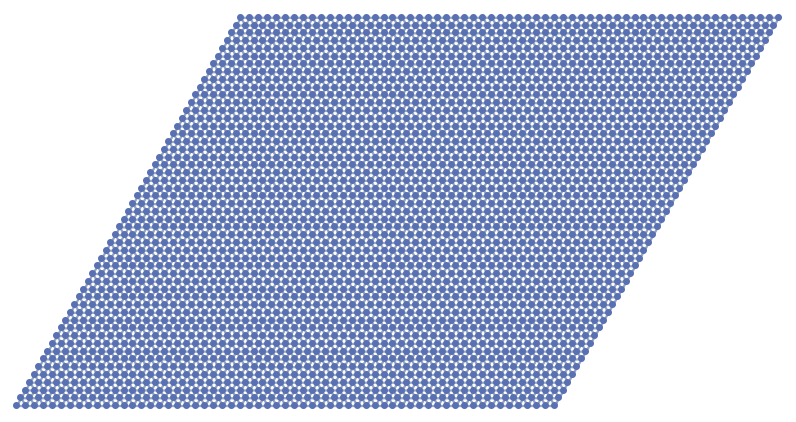 |
In contrast, this 60×60 triangular grid graph displays as an elided Graph expression:
| In[16]:= |
| Out[16]= |
Wolfram Language 12.3 (May 2021) or above
This work is licensed under a Creative Commons Attribution 4.0 International License