Wolfram Function Repository
Instant-use add-on functions for the Wolfram Language
Function Repository Resource:
A quantum cellular automaton model that evolves the tensor product of a collection of initial qubits using arbitrary compositions of unitary operators for a finite number of steps
ResourceFunction["QuantumTensorAutomaton"][matrices,initial,t] evolves initial for t steps using a composition of unitary matrices given by matrices. |


Define a "CNOT" operator:
| In[1]:= | ![CNOTOperator = SparseArray[{i_, j_} :> If[(IntegerDigits[j - 1, 2, 2] == {IntegerDigits[i - 1, 2, 2][[1]], Mod[-Total@IntegerDigits[i - 1, 2, 2], 2]}), 1, 0], {4, 4}];](https://www.wolframcloud.com/obj/resourcesystem/images/794/79492958-1ac4-462c-b3c0-cde45395c174/7838612b9d1b03e1.png) |
Apply the operator "CNOT" 10 times to an initial state:
| In[2]:= |
| Out[2]= |  |
Visualize the state vectors for the preceding:
| In[3]:= |
| Out[3]= |  |
Compute the probabilities (norms squared) for the preceding:
| In[4]:= |
| Out[4]= |  |
Plot the probabilities (norms squared) against the steps (time) for the preceding:
| In[5]:= |
| Out[5]= | 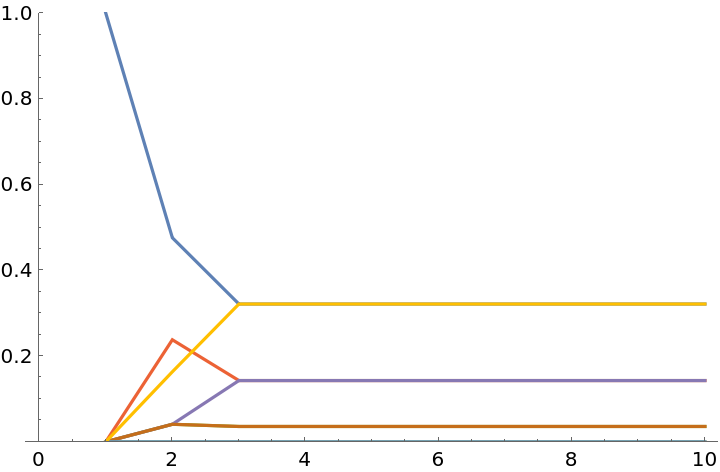 |
Define and compose multiple operators:
| In[6]:= | ![rootNOTOperator = MatrixPower[SparseArray[{{1, 2} -> 1, {2, 1} -> 1}], 1/2];
fourierOperator = SparseArray[({i_, j_} :> Exp[2*Pi*I*Mod[(i - 1)*(j - 1), 4]/4]/Sqrt[4]), {4, 4}];
ResourceFunction[
"QuantumTensorAutomaton"][{rootNOTOperator, fourierOperator}, initialState[3], 10, "ColourPlot" -> True]](https://www.wolframcloud.com/obj/resourcesystem/images/794/79492958-1ac4-462c-b3c0-cde45395c174/544fece51c1e55f0.png) |
| Out[6]= | 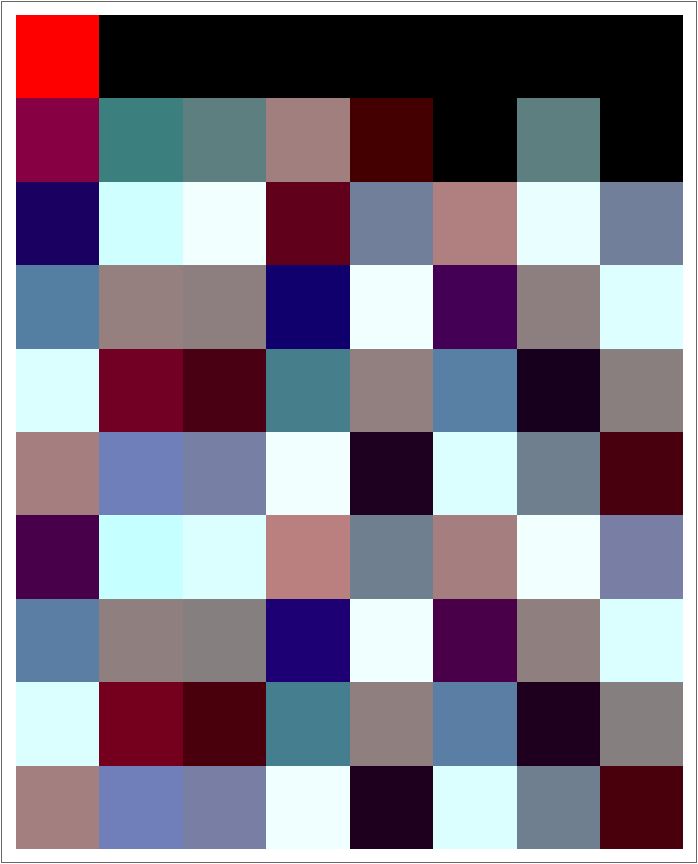 |
Random unitary operators will also work:
| In[7]:= | ![randomUnitaryOperator := Module[{randomReal, randomComplex},
randomReal := RandomReal[NormalDistribution[0, 1]];
randomComplex := randomReal + I*randomReal;
Orthogonalize[Table[randomComplex, 4, 4]]];
ResourceFunction["QuantumTensorAutomaton"][{randomUnitaryOperator}, initialState[4], 20, "ColourPlot" -> True]](https://www.wolframcloud.com/obj/resourcesystem/images/794/79492958-1ac4-462c-b3c0-cde45395c174/176a97e48afd93c1.png) |
| Out[7]= | 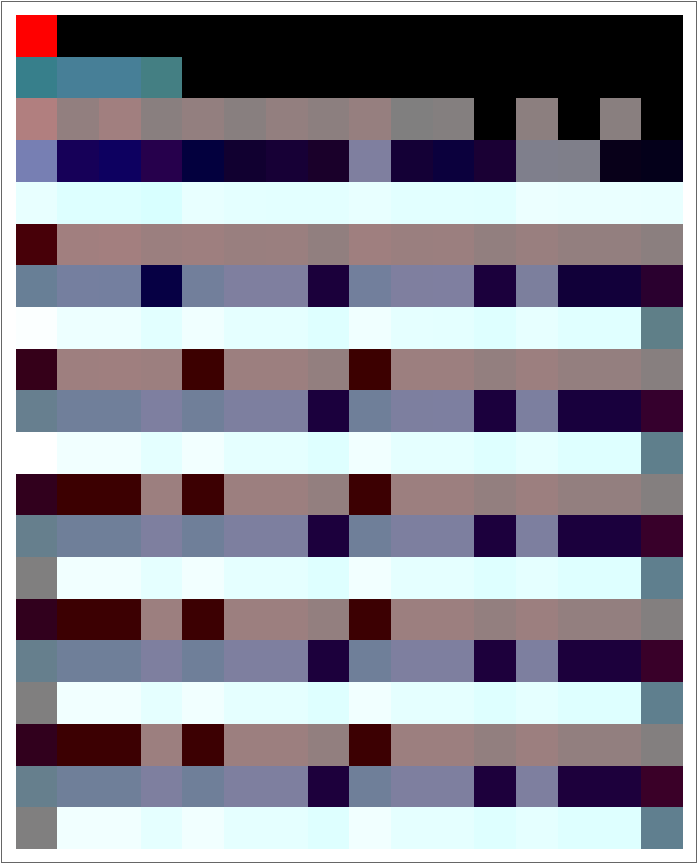 |
This work is licensed under a Creative Commons Attribution 4.0 International License
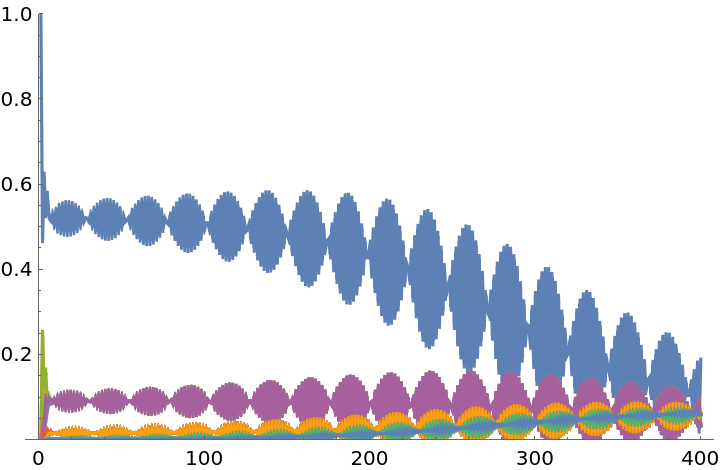
![resonantOperator = {{0.31074501689103284` + 0.30515668052168954` I, -0.07825046238247854` - 0.6548259330380204` I, 0.15586502550525036` - 0.23792222401422997` I, 0.5402029587275345` - 0.051736543125505546` I}, {-0.11992064793945865` + 0.7226460864976891` I, 0.14410467581259984` + 0.2607778162281067` I, 0.026795182600806336` - 0.0963989236419738` I, -0.10931330562716984` - 0.5938605154095694` I}, {-0.3018042479982458` - 0.11180781815111812` I, 0.2640232260964225` - 0.5326849405682591` I, -0.6175994303955813` + 0.2516898989211491` I, -0.10975792501914561` - 0.2934757811396617` I}, {0.10068802267951421` - 0.3999921704947729` I, 0.336505065324723` - 0.09803808807953789` I, 0.60870542737127` + 0.30625025044774` I, 0.010015864843047728` - 0.4925537830218997` I}}; ResourceFunction[
"QuantumTensorAutomaton"][{resonantOperator}, initialState[4], 400, "NormsPlot" -> True]](https://www.wolframcloud.com/obj/resourcesystem/images/794/79492958-1ac4-462c-b3c0-cde45395c174/41f6a7f3da75ab27.png)
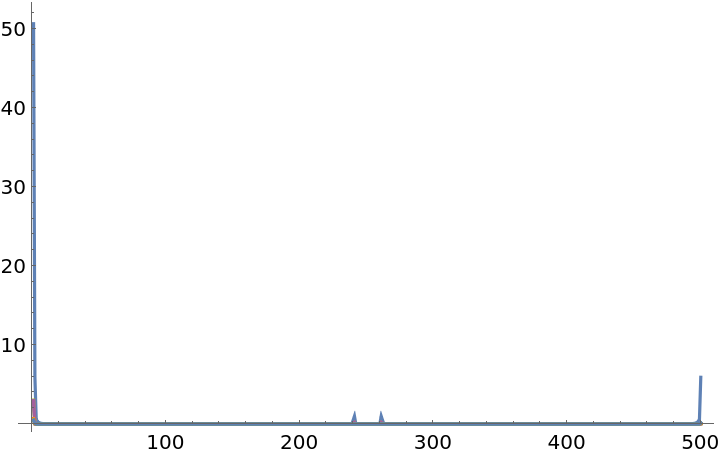
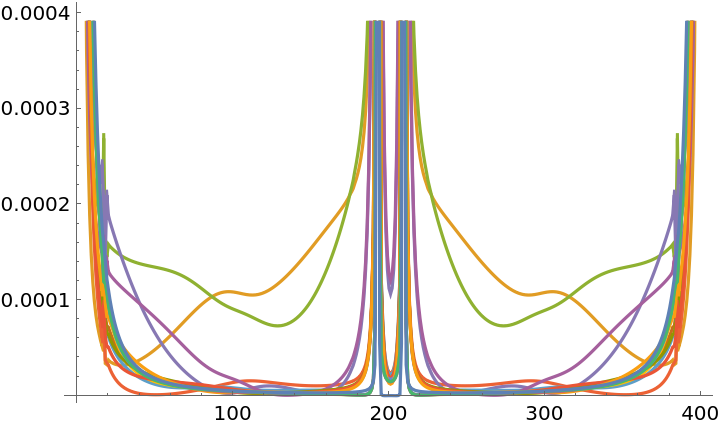
![ListLinePlot[
Map[Norm[#]^2 &, Fourier[#] & /@ Transpose[
ResourceFunction["QuantumTensorAutomaton"][{resonantOperator}, initialState[4], 400, "Norms" -> True]], {2}]]](https://www.wolframcloud.com/obj/resourcesystem/images/794/79492958-1ac4-462c-b3c0-cde45395c174/6a61e8afa564c048.png)
![ListLinePlot[
Map[Norm[#]^2 &, Fourier[#] & /@ Transpose[
ResourceFunction["QuantumTensorAutomaton"][{resonantOperator}, initialState[4], 500, "Norms" -> True]], {2}], PlotRange -> All]](https://www.wolframcloud.com/obj/resourcesystem/images/794/79492958-1ac4-462c-b3c0-cde45395c174/3e207bc9d3a5c464.png)