Wolfram Function Repository
Instant-use add-on functions for the Wolfram Language
Function Repository Resource:
Create a parametric plot of a curve in the plane with direction indicated by arrowheads and color
ResourceFunction["DirectionParametricPlot"][{fx,fy},{t,tmin,tmax}] generates a parametric plot of a curve {fx,fy} whose x- and y-coordinates fx and fy are functions of t and with the direction of the curve indicated by color and arrowheads. |
A curve with direction indicated by color and arrowheads:
| In[1]:= |
| Out[1]= | 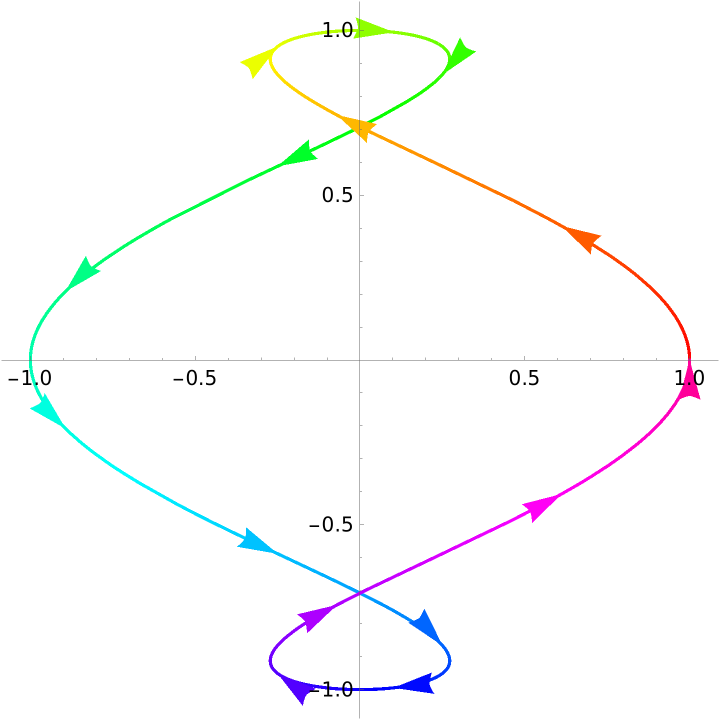 |
The option "ArrowSize"→1 corresponds (roughly) to the default "ArrowSize"→Large:
| In[2]:= |
| Out[2]= | 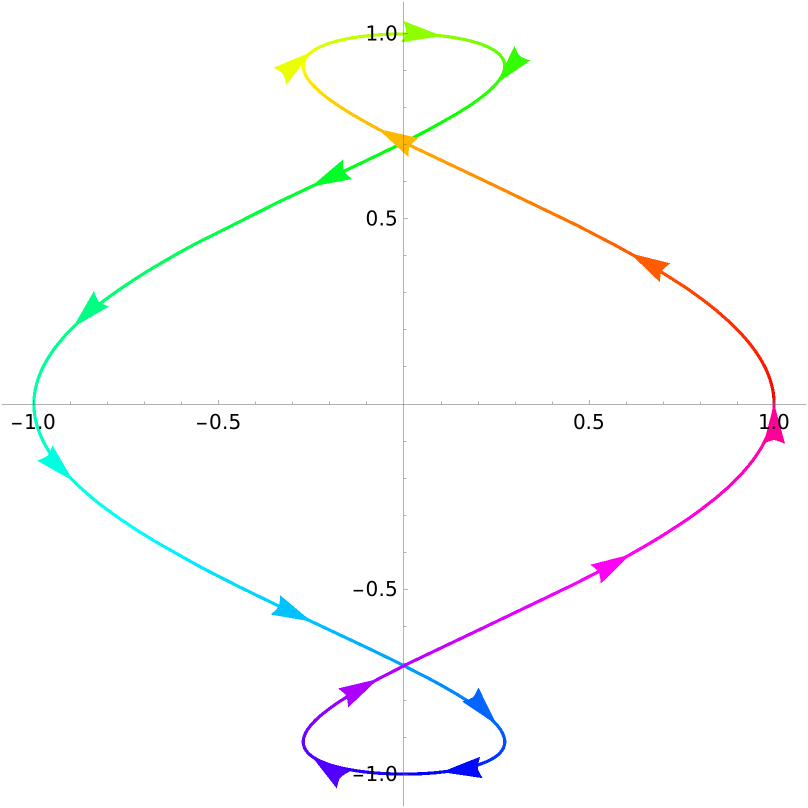 |
The same curve with smaller arrowheads:
| In[3]:= |
| Out[3]= | 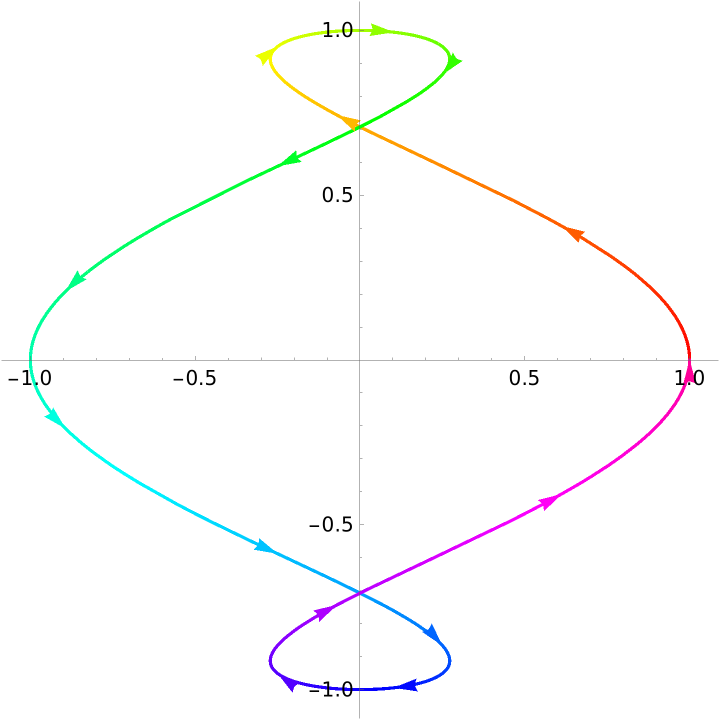 |
Plot more arrowheads:
| In[4]:= |
| Out[4]= | 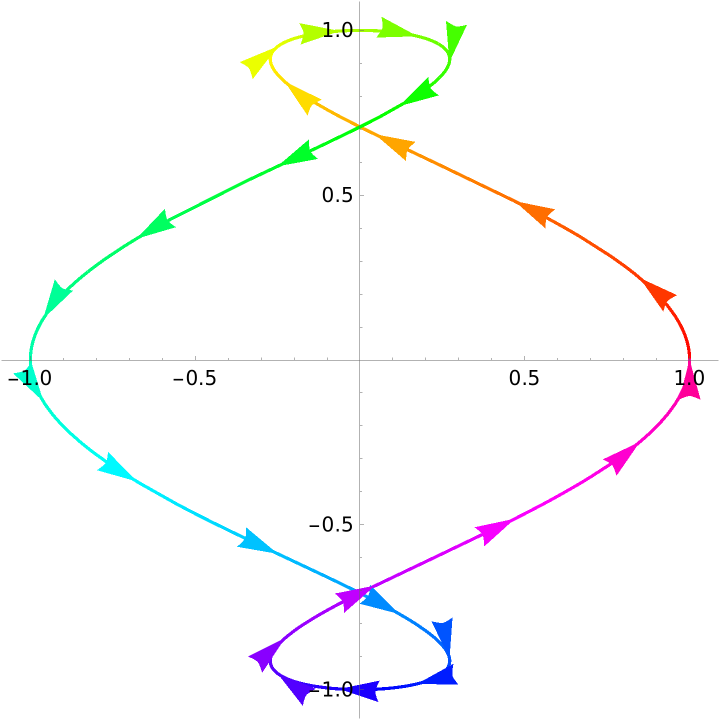 |
Suppress the arrowheads by setting "ArrowNumber" to zero:
| In[5]:= |
| Out[5]= |  |
Suppress the arrowheads:
| In[6]:= |
| Out[6]= | 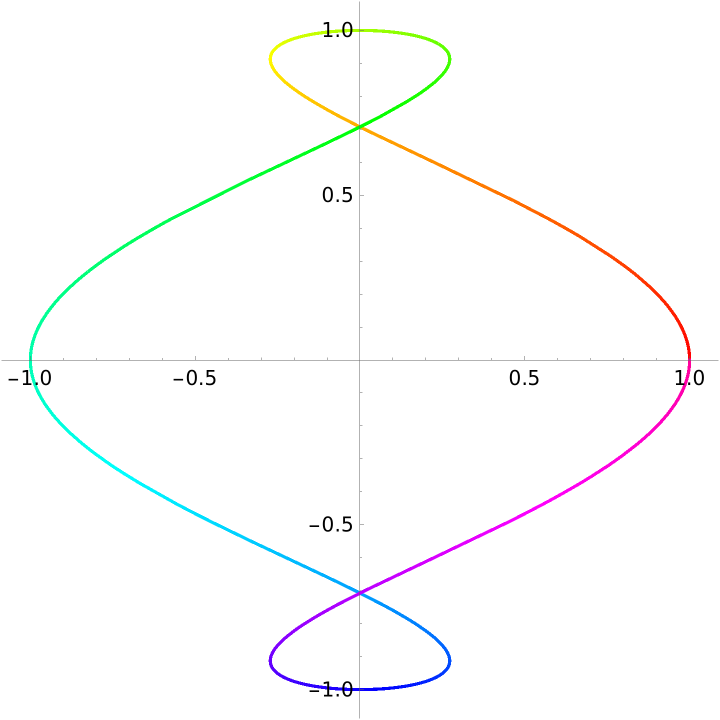 |
Setting PlotStyle to a color plots the curve in that color:
| In[7]:= |
| Out[7]= | 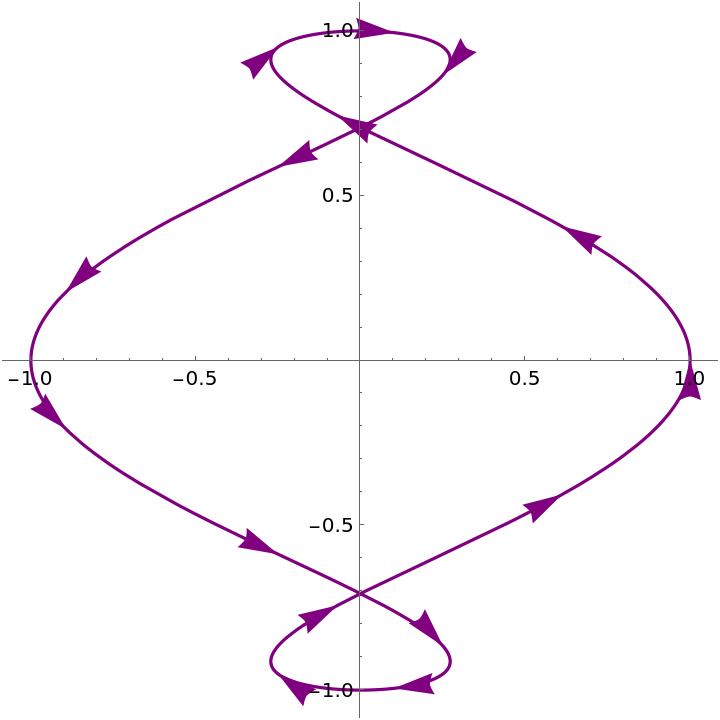 |
Plot two curves with a different style as well as a different size arrowhead for each curve:
| In[8]:= |
| Out[8]= | 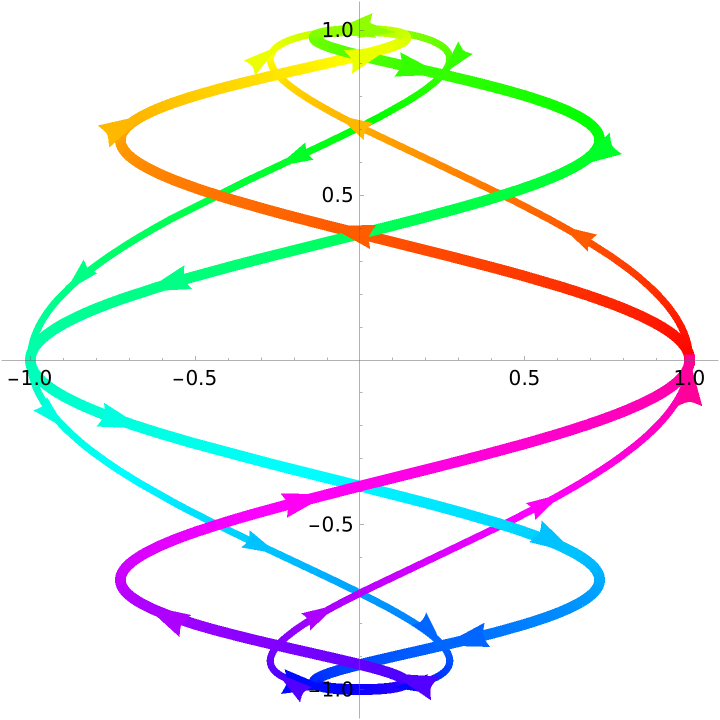 |
Other settings for PlotStyle will not affect the automatic coloring:
| In[9]:= |
| Out[9]= | 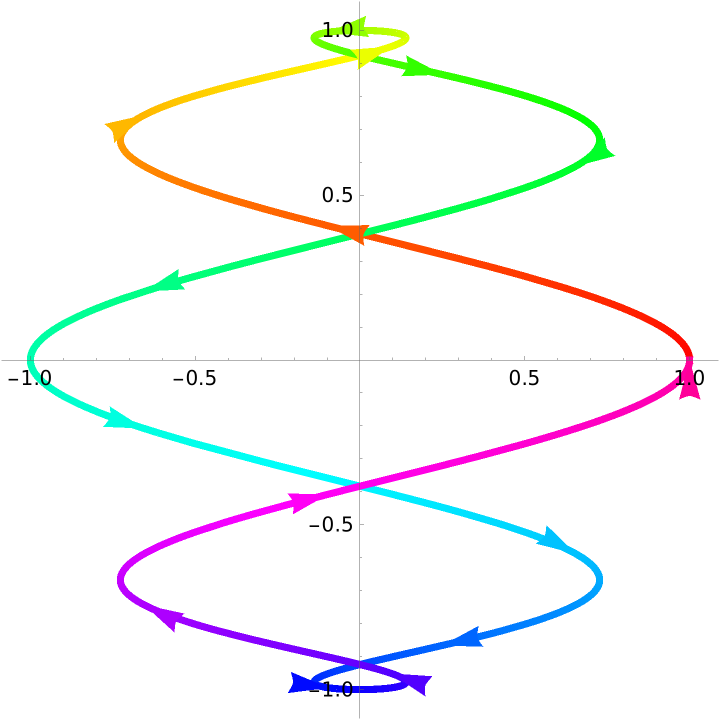 |
For multiple curves, if just one style is specified, it is applied to both curves:
| In[10]:= |
| Out[10]= | 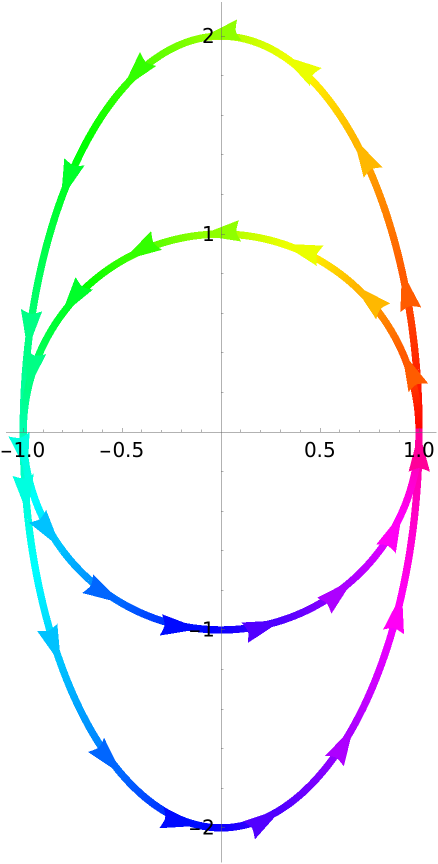 |
Change the color function:
| In[11]:= |
| Out[11]= | 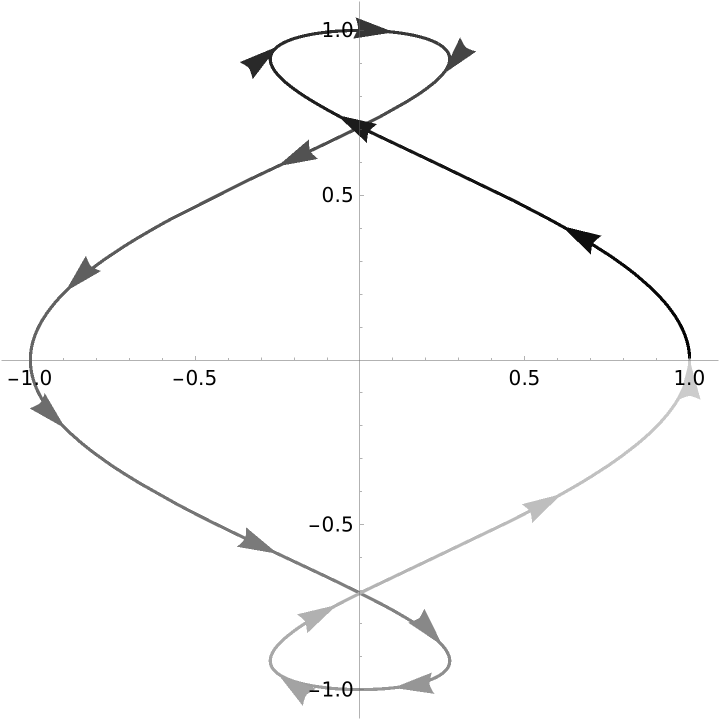 |
Since PlotLegends depends on the color of the curve, they will not work unless ColorFunction is set to None or the specifications for PlotStyle contain a color:
| In[12]:= |
| Out[12]= | 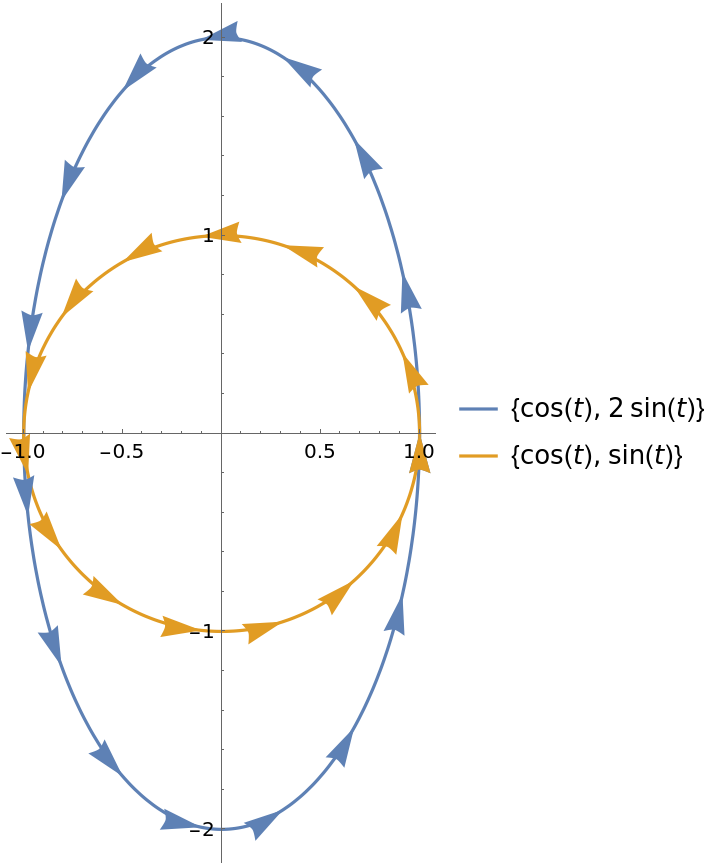 |
| In[13]:= |
| Out[13]= | 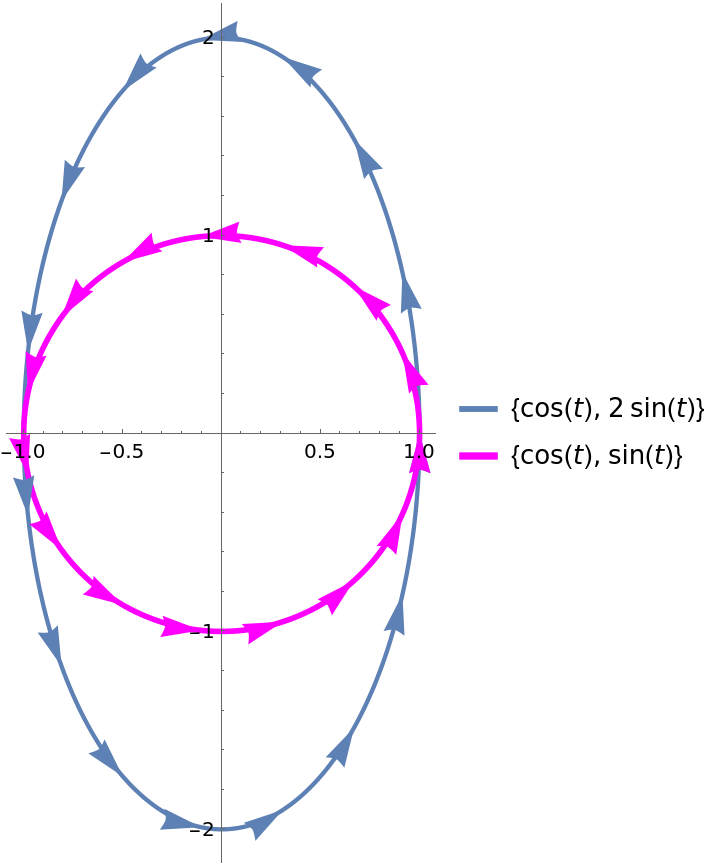 |
Without DirectionParametricPlot, it is difficult to tell how the curve is traced out:
| In[14]:= |
| Out[14]= | 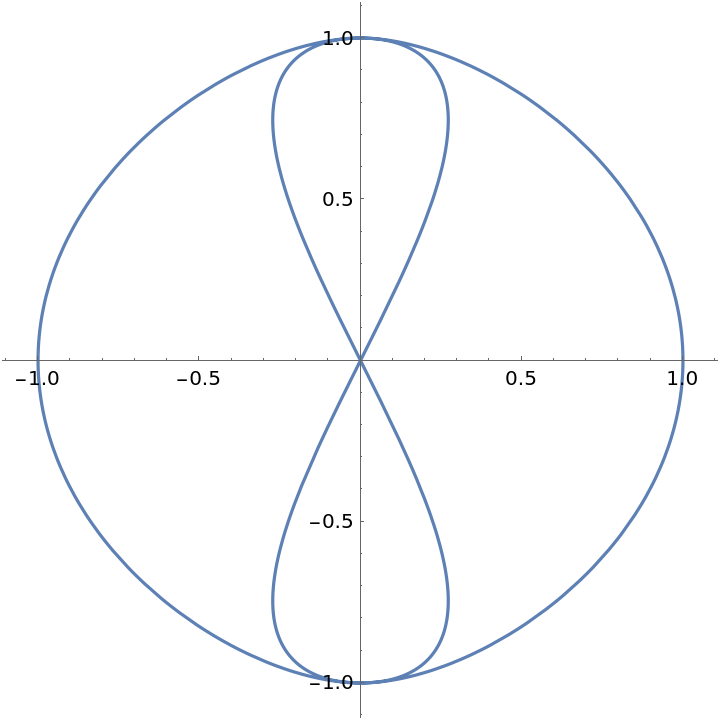 |
Using DirectionParametricPlot, it is easy to see how the curve is traced out:
| In[15]:= |
| Out[15]= | 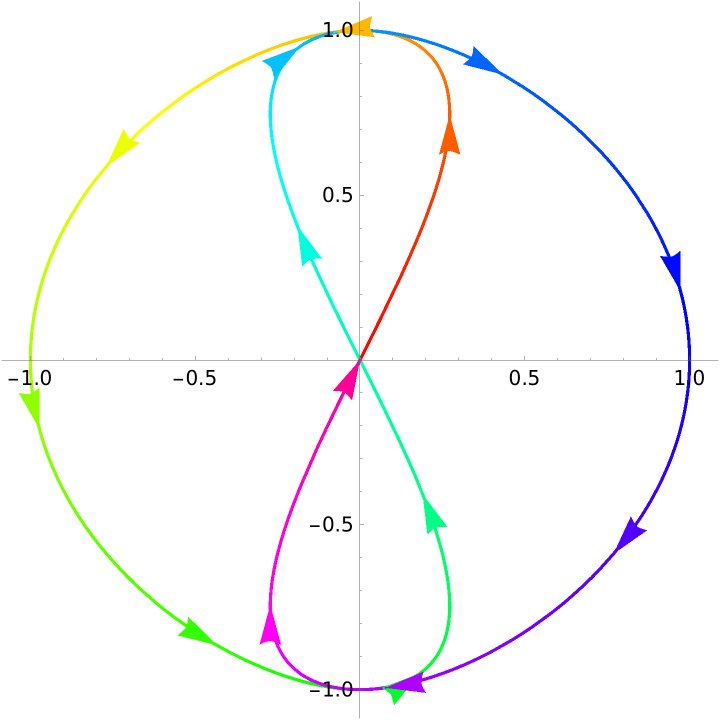 |
This work is licensed under a Creative Commons Attribution 4.0 International License