Wolfram Function Repository
Instant-use add-on functions for the Wolfram Language
Function Repository Resource:
Make an animated bar chart race
ResourceFunction["BarChartRace"][{data1,data2.…},{label1,label2.…}] makes an animated bar chart race from the datai with corresponding labels labeli, with the top 10 rankings shown. | |
ResourceFunction["BarChartRace"][{data1,data2.…},{label1,label2.…},k] shows the top k rankings. |
| "InterpolatingFrames" | 22 | the number of bar charts interpolating between datai and datai+1 |
Show a few frames from a bar chart race:
| In[1]:= |
| Out[1]= | 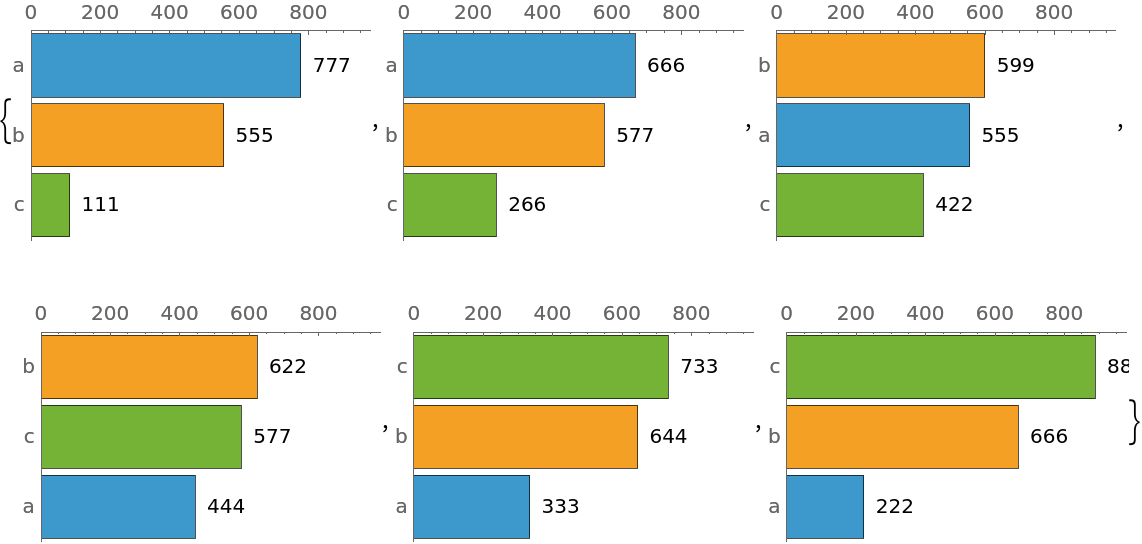 |
Animate a bar chart race with ListAnimate:
| In[2]:= | ![ListAnimate[
ResourceFunction[
"BarChartRace"][{{777, 555, 111}, {222, 666, 888}}, {"a", "b", "c"}],
AnimationRepetitions -> 1,
AnimationRunning -> False,
AppearanceElements -> "ResetButton"]](https://www.wolframcloud.com/obj/resourcesystem/images/6ec/6eca5852-1b79-49cb-b14d-272a8b5fea15/61c384793422d8ea.png) |
| Out[2]= | 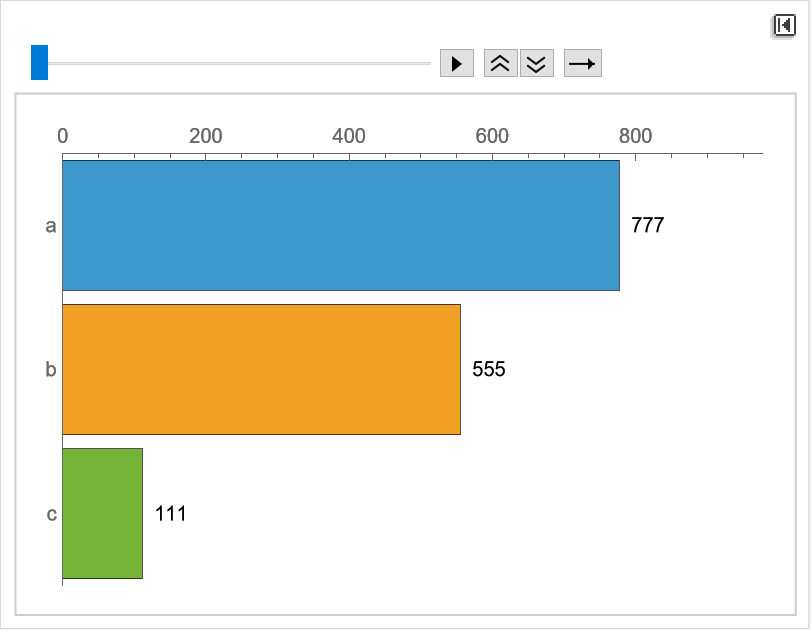 |
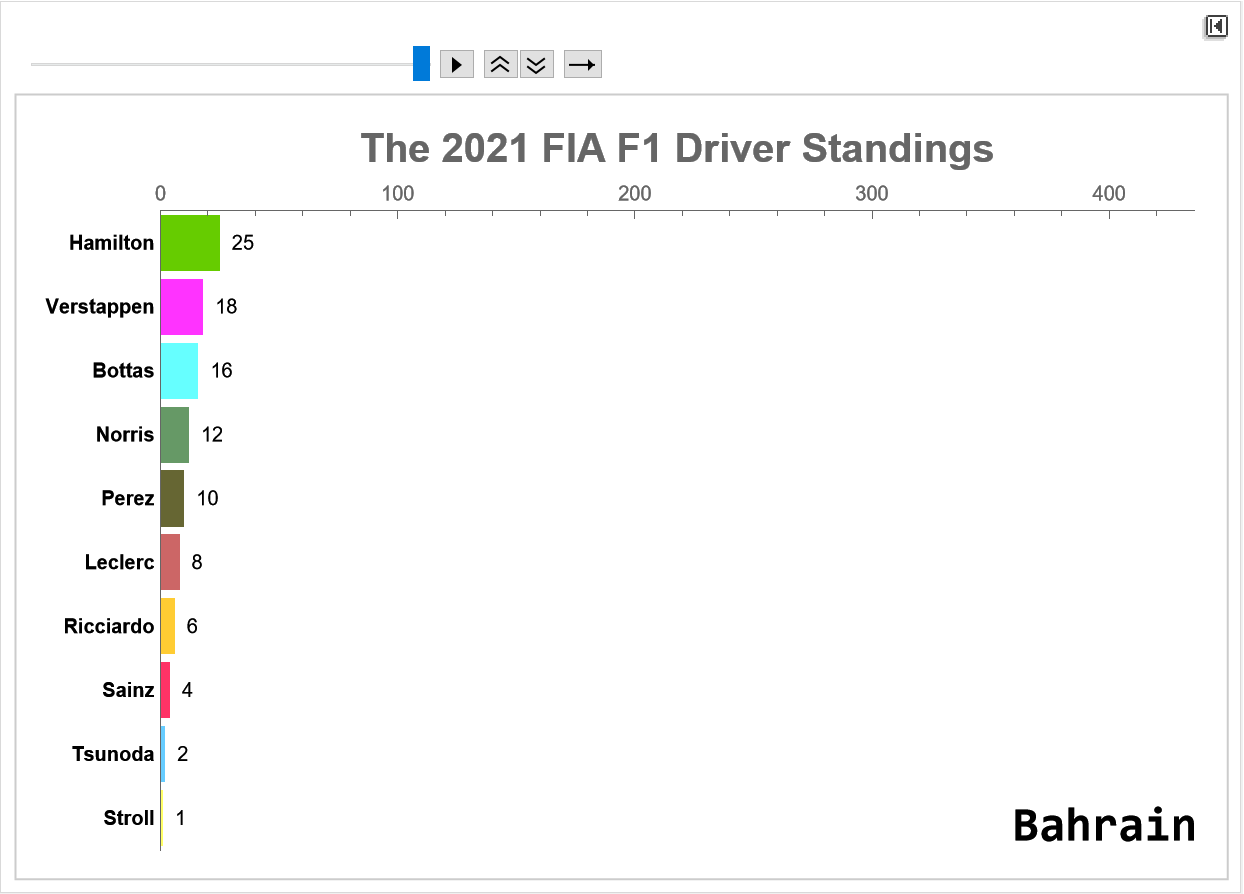
The 2021 FIA F1 World Championship was contested over twenty-two Grand Prix races, and held around the world. Drivers competed for the titles of World Drivers' Champion. Visualize the rankings over time as bar charts:
| In[3]:= |
| In[4]:= |
| In[5]:= | ![(* Display the top 10 *)
interpolatingframes = 22; (*default*)
bc = ResourceFunction["BarChartRace"][itemData, itemLabels, 10,
"InterpolatingFrames" -> interpolatingframes,
ChartStyle -> {
RGBColor[1., 0.2, 1.],
RGBColor[0.4, 0.8, 0.],
RGBColor[0.4, 1., 1.],
RGBColor[0.4, 0.4, 0.2],
RGBColor[1., 0.2, 0.4],
RGBColor[0.4, 0.6, 0.4],
RGBColor[0.8, 0.4, 0.4],
RGBColor[1., 0.8, 0.2],
RGBColor[1., 0.6, 1.],
RGBColor[0.4, 0., 0.6],
RGBColor[1., 0.4, 0.6],
RGBColor[0.6, 1., 0.6],
RGBColor[1., 1., 0.4],
RGBColor[0.4, 0.8, 1.],
RGBColor[0.6, 0.8, 0.8],
RGBColor[0.4, 0.6, 1.],
RGBColor[0.6, 1., 0.2],
RGBColor[1., 0.4, 0.],
RGBColor[1., 1., 0.8],
RGBColor[0.2, 0.4, 0.6],
RGBColor[0.6, 0.2, 0.4]},
ChartBaseStyle -> EdgeForm[Transparent],
FrameLabel -> {{None, None}, {None, Style["The 2021 FIA F1 Driver Standings", 20, Bold]}}, ImageSize -> Large];](https://www.wolframcloud.com/obj/resourcesystem/images/6ec/6eca5852-1b79-49cb-b14d-272a8b5fea15/4981d7072290458d.png) |
| In[6]:= | ![(* Display the locations *)
locations = Style[#, 24, Bold, Black] & /@ f1y2021[[1, 2 ;;]];
bc2 = Table[
Overlay[{bc[[i]], locations[[Ceiling[i/(interpolatingframes + 2)] + 1]]}, Alignment -> {Right, Bottom}], {i, 1, Length@bc}];
bc2[[1]] = Overlay[{bc[[1]], locations[[1]]}, Alignment -> {Right, Bottom}];](https://www.wolframcloud.com/obj/resourcesystem/images/6ec/6eca5852-1b79-49cb-b14d-272a8b5fea15/24077b120cd42d6c.png) |
| In[7]:= | ![(* Animate *)
ListAnimate[bc2,
AnimationRepetitions -> 1, AnimationRunning -> False, AppearanceElements -> "ResetButton"]](https://www.wolframcloud.com/obj/resourcesystem/images/6ec/6eca5852-1b79-49cb-b14d-272a8b5fea15/6ddb17f4ff4be467.png) |
This work is licensed under a Creative Commons Attribution 4.0 International License