Wolfram Function Repository
Instant-use add-on functions for the Wolfram Language
Function Repository Resource:
Represent the result of evolution of a Wolfram model
ResourceFunction["WolframModelEvolutionObject"][…][t] gives the state of a Wolfram model evolution after t generations. | |
ResourceFunction["WolframModelEvolutionObject"][…][prop] gives the specified property of a Wolfram Model evolution object. | |
ResourceFunction["WolframModelEvolutionObject"][…][prop,opts] uses the specified options for the result. |
| t | the state at generation t |
| -t | the state t generations from the end |
| "StatesList" | the list of states for each complete generation |
| "StatesPlotsList" | list of plots of states |
| "FinalState" | the final state only |
| "FinalStatePlot" | plot of final state |
| "AllEventsStatesList" | the list of all states after all updating events |
| "AllEventsList" | the list of all updating events during the evolution |
| "AllEventsRuleIndices" | list of indices of transformation rules used during the evolution |
| "EventsStatesList" | the list of successive events and states during the evolution |
| "EventsStatesPlotsList" | list of plots of successive states with each event highlighted |
| "AllEventsEdgesList" | the list of all edges in the order they are generated by events |
| "EdgeCreatorEventIndices" | the indices of the updating event that creates each edge |
| "EdgeDestroyerEventIndices" | the indices of the updating event that destroys each edge |
| "VertexCountList" | the list of vertex counts for each complete generation |
| "EdgeCountList" | the list of edge counts for each complete generation |
| "GenerationsCount" | the number of complete and partial generations |
| "GenerationEventsCountList" | the number of events between successive generations |
| "GenerationEventsList" | the list of events between successive generations |
| "EdgeGenerationsList" | which generation each edge is associated with |
| "EventGenerationsList" | which generation each event is associated with |
| "AllEventsCount" | the total number of events in the evolution |
| "CausalGraph" | the causal graph for the evolution |
| "LayeredCausalGraph" | the causal graph rendered in layered form |
| "Rules" | the underlying rules for the Wolfram model system |
| "TerminationReason" | why the evolution was stopped |
| "MaxEvents" | maximum number of events reached |
| "MaxGenerations" | maximum number of generations reached |
| "MaxVertices" | maximum number of hypergraph vertices reached |
| "MaxEdges" | maximum number of hypergraph edges reached |
| "MaxVertexDegree" | maximum degree of any vertex reached |
| "FixedPoint" | rule does not have any more matches |
| "TimeConstraint" | specified execution time reached |
| "Aborted" | externally aborted |
| IncludePartialGenerations | True | whether to include data on incomplete generations |
| IncludeBoundaryEvents | None | whether to include boundary events in properties like "CausalGraph" |
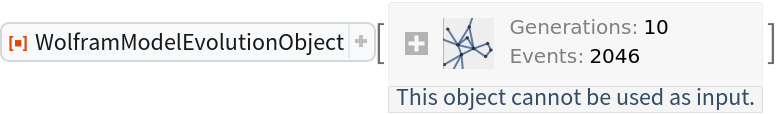
Create an evolution object:
| In[1]:= |
|
| Out[1]= |
|
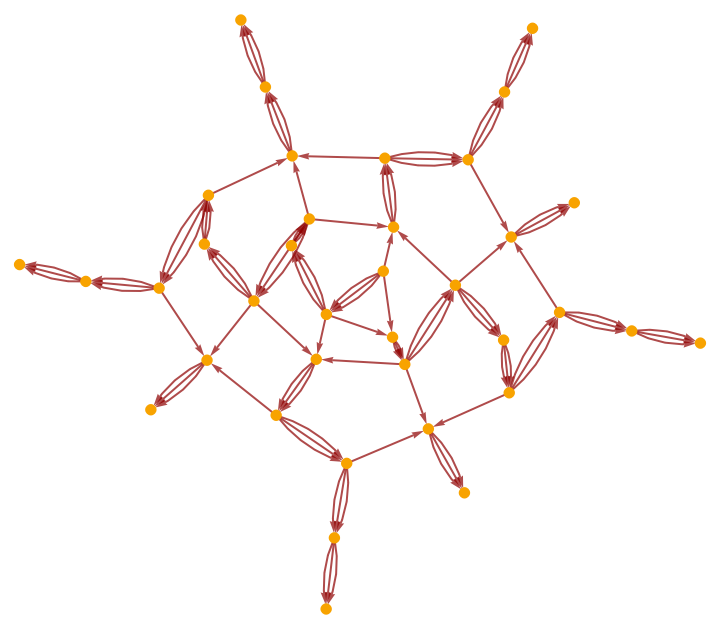
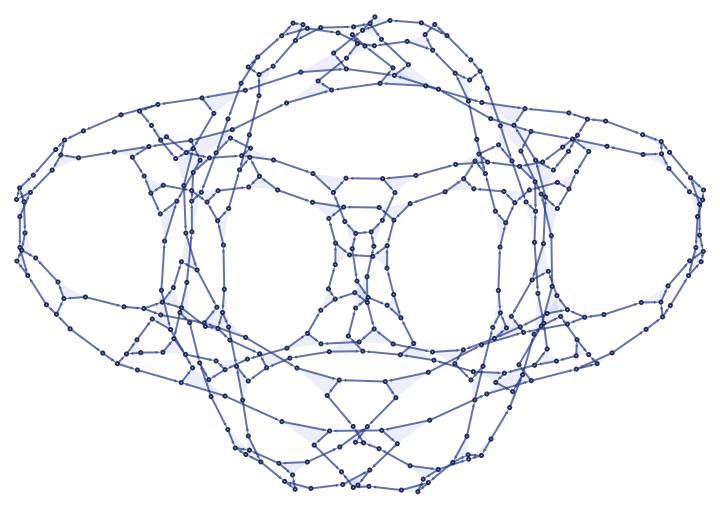
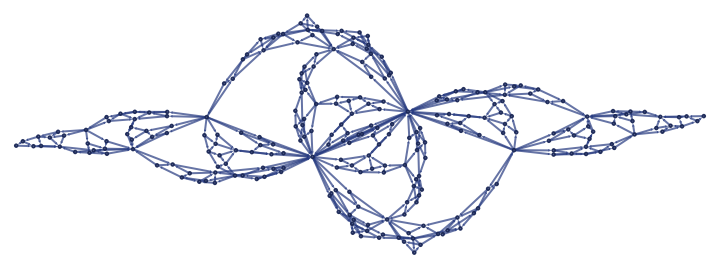
Get the plot of the final state:
| In[2]:= |
|
| Out[2]= |
|
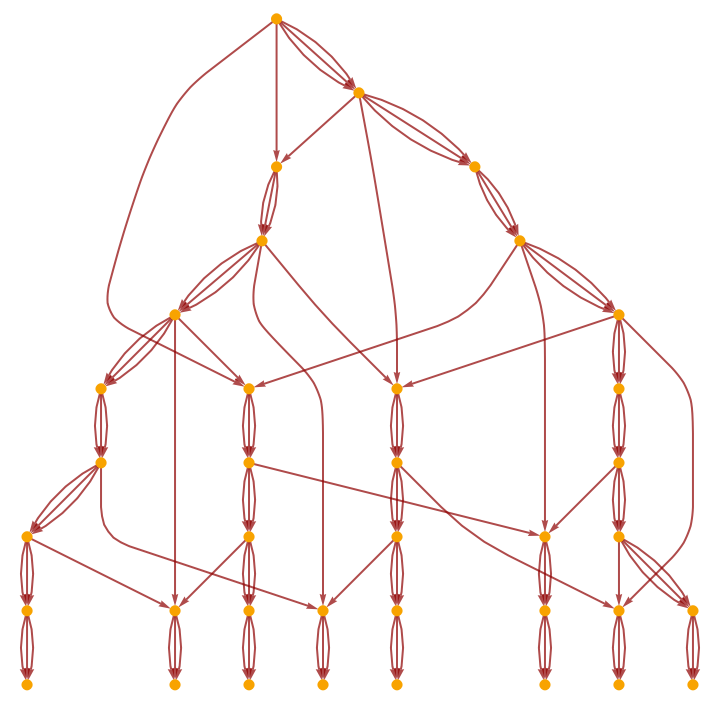
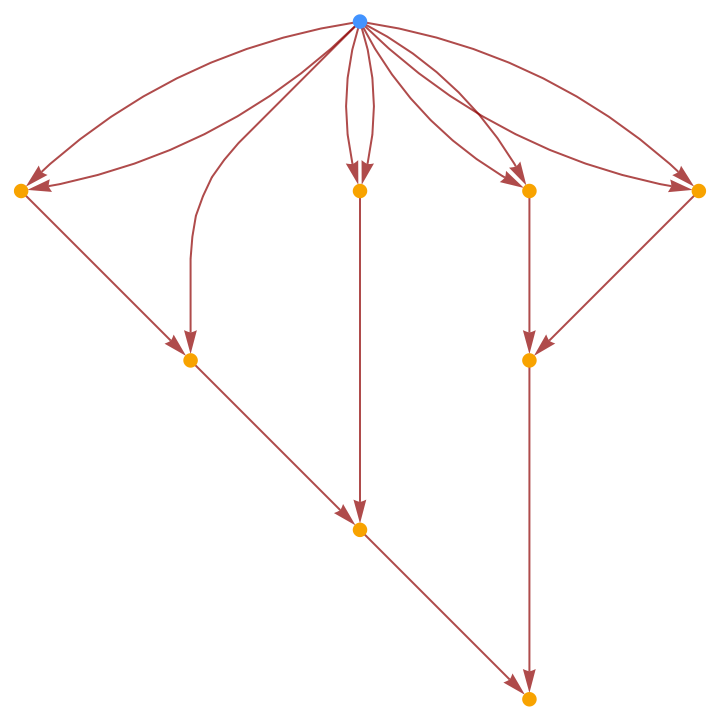
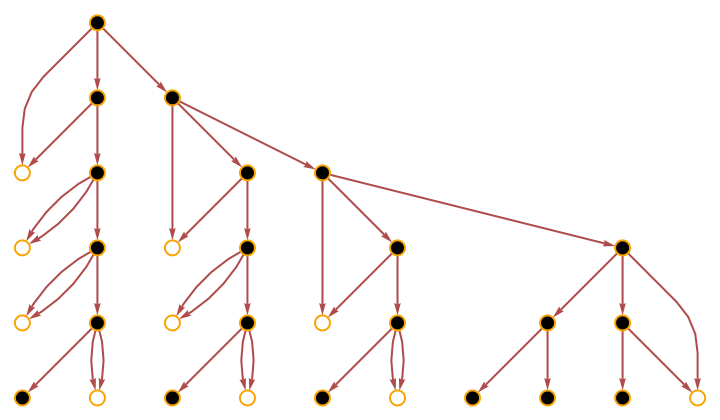
Make a causal graph for the same evolution:
| In[3]:= |
|
| Out[3]= |
|
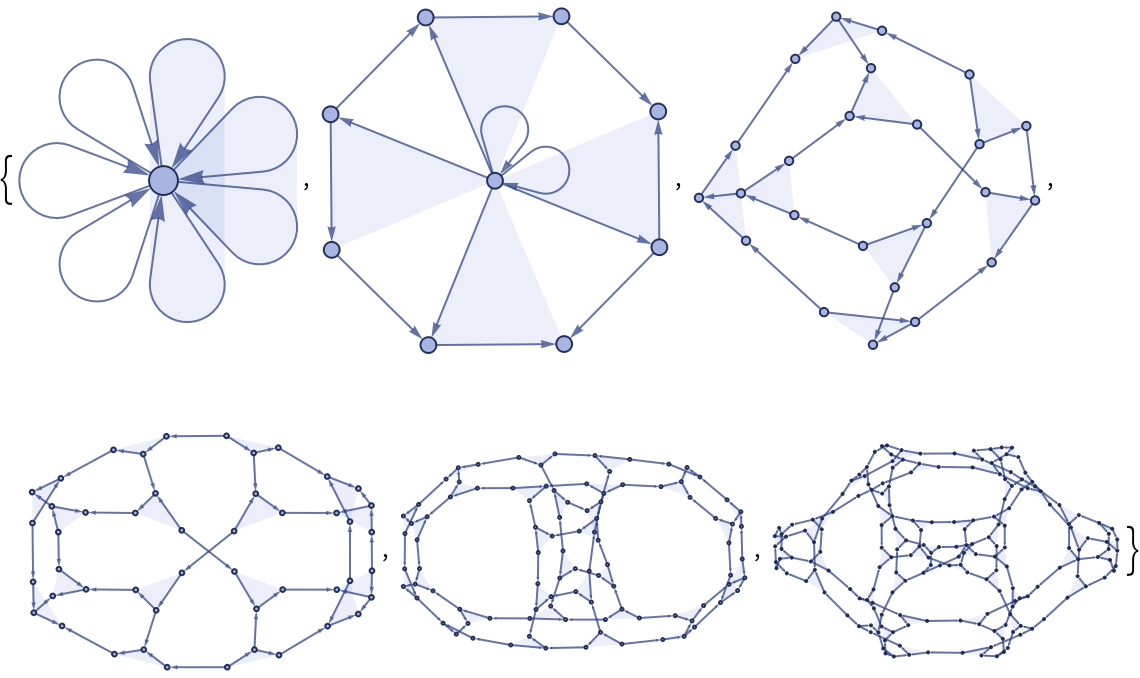
"StatesList" yields the list of states at each generation:
| In[4]:= |
|
| Out[4]= |
|
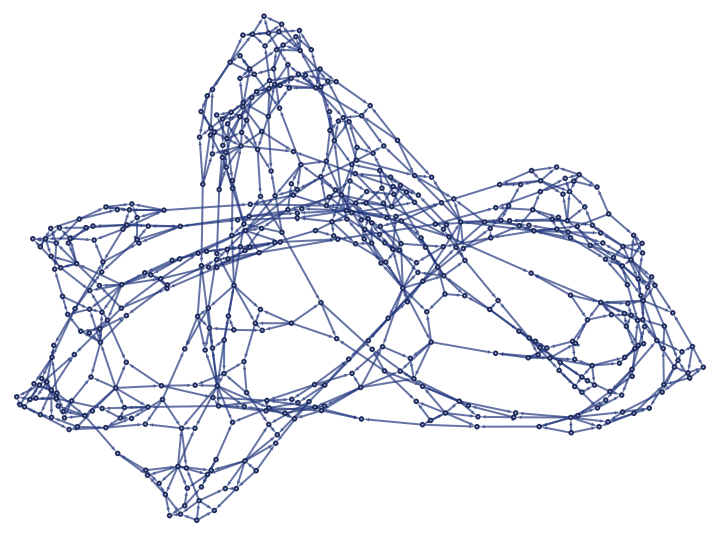
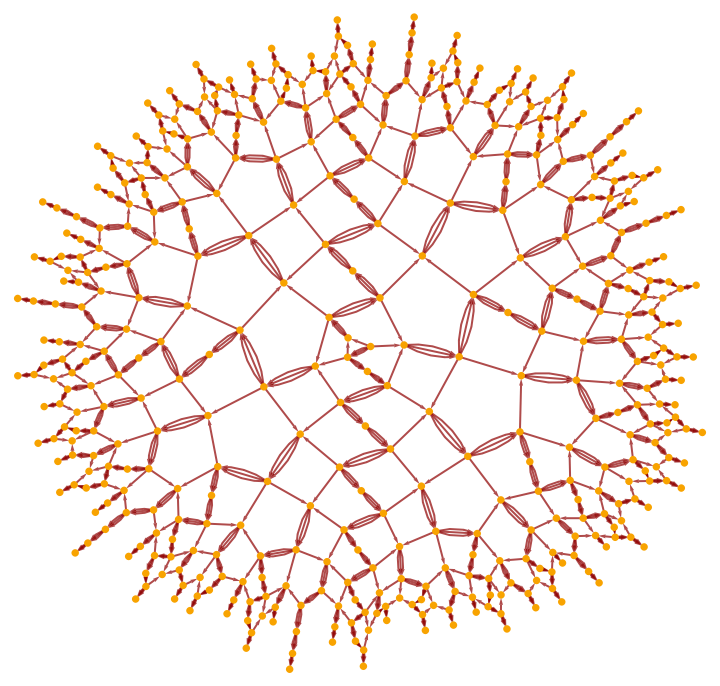
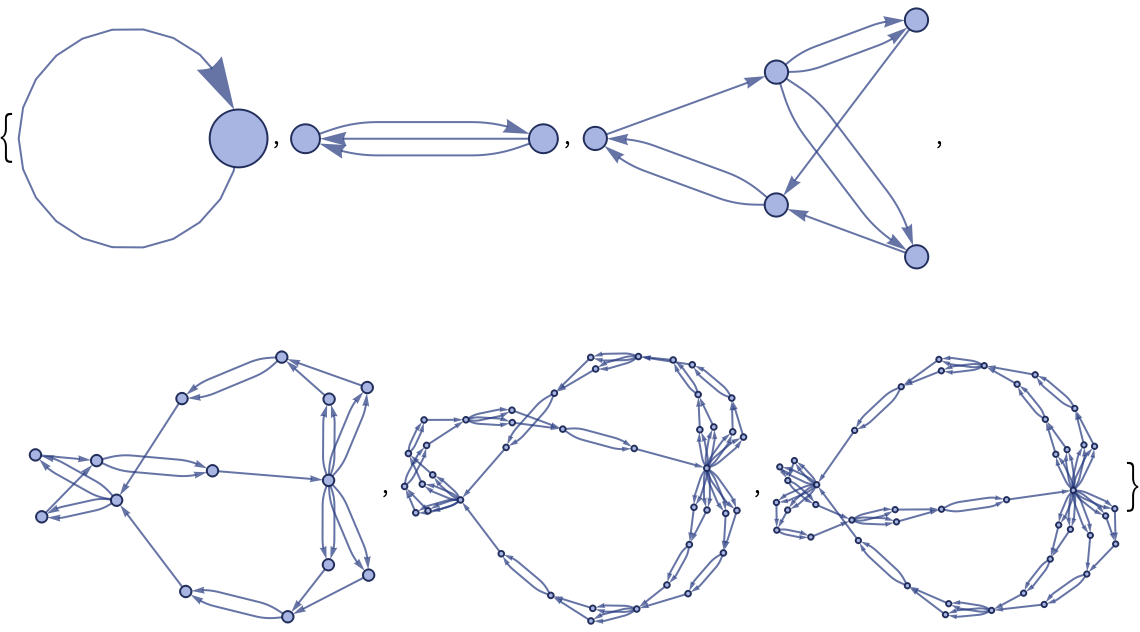
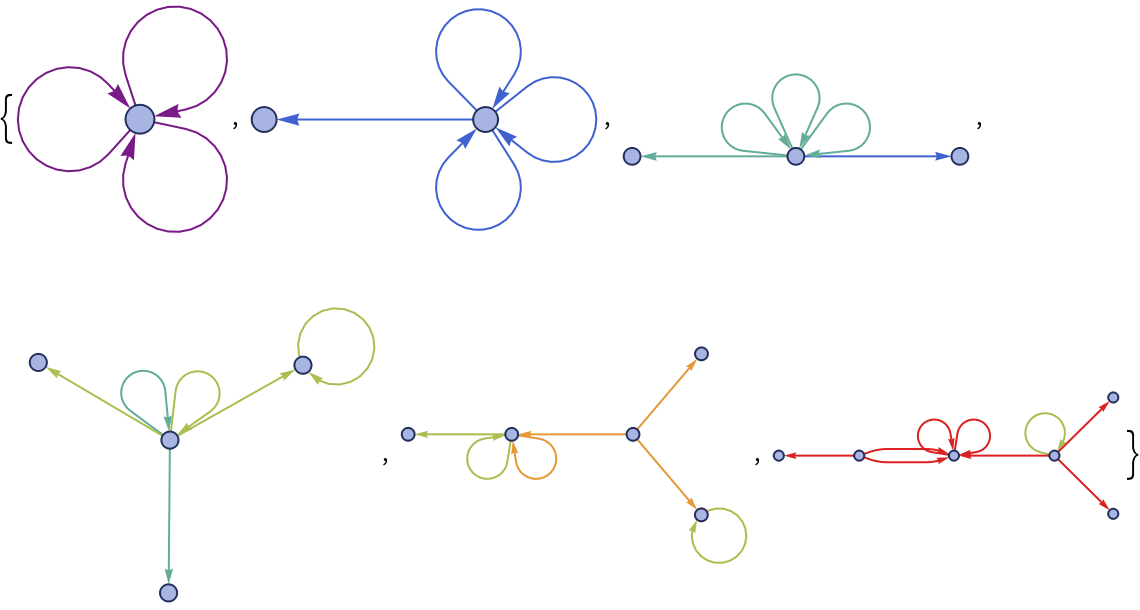
Make the list of plots of all states:
| In[5]:= |
|
| Out[5]= |
|
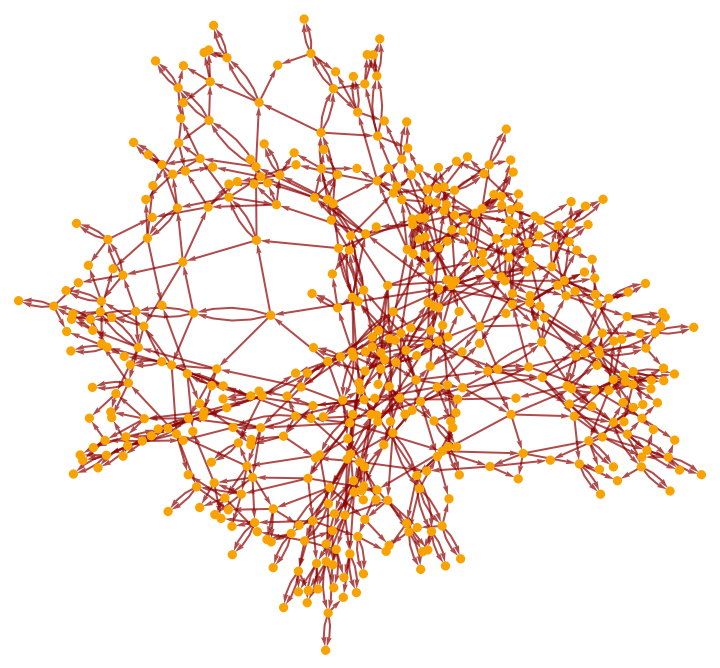
"FinalState" yields the state obtained after all replacements of the evolution have been made:
| In[6]:= |
|
| Out[6]= |
|
Make the plot of the final state:
| In[7]:= |
|
| Out[7]= |
|
"StatesList" shows a compressed version of the evolution. To see how state changes with each applied replacement, use "AllEventsStatesList":
| In[8]:= |
|
| Out[8]= |
|
"AllEventsList" returns all replacement events throughout the evolution:
| In[9]:= |
|
| Out[9]= |
|
"AllEventsRuleIndices" returns which rule was used for each event:
| In[10]:= |
|
| Out[10]= |
|
"EventsStatesList" just produces a list of {event,state} pairs, where state is the complete state right after this event is applied:
| In[11]:= |
![(* Evaluate this cell to get the example input *) CloudGet["https://www.wolframcloud.com/obj/5198dc2d-3b9c-4652-a032-4b20e85d3402"]](https://www.wolframcloud.com/obj/resourcesystem/images/677/6779fb11-c2ca-451a-92ed-8a9e73d747d9/448232a7096f9258.png)
|
| Out[11]= |

|
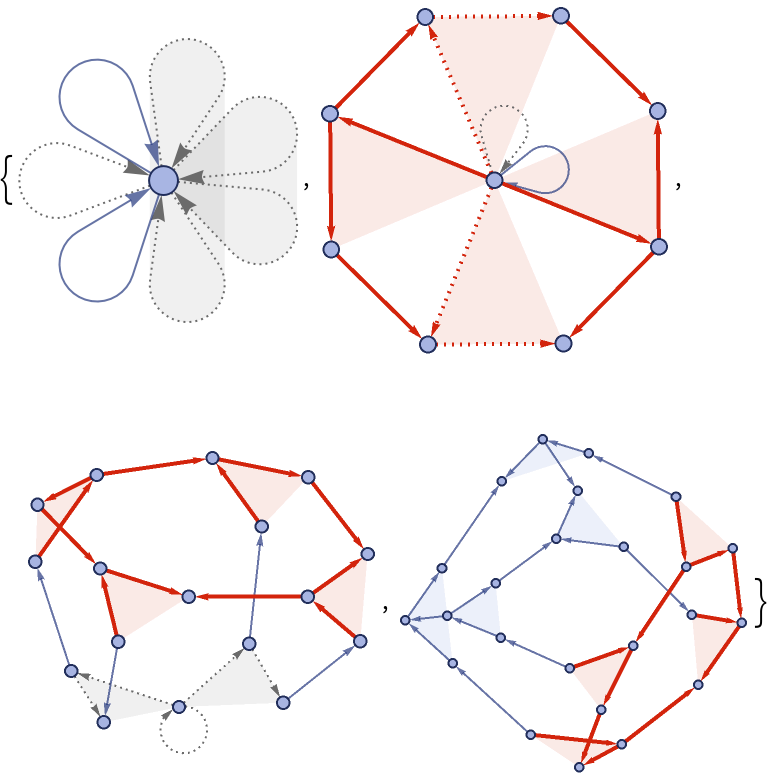
"EventsStatesPlotsList" plots not only the states, but also the events that produced them:
| In[12]:= |
|
| Out[12]= |
|
"AllEventsEdgesList" returns the list of edges throughout evolution:
| In[13]:= |
|
| Out[13]= |
|
Get creator and destroyer events for each edge throughout the evolution:
| In[14]:= |
![(* Evaluate this cell to get the example input *) CloudGet["https://www.wolframcloud.com/obj/3e295914-103e-4d6b-9a73-2bef0e062c82"]](https://www.wolframcloud.com/obj/resourcesystem/images/677/6779fb11-c2ca-451a-92ed-8a9e73d747d9/51ed73a17754d1f5.png)
|
| Out[14]= |
|
"VertexCountList" and "EdgeCountList" return counts of vertices and edges respectively in each state of "StatesList":
| In[15]:= |
![(* Evaluate this cell to get the example input *) CloudGet["https://www.wolframcloud.com/obj/4868fb76-ef90-4422-ba6a-f13bfc1326f8"]](https://www.wolframcloud.com/obj/resourcesystem/images/677/6779fb11-c2ca-451a-92ed-8a9e73d747d9/7e34f43737880132.png)
|
| Out[15]= |
|
"GenerationsCount" returns both complete and partial generations count:
| In[16]:= |
|
| Out[16]= |
|
"GenerationEventsCountList" gives the number of events per each generation:
| In[17]:= |
|
| Out[17]= |
|
"GenerationEventsList" returns the same list of events, but splits them into sublists for each generation:
| In[18]:= |
![(* Evaluate this cell to get the example input *) CloudGet["https://www.wolframcloud.com/obj/ff635f3d-91c2-40a4-bb02-7a61ee08d99e"]](https://www.wolframcloud.com/obj/resourcesystem/images/677/6779fb11-c2ca-451a-92ed-8a9e73d747d9/38faf78e22a68c6a.png)
|
| Out[18]= |
|
"EdgeGenerationsList" yields the list of generation numbers for each edge in "AllEventsEdgesList":
| In[19]:= |
|
| Out[19]= |
|
"EventsGenerationsList" gives the same for events:
| In[20]:= |
|
| Out[20]= |
|
"AllEventsCount" returns the overall number of events throughout the evolution:
| In[21]:= |
|
| Out[21]= |
|
Get a causal graph for an evolution:
| In[22]:= |
|
| Out[22]= |
|
The causal graph can be layered putting events from each generation on a different level:
| In[23]:= |
|
| Out[23]= |
|
Drop partial generations from the evolution:
| In[24]:= |
![(* Evaluate this cell to get the example input *) CloudGet["https://www.wolframcloud.com/obj/d4cd4d87-a166-4426-a4c0-09f236440b52"]](https://www.wolframcloud.com/obj/resourcesystem/images/677/6779fb11-c2ca-451a-92ed-8a9e73d747d9/6329166d738162e5.png)
|
| Out[24]= |

|
If partial generations were not dropped, there would be one more element in the plots list:
| In[25]:= |
|
| Out[25]= |
|
Include the initial event in a causal graph:
| In[26]:= |
![(* Evaluate this cell to get the example input *) CloudGet["https://www.wolframcloud.com/obj/57a6d5d0-85bc-49a7-a1b1-1d41b79407ce"]](https://www.wolframcloud.com/obj/resourcesystem/images/677/6779fb11-c2ca-451a-92ed-8a9e73d747d9/2874feeb811c90ce.png)
|
| Out[26]= |
|
Include both the final event in the list of events:
| In[27]:= |
![(* Evaluate this cell to get the example input *) CloudGet["https://www.wolframcloud.com/obj/98162ac0-fa49-4ec5-bf7a-f04c436f46bc"]](https://www.wolframcloud.com/obj/resourcesystem/images/677/6779fb11-c2ca-451a-92ed-8a9e73d747d9/44ed21182b9f41a3.png)
|
| Out[27]= |
|
Include both the initial and the final events in "EventsStatesList":
| In[28]:= |
![(* Evaluate this cell to get the example input *) CloudGet["https://www.wolframcloud.com/obj/4ee4523f-2271-4403-a2b6-d981d012d518"]](https://www.wolframcloud.com/obj/resourcesystem/images/677/6779fb11-c2ca-451a-92ed-8a9e73d747d9/40b80fb53952eae3.png)
|
| Out[28]= |

|
For state plots, WolframModelPlot options can be given:
| In[29]:= |
![(* Evaluate this cell to get the example input *) CloudGet["https://www.wolframcloud.com/obj/8ce611f6-79de-488a-9737-35979e9793d6"]](https://www.wolframcloud.com/obj/resourcesystem/images/677/6779fb11-c2ca-451a-92ed-8a9e73d747d9/799644777f0b6ea9.png)
|
| Out[29]= |

|
Evolution objects are created by WolframModel without a property argument:
| In[31]:= |
|
| Out[32]= |
|
WolframModelPlot is used internally generate graphics:
| In[33]:= |
|
| Out[33]= |

|
| In[34]:= |
|
| Out[34]= |
|
The content of very large evolutions will not be saved in the notebook by default:
| In[35]:= |
|
| Out[35]= |
|
Click "Store now" to save for you in other Kernel sessions:
Show which rule is used for each event on a causal graph:
| In[36]:= |
![(* Evaluate this cell to get the example input *) CloudGet["https://www.wolframcloud.com/obj/28c86872-7d20-46a2-82c5-7c67a98c8016"]](https://www.wolframcloud.com/obj/resourcesystem/images/677/6779fb11-c2ca-451a-92ed-8a9e73d747d9/2d50bc6e367384ec.png)
|
| Out[36]= |
|
Color edges of different generations differently in a "StatesPlotsList":
| In[37]:= |
![(* Evaluate this cell to get the example input *) CloudGet["https://www.wolframcloud.com/obj/96eafa19-57fc-4eaa-840b-b3c3b13a7b23"]](https://www.wolframcloud.com/obj/resourcesystem/images/677/6779fb11-c2ca-451a-92ed-8a9e73d747d9/28ed684ee8ccb913.png)
|
| Out[37]= |
|
This work is licensed under a Creative Commons Attribution 4.0 International License
![(* Evaluate this cell to get the example input *) CloudGet["https://www.wolframcloud.com/obj/c250de2d-d3a9-4ebe-b978-8c5353e94cac"]](https://www.wolframcloud.com/obj/resourcesystem/images/677/6779fb11-c2ca-451a-92ed-8a9e73d747d9/75029ae55de2c97f.png)