Wolfram Function Repository
Instant-use add-on functions for the Wolfram Language
Function Repository Resource:
Compute molecular graph autocorrelation vectors, convolved over atomic properties
ResourceFunction["MolecularGraphAutocorrelation"][mol] returns the graph property autocorrelation function for the input Molecule mol. | |
ResourceFunction["MolecularGraphAutocorrelation"][str] returns the graph property autocorrelation function for the input SMILES string str. |
| "Distance" | 3 | path length or distance between atoms |
| "PropertyKernels" | (see below) | properties to include in the computation |
| "OutputStyle" | "Vector" | format of returned quantity |
The function can take either a SMILES string or a Molecule as input. By default, it returns a vector of 20 values, four values (0-, 1-, 2-, 3- neighbor autocorrelation distance) for each of the five default properties:
| In[1]:= |
| Out[1]= |
Redo using an explicit Molecule input form:
| In[2]:= |
| Out[2]= |
Both the path length and the properties computed can be set as options. The returned vector has the dimension of the number of property kernels times the number of distances considered. In general, any AtomList property can be used in the "PropertyKernels" option value:
| In[3]:= |
| Out[3]= |
For small molecules without second- or third-nearest neighbors, the vector that is returned has zeros at those entries (for example, atoms in a water molecule are at most two bonds away from each other):
| In[4]:= |
| Out[4]= |
Changing the "OutputStyle" to "Association" clarifies that it is the fourth element (the third-neighbor) terms that are zero for each property:
| In[5]:= |
| Out[5]= |
The option "Distance" controls the number of neighbors over which the graph correlation is calculated. The default value is 3 and must be a non-negative integer (0, 1, 2, 3, …):
| In[6]:= |
| Out[6]= |
Use the "PropertyKernels" option to specify properties (from AtomList) to include in the calculations:
| In[7]:= |
| Out[7]= |
Use the "OutputStyle" option to specify the format of returned quantity. The default is a "Vector" output:
| In[8]:= |
| Out[8]= |
Other options include "Association", which returns an Association whose keys are the property and whose values are the vector of autocorrelated values for each distance:
| In[9]:= |
| Out[9]= |  |
The option "Matrix" returns a list of lists, arranged by property and then by distance:
| In[10]:= |
| Out[10]= |
This "Matrix" setting for "OutputStyle" can be convenient for tabular data presentations:
| In[11]:= | ![TableForm[%, TableHeadings -> { {"AtomicNumber", "Electronegativity", "CovalentRadius", "Identity", "CoordinationNumber"}, Range[0, 3]}]](https://www.wolframcloud.com/obj/resourcesystem/images/65d/65dc2b6e-0ecc-49de-b5aa-0e58342baf14/6004c26d5ba6ba70.png) |
| Out[11]= |  |
Visualize molecular similarity by using the MolecularGraphAutocorrelation:
| In[12]:= | ![(*Generate Molecule representations for a list of amines SMILES strings*)
amines = Molecule /@ {"NCCN", "NCCCN", "NCCCCN", "NCCCCCN", "NCCCCCCCN", "NCCCNCCCCNCCCN", "CN(C)CCN(C)C", "CNCCNC", "C1CNCCN1", "CC1CNCCN1", "CC1CNC(C)CN1", "C1CN2CCN1CC2", "NC1CN2CCC1CC2", "NC1CCNC1", "NCC1CCCCN1", "CC1=NC=CN=C1"};
(*Compute the [\[FilledSmallSquare]] MolecularGraphAutocorrelation for the list*)
gac = ResourceFunction["MolecularGraphAutocorrelation"] /@ amines;
(*reduce the 20-dimensional autocorrelation vector down to 2 dimensions*)
reduced = DimensionReduce[gac,
Method -> "PrincipalComponentsAnalysis",
FeatureExtractor -> "StandardizedVector"];
ListPlot[ (*visualization with mouseovers*)
MapThread[Tooltip[#1, MoleculePlot[#2]] &, {reduced, amines}],
AxesLabel -> {"PC1", "PC2"}]](https://www.wolframcloud.com/obj/resourcesystem/images/65d/65dc2b6e-0ecc-49de-b5aa-0e58342baf14/2bf8dbd82b2d6d92.png) |
| Out[13]= | 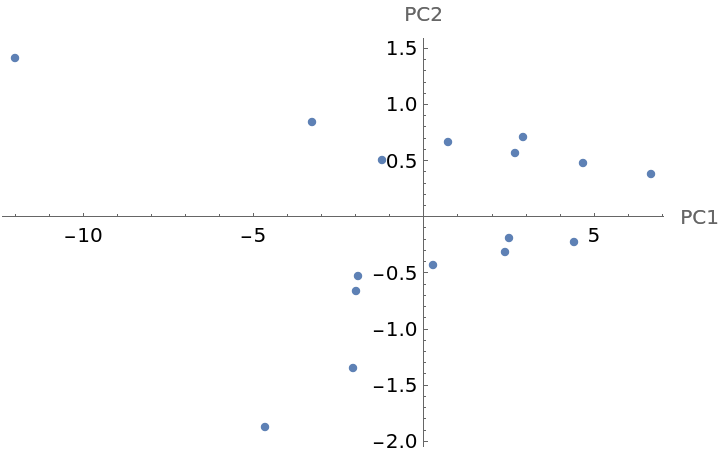 |
Each point in the graph has a Tooltip that shows the corresponding structure. In this example, the first principal component (PC1) is related to overall molecular size and the second principal component (PC2) captures whether the molecule has a ring (positive values) or not (negative values).
This work is licensed under a Creative Commons Attribution 4.0 International License