Wolfram Function Repository
Instant-use add-on functions for the Wolfram Language
Function Repository Resource:
Create a graph from a data sequence
ResourceFunction["SequenceGraph"][list] creates a graph connecting adjacent entries of list. |
Plot a simple series of numbers:
| In[1]:= |
| Out[1]= | 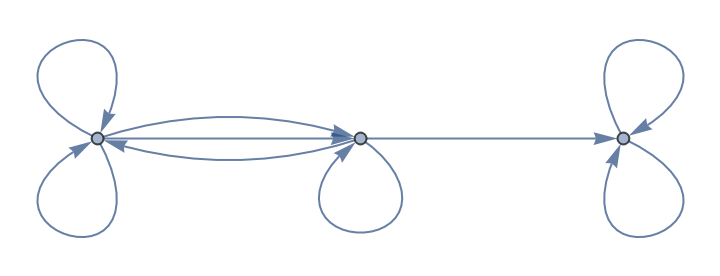 |
SequenceGraph accepts string elements as well as any options accepted by Graph:
| In[2]:= |
| Out[2]= | 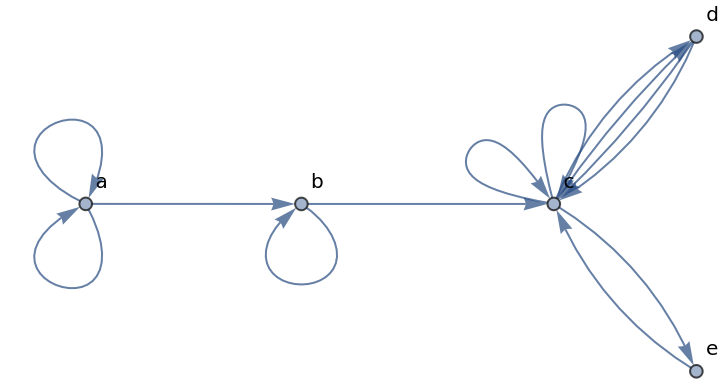 |
SequenceGraph accepts a series of symbolic values:
| In[3]:= |
| Out[3]= | 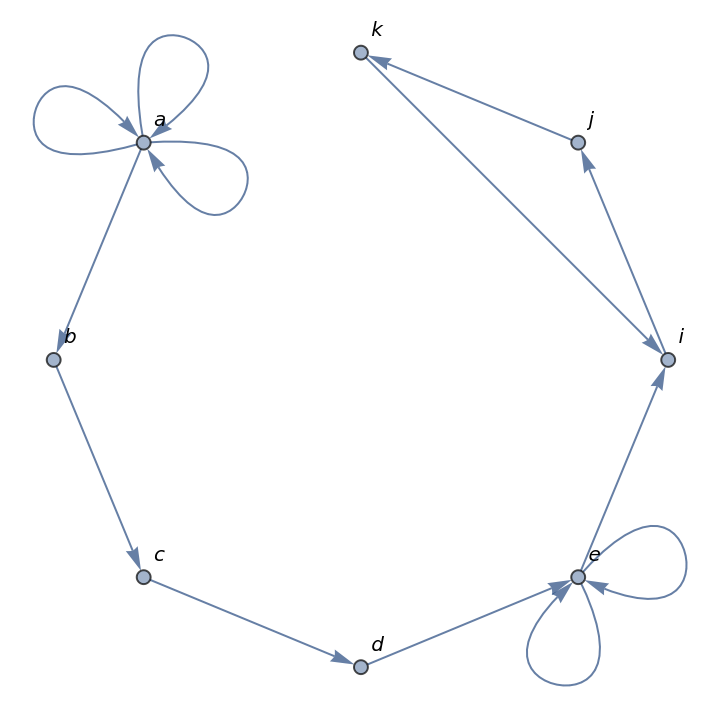 |
Plot a series created by a range of data:
| In[4]:= |
| Out[4]= |
Plot the digits of π:
| In[5]:= |
| Out[5]= |
| In[6]:= |
| Out[7]= | 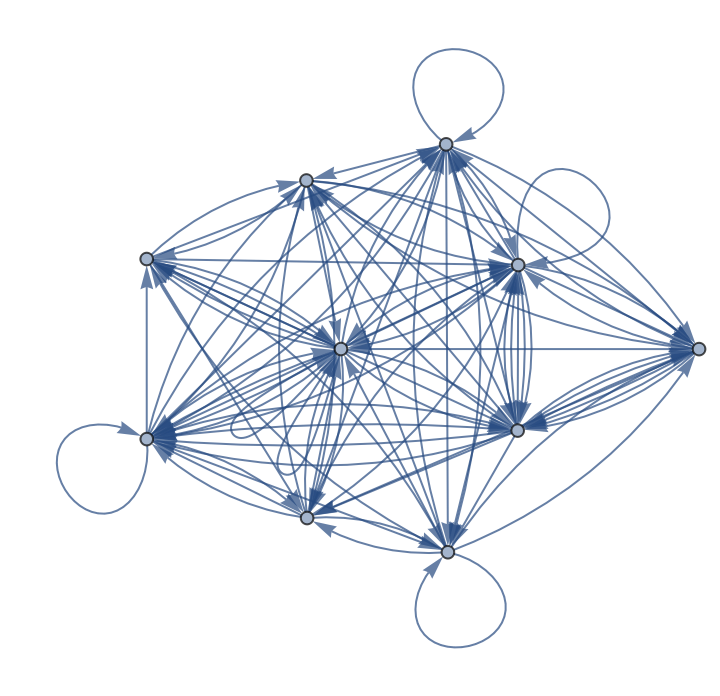 |
Plot the digits of ⅇ:
| In[8]:= |
| Out[8]= |
| In[9]:= |
| Out[10]= | 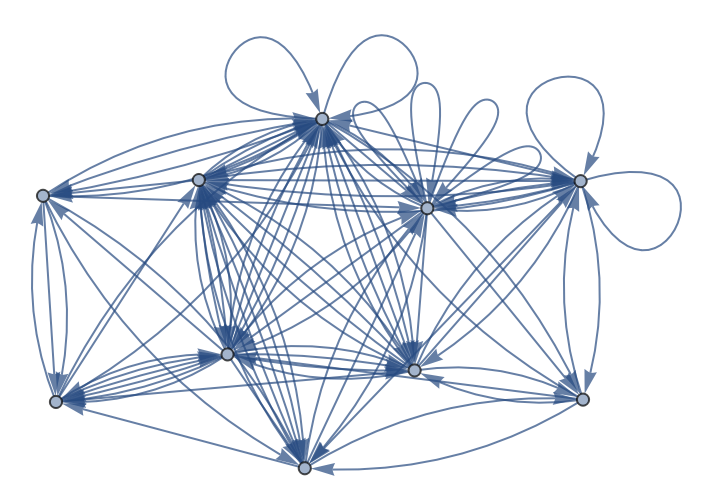 |
Analyze the dynamical behavior of a class-4 cellular automaton by the sum of black cells of each step, and view as a graph:
| In[11]:= |
| Out[12]= | 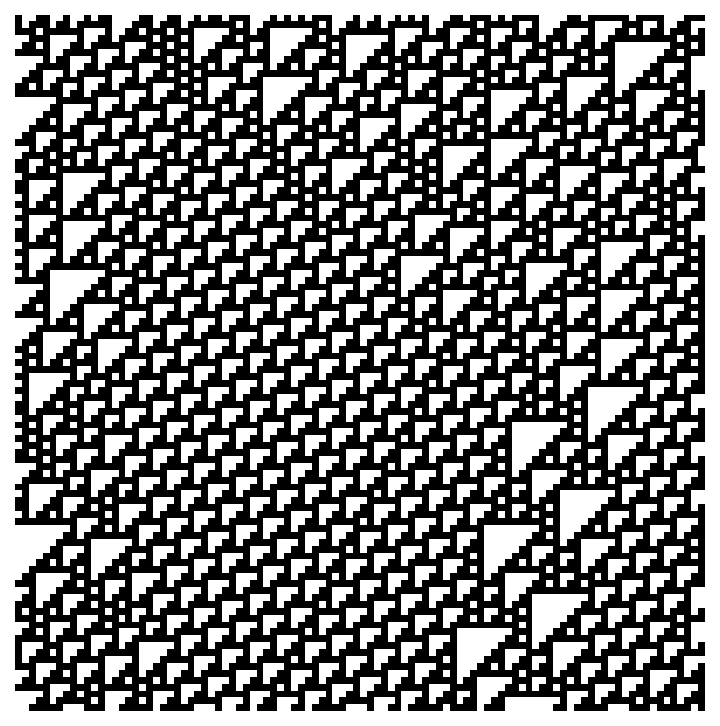 |
| In[13]:= |
| Out[13]= | 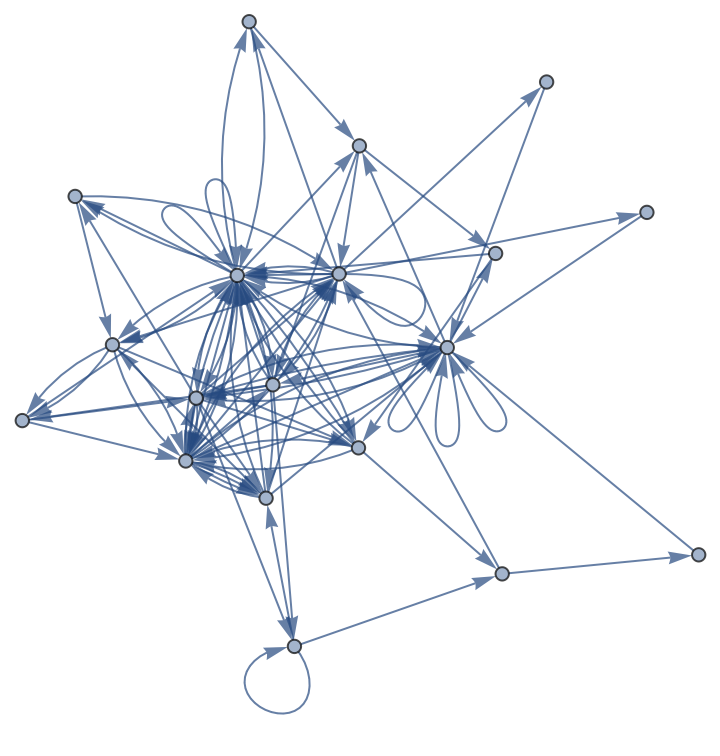 |
Analyze the dynamical behavior of a class-2 cellular automaton by the sum of black cells of each step, and view as a graph:
| In[14]:= |
| Out[15]= | 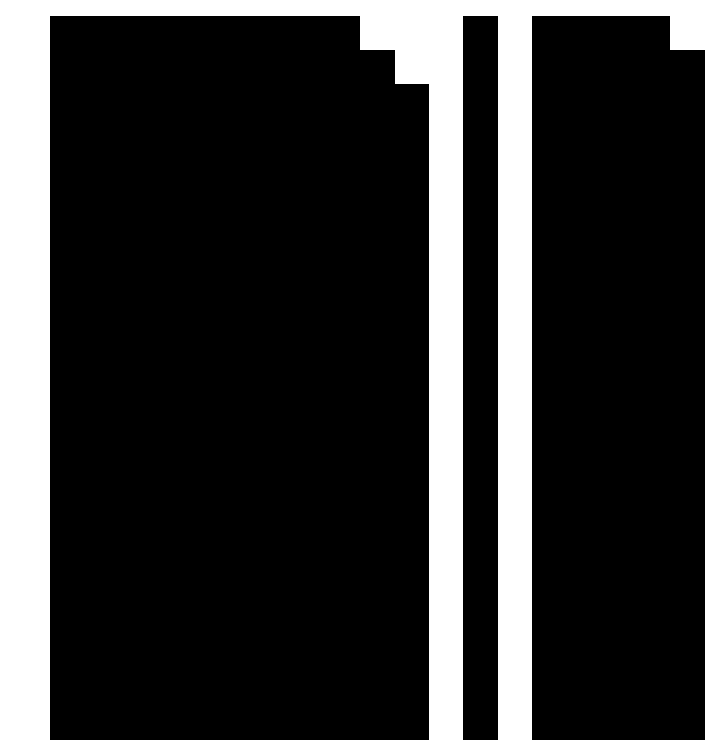 |
| In[16]:= |
| Out[16]= | 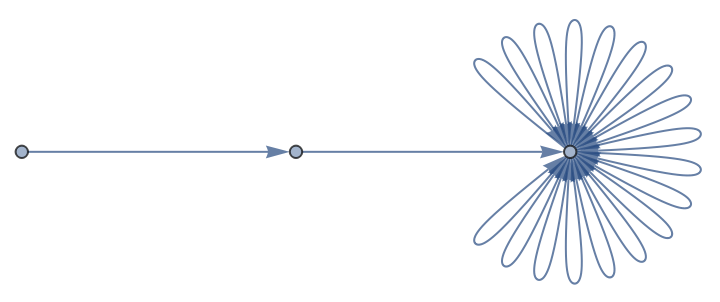 |
Plot the sequence of words in a book:
| In[17]:= |
| Out[17]= | 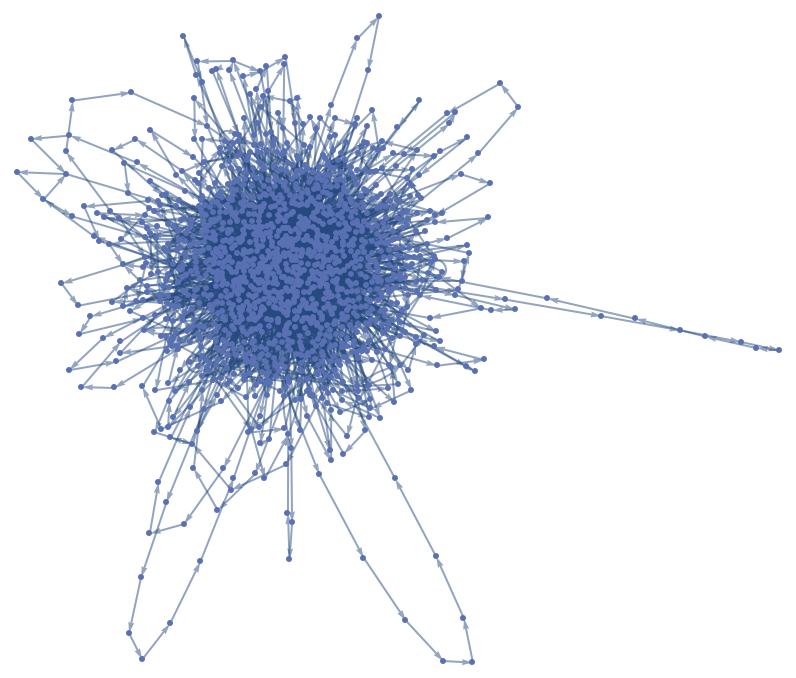 |
This work is licensed under a Creative Commons Attribution 4.0 International License