Wolfram Function Repository
Instant-use add-on functions for the Wolfram Language
Function Repository Resource:
Compute and plot the approximation to the integral of a function on an interval
ResourceFunction["IntegralApproximationPlot"][f,{x,xmin,xmax},method,partition] plots f and an approximation to the integral of f over the interval xmin≤x≤xmax based on the approximation method and the type of the partition. |
| "Left" | the height of the approximating rectangle is determined by the value of the function at the left-hand endpoint of each subinterval |
| "Midpoint" | the height of the approximating rectangle is determined by the value of the function at the midpoint of each subinterval |
| "Right" | the height of the approximating rectangle is determined by the value of the function at the right-hand endpoint of each subinterval |
| "Upper" | the height of the approximating rectangle is determined by the maximum value of the function on each subinterval |
| "Lower" | the height of the approximating rectangle is determined by the minimum value of the function on each subinterval |
| "Trap" | the approximation is determined by a trapezoid determined by the heights at pairs of endpoints |
| "Simpson" | the approximation is determined by quadratic polynomials determined by the endpoints and midpoint of the intervals |
| "Riemann" | the height of the approximating rectangle is determined by the value of the function at a random point in each subinterval |
A left approximation using a regular subdivision with 20 subintervals:
| In[1]:= |
| Out[1]= | 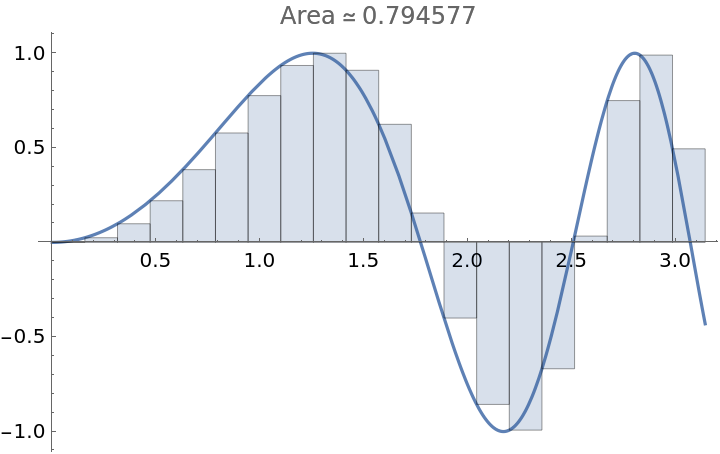 |
An upper approximation using a regular subdivision with 15 subintervals:
| In[2]:= |
| Out[2]= |  |
Suppress the plot and just return the approximation:
| In[3]:= |
| Out[3]= |
Specify the mesh size of the partition:
| In[4]:= |
| Out[4]= | 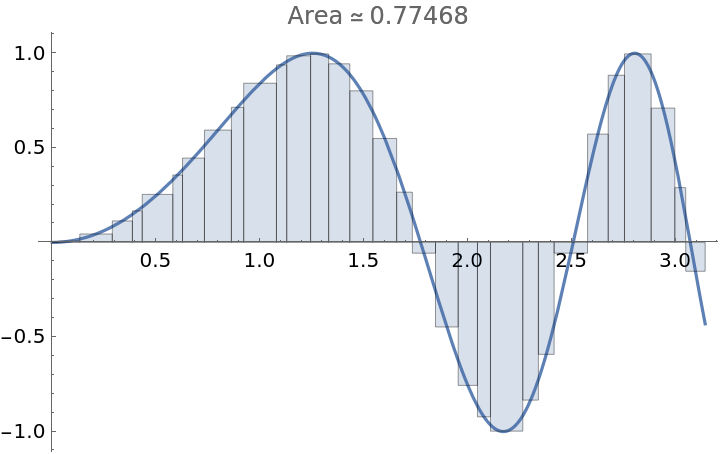 |
The option "Exact" does not apply to partitions containing approximate real numbers:
| In[5]:= |
Return the exact approximation for a partition using exact numbers:
| In[6]:= |
| Out[6]= | 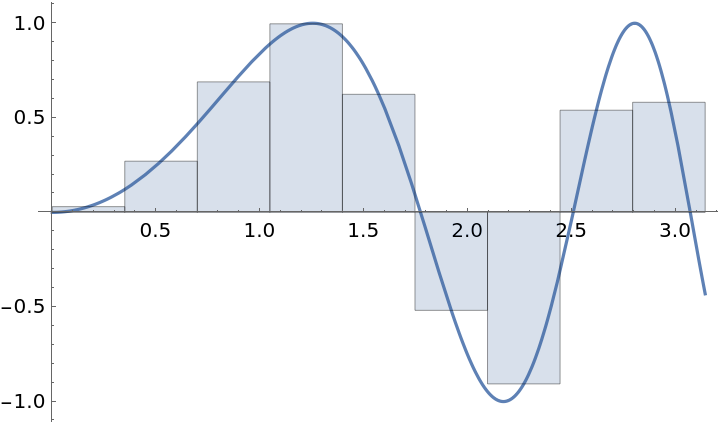 |
Apply a style to the polynomials used in Simpson’s approximation:
| In[7]:= |
| Out[7]= | 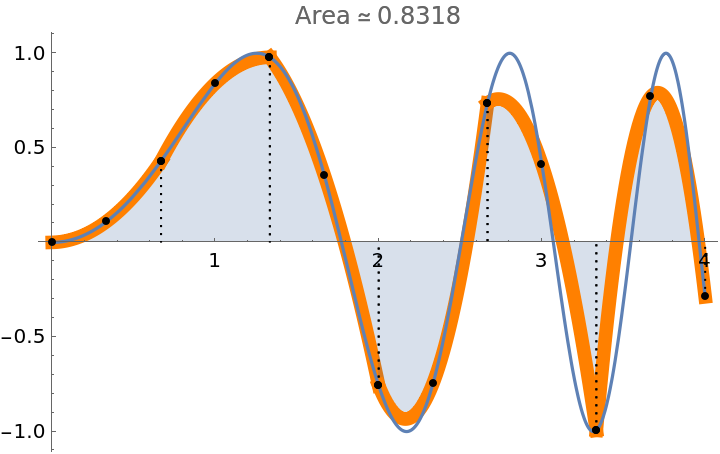 |
Add a style to the filling:
| In[8]:= |
| Out[8]= | 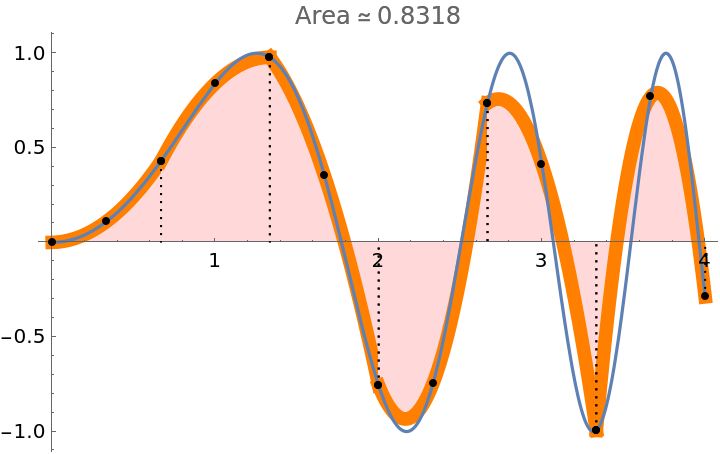 |
Use a user-defined partition:
| In[9]:= |
| Out[9]= | 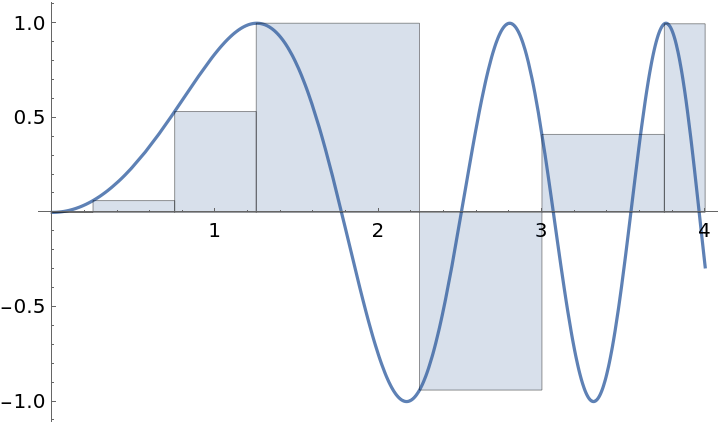 |
| In[10]:= |

| Out[10]= | 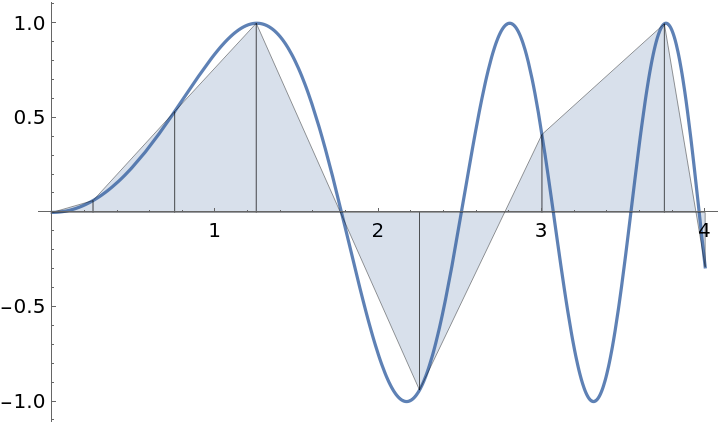 |
Use Manipulate to illustrate all possible combinations of methods and partitions (except user-defined partitions):
| In[11]:= | ![Manipulate[
ResourceFunction["IntegralApproximationPlot"][Sin[x^2], {x, 0, 4}, method, If[
StringMatchQ[ToString[partition], "Regular"], {"Regular", n}, {"Maxdx", dx}], "PrintDisplay" -> False, ImageSize -> 400, Frame -> True], {method, {"Left", "Midpoint", "Right", "Upper", "Lower", "Trap", "Simpson", "Riemann"}}, {partition, {"Regular", "Maxdx"}}, {n, Range[10, 60, 10]}, {dx, Range[.5, .05, -.05]}, SaveDefinitions -> True]](https://www.wolframcloud.com/obj/resourcesystem/images/5fa/5fa4608a-5582-4117-8118-89e399bb07d5/4f7753ab3c72b4ef.png) |
| Out[11]= | 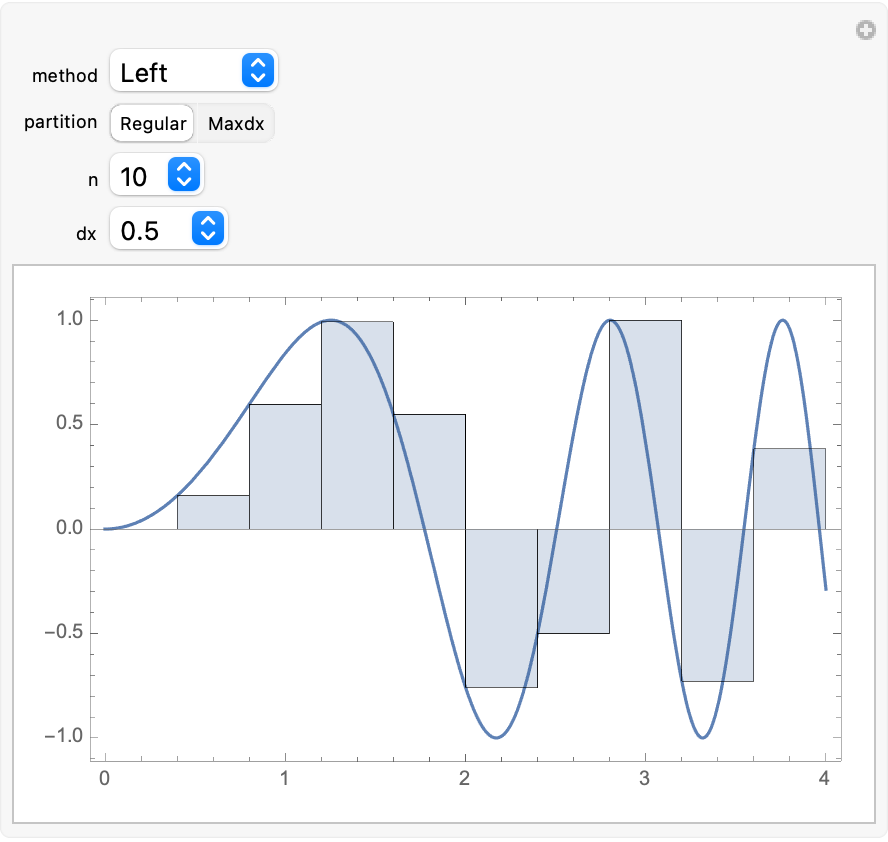 |
Simpson’s method will not accept a user-defined partition:
| In[12]:= |
This work is licensed under a Creative Commons Attribution 4.0 International License