Wolfram Function Repository
Instant-use add-on functions for the Wolfram Language
Function Repository Resource:
Create a lognormal distribution using mean and median as parameters instead of the conventional parameters
ResourceFunction["MeanMedianLogNormalDistribution"][mean,median] creates a LogNormalDistribution whose mean is mean and whose median is median. |
Create a LogNormalDistribution whose mean is ⅇ3 and whose median is ⅇ:
| In[1]:= |
| Out[1]= |
Create a lognormal distribution whose mean is 7000 and whose median is 2000:
| In[2]:= |
| Out[2]= |
The function handles symbolic parameters:
| In[3]:= |
| Out[3]= |
Show how decreasing the median of a lognormal distribution affects the associated PDF:
| In[4]:= | ![Table[Plot[
PDF[ResourceFunction["MeanMedianLogNormalDistribution"][1, median], x], {x, 0, 20}, PlotRange -> {0, 10}, PlotLabel -> median, ScalingFunctions -> {"Log", "Log"}], {median, 0.8, 0.2, -0.2}]](https://www.wolframcloud.com/obj/resourcesystem/images/5af/5af0e61f-890c-4273-8b45-75967c9f256c/017702930b3bd2c8.png) |
| Out[4]= | 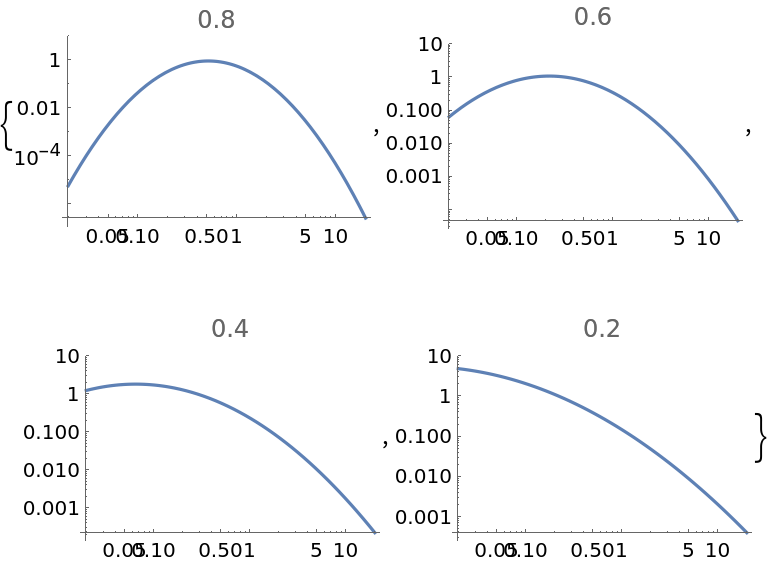 |
An alternative parameterization would use the mean and the ratio of the median to the mean:
| In[5]:= |
| Out[5]= |
For other distributions, one can perform similar reparameterizations by using Solve, Reduce or similar methods:
| In[6]:= | ![GammaDistribution[a, b] /. First@Solve[{Mean[GammaDistribution[a, b]] == m, StandardDeviation[GammaDistribution[a, b]] == s}, {a, b}]](https://www.wolframcloud.com/obj/resourcesystem/images/5af/5af0e61f-890c-4273-8b45-75967c9f256c/13e61c4c2df59704.png) |
| Out[6]= |
If the median is greater than the mean, one gets a LogNormalDistribution with impermissible imaginary components:
| In[7]:= |
| Out[7]= |
Observations of health claims show that the mean is 7000 and the median is 2500. Compute the fraction of total claims incurred by persons in the top 1% of claims:
| In[8]:= | ![With[{dist = ResourceFunction["MeanMedianLogNormalDistribution"][7000, 2500]}, 1/Mean[dist] 0.01 NExpectation[
x \[Conditioned] x > Quantile[dist, (1 - 0.01)], x \[Distributed] dist]]](https://www.wolframcloud.com/obj/resourcesystem/images/5af/5af0e61f-890c-4273-8b45-75967c9f256c/62d94dd7eed4b316.png) |
| Out[8]= |
Make a table showing the corresponding fraction as one examines the top q percent of claims:
| In[9]:= | ![Table[{q, With[{dist = ResourceFunction["MeanMedianLogNormalDistribution"][7000, 2500]},
1/Mean[dist] q NExpectation[
x \[Conditioned] x > Quantile[dist, (1 - q)], x \[Distributed] dist]]}, {q, 0.01, 0.5, 0.01}]](https://www.wolframcloud.com/obj/resourcesystem/images/5af/5af0e61f-890c-4273-8b45-75967c9f256c/7a7e07c35dc6f01e.png) |
| Out[9]= |  |
This work is licensed under a Creative Commons Attribution 4.0 International License