Wolfram Function Repository
Instant-use add-on functions for the Wolfram Language
Function Repository Resource:
An operator form of the Quantile function
ResourceFunction["QuantileOperator"][q] gives an operator for retrieving the qth quantile from data. | |
ResourceFunction["QuantileOperator"][q,{{a,b},{c,d}}] uses the quantile definition specified by parameters a,b,c,d. |
Create an operator that will find the halfway-value (median) of a List or statistical distribution:
| In[1]:= |
| Out[1]= |
Apply the operator to a List and a distribution:
| In[2]:= |
| Out[2]= |
Create an operator that computes lower and upper quartiles for whatever data it encounters, and then map it over multiple sets of data:
| In[3]:= |
| Out[3]= |
Create an Association in which the keys are various parameters to the Quantile function and the values are each a corresponding QuantileOperator:
| In[4]:= | ![quantileOperators75 = AssociationMap[
params |-> ResourceFunction["QuantileOperator"][3/4, params], {{{0, 0}, {1, 0}}, {{0, 0}, {0, 1}}, {{1/2, 0}, {0, 0}}, {{1/2, 0}, {0, 1}}, {{0, 1}, {0, 1}}, {{1, -1}, {0, 1}}, {{1/3, 1/3}, {0, 1}}, {{3/8, 1/4}, {0, 1}}}]](https://www.wolframcloud.com/obj/resourcesystem/images/4d5/4d5fd61f-eb2d-40b0-be5e-13b76aaa9b73/785252ddfa494a00.png) |
| Out[4]= |  |
Apply the different QuantileOperator expressions to the same data to see how the choice of parameters affects the outcome:
| In[5]:= |
| Out[5]= |  |
This work is licensed under a Creative Commons Attribution 4.0 International License
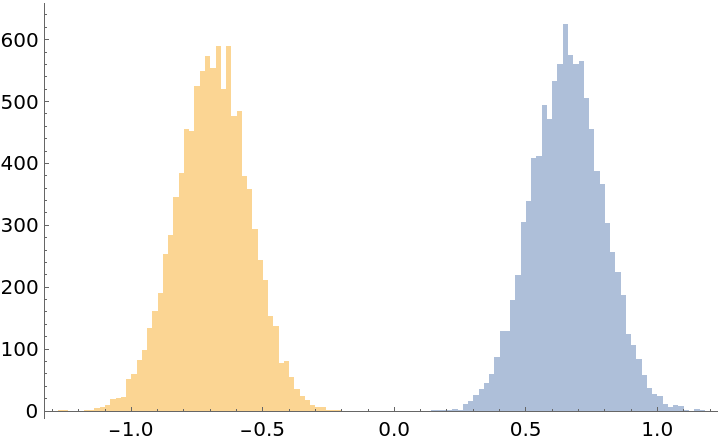
![Histogram[
Transpose[
Map[ResourceFunction["QuantileOperator"][{0.25, 0.75}]][
RandomVariate[NormalDistribution[0, 1], {10000, 100}]]], 100]](https://www.wolframcloud.com/obj/resourcesystem/images/4d5/4d5fd61f-eb2d-40b0-be5e-13b76aaa9b73/00ce7c098a5b8b5e.png)
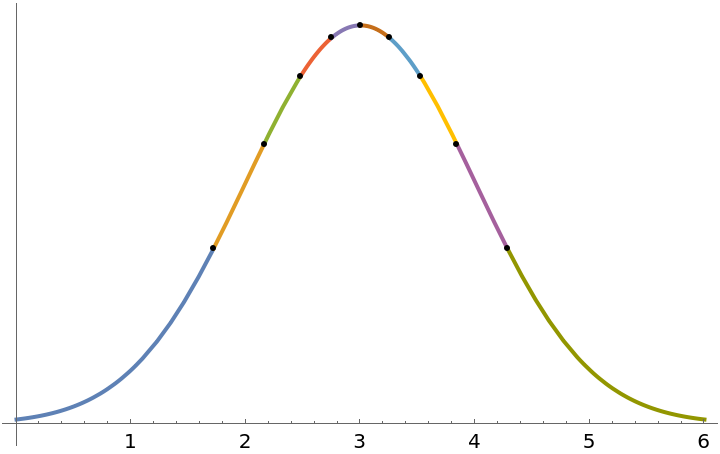
![With[{\[ScriptCapitalD] = NormalDistribution[3, 1]}, Plot[PDF[\[ScriptCapitalD], x], {x, 0, 6}, Mesh -> {ResourceFunction["QuantileOperator"][
Range[0.1, 0.9, 0.1]][\[ScriptCapitalD]]}, Sequence[
Ticks -> {Automatic, None}, MeshFunctions -> {#& }, MeshStyle -> Black, MeshShading -> ColorData[97, "ColorList"], PlotStyle -> Thick]]
]](https://www.wolframcloud.com/obj/resourcesystem/images/4d5/4d5fd61f-eb2d-40b0-be5e-13b76aaa9b73/57e83338f78377a9.png)