Wolfram Function Repository
Instant-use add-on functions for the Wolfram Language
Function Repository Resource:
Create a color function from colors in an image
ResourceFunction["ImageColorFunction"][img] gives a color function based on the colors in img. |
| SampleCount | Automatic | if a positive integer, the maximum number of key or indexed colors |
| SampleOrder | "Dominance" | order of the key or indexed colors |
| Smoothed | True | whether key colors are evenly spaced (True) or spaced according to dominance (False) |
| Indexed | False | whether the color function is continuous (False) or discrete (True) |
| "Dominance" | most dominant color (0) to least dominant (1) |
| "Red" | least red (0) to most red (1) |
| "Green" | least green (0) to most green (1) |
| "Blue" | least blue (0) to most blue (1) |
| "Hue" | least h (0) to greatest h (1) in Hue[h] |
| "Saturation" | lowest saturation (0) to highest saturation (1) |
| "Brightness" | darkest color (0) to brightest color (1) |
Make a color function from an image:
| In[1]:= | ![(* Evaluate this cell to get the example input *) CloudGet["https://www.wolframcloud.com/obj/57d4de70-9d3f-4c23-ba81-76eb3b32ecd0"]](https://www.wolframcloud.com/obj/resourcesystem/images/496/49673d9f-bdbb-4f32-b768-61cc6f6805a9/746572f6da67cc3a.png) |
| Out[1]= |
Use the color function in a graphics expression:
| In[2]:= |
| Out[2]= | 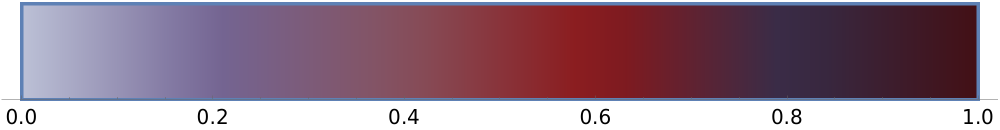 |
Change the number of key colors in the color function:
| In[3]:= | ![(* Evaluate this cell to get the example input *) CloudGet["https://www.wolframcloud.com/obj/795c99c1-0d5f-49d3-986a-c6b18f38f015"]](https://www.wolframcloud.com/obj/resourcesystem/images/496/49673d9f-bdbb-4f32-b768-61cc6f6805a9/502dd6a6a042602b.png) |
| Out[3]= | 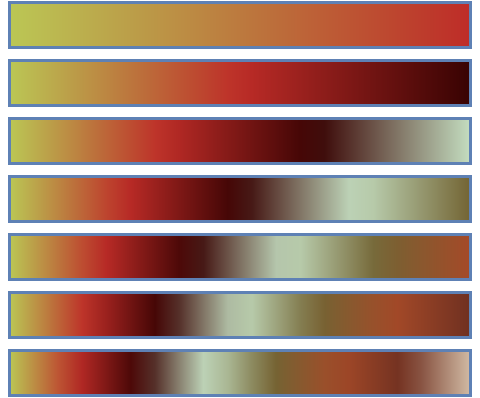 |
Change the order of key colors in the color function:
| In[4]:= | ![o = {"Dominance", "Red", "Green", "Blue", "Hue", "Saturation", "Brightness"};
Column[Table[
RegionPlot[True, {x, 0, 1}, {y, 0, 1}, ColorFunction -> ResourceFunction["ImageColorFunction"][img, SampleOrder -> o[[i]]], Frame -> False, Axes -> False, AspectRatio -> .1, ImageSize -> 240], {i, 1, 7}]]](https://www.wolframcloud.com/obj/resourcesystem/images/496/49673d9f-bdbb-4f32-b768-61cc6f6805a9/37ef2be223d25b0e.png) |
| Out[4]= | 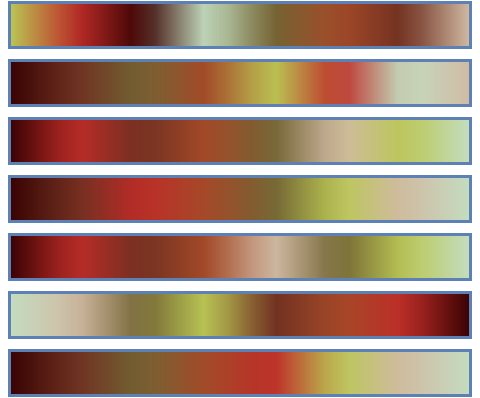 |
Change the spacing of key colors in the color function:
| In[5]:= | ![Column[Table[
RegionPlot[True, {x, 0, 1}, {y, 0, 1}, ColorFunction -> ResourceFunction["ImageColorFunction"][img, Smoothed -> tf], Frame -> False, Axes -> False, AspectRatio -> .1, ImageSize -> 240], {tf, {True, False}}]]](https://www.wolframcloud.com/obj/resourcesystem/images/496/49673d9f-bdbb-4f32-b768-61cc6f6805a9/5c9b8d65fe9f6a27.png) |
| Out[5]= | 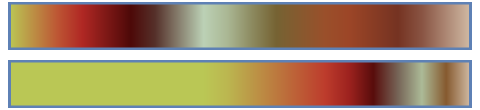 |
Make a discrete color function:
| In[6]:= | ![(* Evaluate this cell to get the example input *) CloudGet["https://www.wolframcloud.com/obj/4266cc27-96e1-4ad3-a4a6-97e62f68ad48"]](https://www.wolframcloud.com/obj/resourcesystem/images/496/49673d9f-bdbb-4f32-b768-61cc6f6805a9/66ff11a490392cc5.png) |
Use the function as an indexed color scheme:
| In[7]:= |
| Out[7]= | 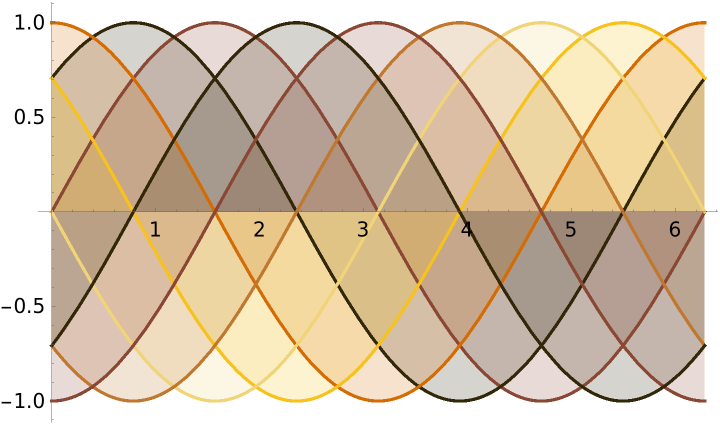 |
This work is licensed under a Creative Commons Attribution 4.0 International License