Wolfram Function Repository
Instant-use add-on functions for the Wolfram Language
Function Repository Resource:
Plot a time series that includes shading to indicate ranges in the plotted value
ResourceFunction["DateListPlotRanged"][series] plots a time series containing data of the form {value,{min,max}}. |
Plot a series of values that include ranges:
| In[1]:= | ![ResourceFunction[
"DateListPlotRanged"][<|DateObject[{1994, 7, 1}, "Day", "Gregorian", -4.`] -> {1.68, {1.3, 2.1}}, DateObject[{2006, 2, 9}, "Day", "Gregorian", -4.`] -> {2.6, {1.7, 3.}}, DateObject[{2006, 3, 16}, "Day", "Gregorian", -4.`] -> {1.8, {1.8, 2.5}}, DateObject[{2006, 8, 23}, "Day", "Gregorian", -4.`] -> {2., {1.8, 2.5}}, DateObject[{2007, 12, 1}, "Day", "Gregorian", -4.`] -> {2.3, {1.7, 3.}}, DateObject[{2011, 11, 1}, "Day", "Gregorian", -4.`] -> {2., {1, 3.2}}, DateObject[{2019, 5, 18}, "Day", "Gregorian", -4.`] -> {1.8, {1.6, 2.6}}|>]](https://www.wolframcloud.com/obj/resourcesystem/images/47c/47ce2163-3bff-4a17-a717-2d9696a2b81f/72e132a9a9ed6e13.png) |
| Out[1]= | 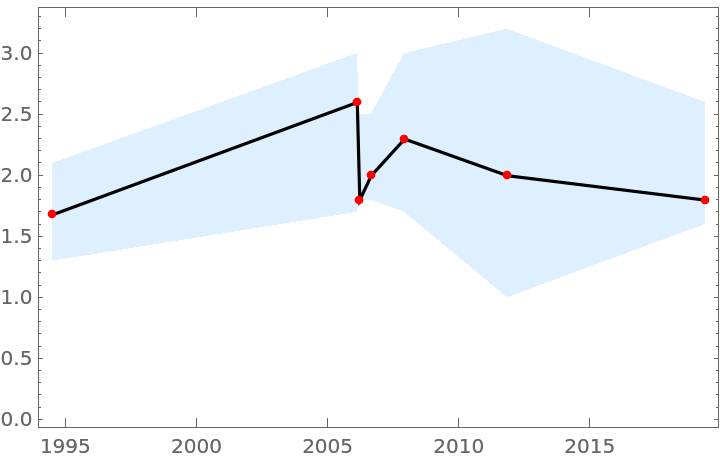 |
If a range is omitted, it will not be plotted:
| In[2]:= | ![ResourceFunction[
"DateListPlotRanged"][<|DateObject[{1994, 7, 1}, "Day", "Gregorian", -4.`] -> {1.68, {1.3, 2.1}}, DateObject[{2003, 2, 9}, "Day", "Gregorian", -5.`] -> {2.6, {1.7, 2.4}}, DateObject[{2006, 3, 16}, "Day", "Gregorian", -4.`] -> {1.8, {1.8, 2.5}}, DateObject[{2007, 12, 1}, "Day", "Gregorian", -4.`] -> {2.3}, DateObject[{2008, 8, 23}, "Day", "Gregorian", -5.`] -> {2., {1.8, 2.5}}, DateObject[{2011, 11, 1}, "Day", "Gregorian", -4.`] -> {2., {1, 3.2}}, DateObject[{2019, 5, 18}, "Day", "Gregorian", -4.`] -> {1.8, {1.6, 2.6}}|>]](https://www.wolframcloud.com/obj/resourcesystem/images/47c/47ce2163-3bff-4a17-a717-2d9696a2b81f/0b03e59256537e62.png) |
| Out[2]= | 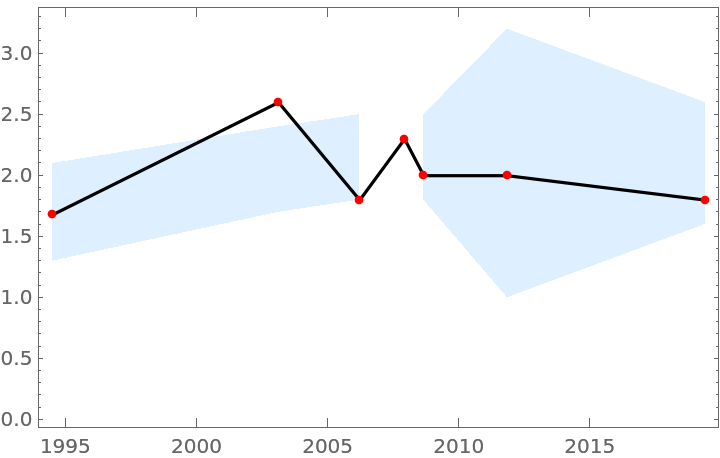 |
This work is licensed under a Creative Commons Attribution 4.0 International License