Wolfram Function Repository
Instant-use add-on functions for the Wolfram Language
Function Repository Resource:
Get data for wildfires observed by the NASA MODIS satellites
ResourceFunction["UnitedStatesWildfireData"][] gives a structured Dataset for wildfires observed by the NASA MODIS instruments on the Terra and Aqua satellites. |
Get the current wildfire data:
| In[1]:= |
| Out[1]= | 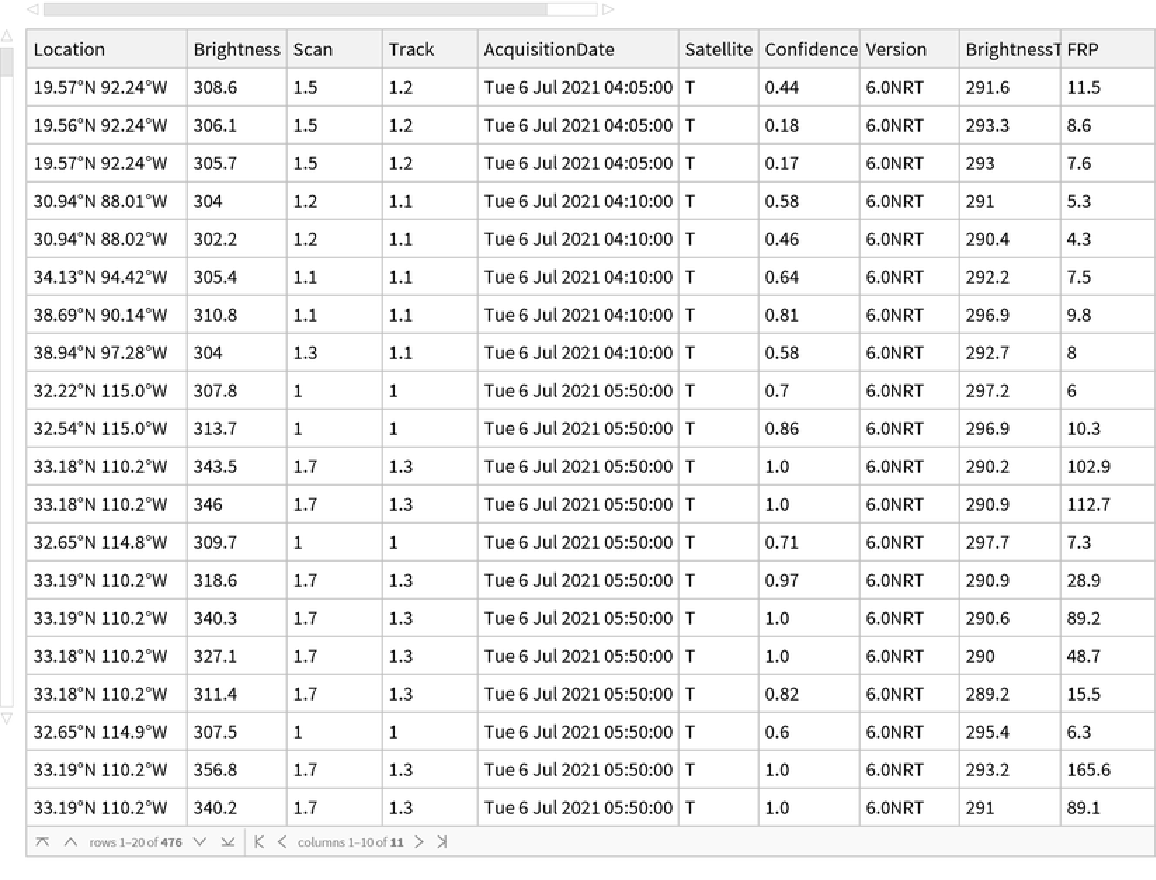 |
Process the salient data columns:
| In[2]:= |
Plot the wildfires:
| In[3]:= | ![GeoGraphics[geo, GeoRange -> EntityClass["AdministrativeDivision", "ContinentalUSStates"], GeoBackground -> "Satellite"]](https://www.wolframcloud.com/obj/resourcesystem/images/447/447f3401-6596-43f0-8079-96b71fc036d2/3b6cd5abadcdab0c.png) |
| Out[3]= | 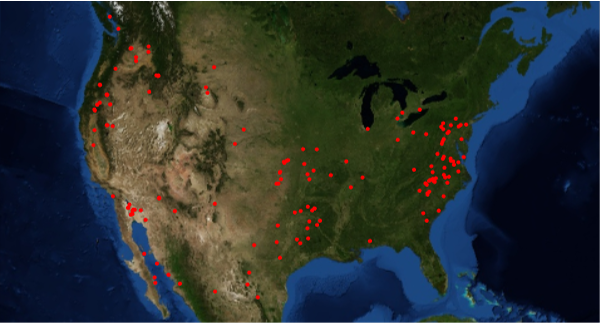 |
Focus on California wildfires:
| In[4]:= | ![GeoGraphics[geo, GeoRange -> Entity["AdministrativeDivision", {"California", "UnitedStates"}], GeoBackground -> "Satellite"]](https://www.wolframcloud.com/obj/resourcesystem/images/447/447f3401-6596-43f0-8079-96b71fc036d2/6a529c7894b51362.png) |
| Out[4]= |  |
Focus on wildfires near San Francisco:
| In[5]:= | ![GeoGraphics[geo, GeoRange -> GeoDisk[Entity[
"City", {"SanFrancisco", "California", "UnitedStates"}], Quantity[200, "Miles"]], GeoBackground -> "Satellite"]](https://www.wolframcloud.com/obj/resourcesystem/images/447/447f3401-6596-43f0-8079-96b71fc036d2/35370c8fbfaec6d3.png) |
| Out[5]= | 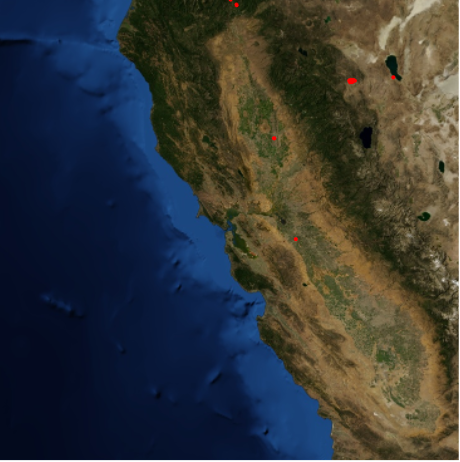 |
Plot the brightness of each data point on a histogram:
| In[6]:= |
| Out[6]= | 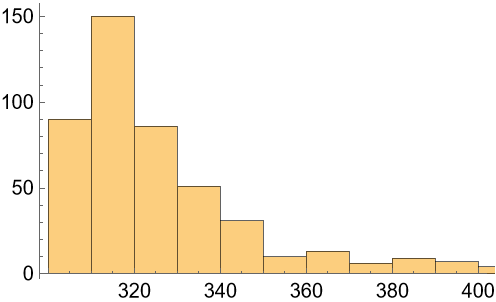 |
This work is licensed under a Creative Commons Attribution 4.0 International License