Function Repository Resource:

TimeSeriesCompress

Source Notebook

Remove redundant data from a time series

Contributed by: Sascha Kratky

ResourceFunction["TimeSeriesCompress"][tseries]

compresses time series tseries by removing data points that can be accurately predicted through linear interpolation.

Details and Options

ResourceFunction["TimeSeriesCompress"] is used to remove redundant data points from a time series. The resulting time series requires less memory, but behaves as the original series within given accuracy requirements.
The input tseries can be a list of values {x1,x2,}, a list of time-value pairs {{t1,x1},{t2,x2},}, a TimeSeries, an EventSeries or TemporalData.
If times are not given, then tseries is assumed to be regular with unit spacing.
ResourceFunction["TimeSeriesCompress"] uses a default tolerance for time series values of 10-10.
ResourceFunction["TimeSeriesCompress"] uses a maximal allowed time distance of ∞.
ResourceFunction["TimeSeriesCompress"] removes Missing data points as a side effect of compression.
ResourceFunction["TimeSeriesCompress"] takes the following options:
"ValueTolerance"10-10maximal allowed value deviation with respect to the original value
"MaxTimeDistance"Infinitymaximal allowed time distance between two data points

Examples

Basic Examples (4) 

Create an example time series:

In[1]:=
example = TimeSeries[{1.5, 1.5, 3., 4.5, 6., 6.1, 6., 5., 4., 2.9, 1.8, 2., 2.1, 1.7, 1.8, 1.8, 1.9, 2.1, 2., 2.}, {0}]
Out[1]=

Visualize the path:

In[2]:=
ListLinePlot[example, PlotMarkers -> Automatic]
Out[2]=

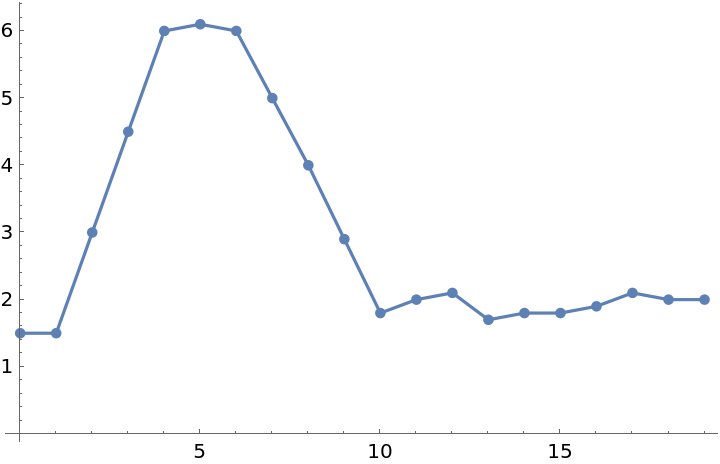
Four redundant points are removed from the time series by compression:

In[3]:=
compressed = ResourceFunction["TimeSeriesCompress"][example];
ListLinePlot[compressed, PlotMarkers -> Automatic]
Out[3]=

Visualize the removed points:

In[4]:=
ListLinePlot[{example, compressed}, PlotMarkers -> Automatic]
Out[4]=

Scope (3) 

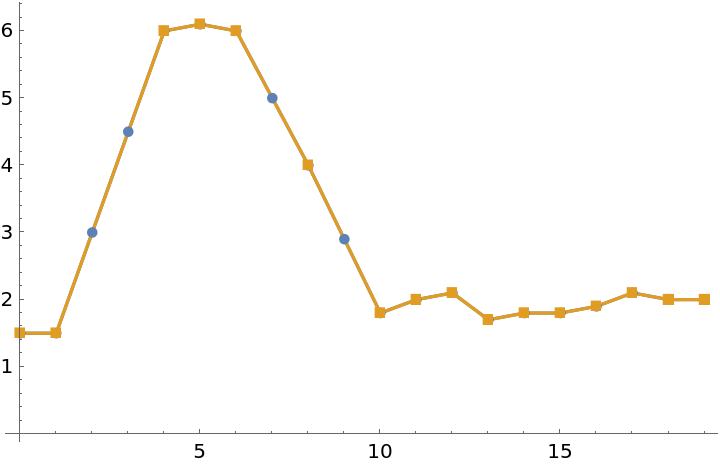
Compress a list of numeric values:

In[5]:=
numeric = Range[1.2, 4.2, 0.10]
Out[5]=
In[6]:=
ResourceFunction["TimeSeriesCompress"]@numeric
Out[6]=

Compress a list of time-value pairs:

In[7]:=
pairs = {{1, -1}, {2, -2}, {3, -1}, {4, 0}, {5, 1}, {6, 2}, {7, 2}, {8, 3}, {9, 2}, {10, 3}, {11, 4}, {12, 5}, {13, 6}, {14, 7}, {15, 8}, {16, 9}, {17, 8}, {18, 7}, {19, 8}, {20, 9}};
In[8]:=
ResourceFunction["TimeSeriesCompress"]@pairs
Out[8]=

Compressing TemporalData applies compression to all underlying paths. The resampling is changed to linear interpolation:

In[9]:=
ResourceFunction["TimeSeriesCompress"]@
 TemporalData[{Range[1, 10], Reverse@Range[2, 11]}, {{1, 2, 5, 10, 12, 15}}]
Out[9]=

Options (4) 

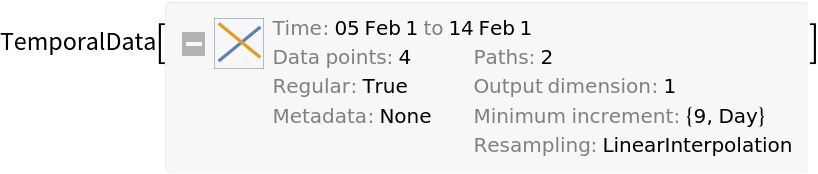
Increasing the maximal allowed deviation in the time series value leads to better compression:

In[10]:=
example = TimeSeries[{1.5, 1.5, 3., 4.5, 6., 6.1, 6., 5., 4., 2.9, 1.8, 2., 2.1, 1.7, 1.8, 1.8, 1.9, 2.1, 2., 2.}, {0}]
Out[10]=
In[11]:=
compressed = ResourceFunction["TimeSeriesCompress"][example, "ValueTolerance" -> 0.2]
Out[11]=

Visualize the removed points:

In[12]:=
ListLinePlot[{example, compressed}, PlotMarkers -> Automatic]
Out[12]=

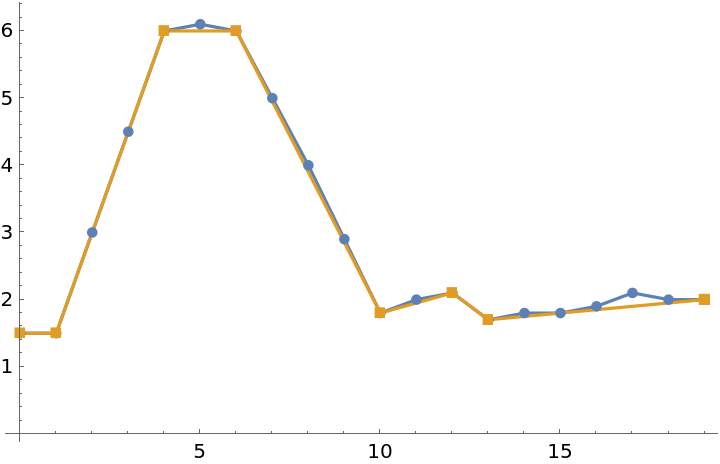
Backtesting the compressed time series values with the original time series values:

In[13]:=
compressed[example["Times"]] - example["Values"] // MinMax
Out[13]=

Limit the maximal time distance between two points:

In[14]:=
ResourceFunction["TimeSeriesCompress"][example, "ValueTolerance" -> 0.2, "MaxTimeDistance" -> 3]["Times"]
Out[14]=

Possible Issues (3) 

TimeSeriesCompress only works on time series whose values are scalars. Time series with higher-dimensional values are returned uncompressed:

In[15]:=
ResourceFunction["TimeSeriesCompress"]@
 TimeSeries[{{2, 1, 2}, {4, 8, 3}, {7, 5, 9}, {6, 3, 6}}, Automatic, ValueDimensions -> 3]
Out[15]=

EventSeries is a special case of TemporalData allowing no interpolation. To compress an EventSeries, convert it to a TimeSeries:

In[16]:=
ResourceFunction["TimeSeriesCompress"]@
 TimeSeries@
  EventSeries[{1, 2, 4, 7, 7, 7, 8}, {{1, 2, 5, 8, 11, 15, 16}}]
Out[16]=

TimeSeriesCompress removes values with head Missing:

In[17]:=
missingtd = TimeSeries[{2, 1, 3, Missing[], 2, 1, 2, Missing[], 6, 2, 5}, {0}]
Out[17]=
In[18]:=
ResourceFunction["TimeSeriesCompress"][missingtd]["Values"]
Out[18]=

Neat Examples (3) 

Use TemporalData to store the stock prices of the FAANG companies since the beginning of the decade:

In[19]:=
FAANG = TemporalData@
  FinancialData[{"FB", "AAPL", "AMZN", "GOOGL", "NFLX"}, "Jan. 1, 2010"]
Out[19]=

If you are not interested in cent fluctuations of the prices of these stocks, you can work with a compressed representation:

In[20]:=
FAANGcompressed = ResourceFunction["TimeSeriesCompress"][FAANG, "ValueTolerance" -> 1.0]
Out[20]=

Compression reduces the required data points by about 40 percent:

In[21]:=
1 - N@(Flatten[FAANGcompressed["ValueList"]] // Length)/(Flatten[
     FAANG["ValueList"]] // Length)
Out[21]=

Publisher

Sascha Kratky

Version History

  • 1.0.0 – 07 October 2019

License Information