Function Repository Resource:

PolygonInterpolation

Source Notebook

Interpolate over values given at the vertices of a polygon

Contributed by: Jan Mangaldan

ResourceFunction["PolygonInterpolation"][{p1,,pn},{f1,,fn},p]

finds an interpolation of the function values fi corresponding to the polygon vertices pi at the point p.

Details

ResourceFunction["PolygonInterpolation"][Polygon[{p1,,pn}],{f1,,fn},p] is equivalent to ResourceFunction["PolygonInterpolation"][{p1,,pn},{f1,,fn},p].
ResourceFunction["PolygonInterpolation"] uses a generalization of barycentric coordinates to interpolate over a polygon.

Examples

Basic Examples (2) 

Compute an interpolation of vertex values at the center of a equilateral triangle:

In[1]:=
ResourceFunction["PolygonInterpolation"][
 CirclePoints[3], {1, 3, 1}, {0, 0}]
Out[1]=

Calculate the vertices of a pentagon:

In[2]:=
pent = N[CirclePoints[5]]
Out[2]=

Compute the value of a function at each vertex:

In[3]:=
f = Sin[#] Cos[#2] &;
In[4]:=
vals = f @@@ pent
Out[4]=

Find the value of an interpolation of the values at a point within the polygon:

In[5]:=
ResourceFunction["PolygonInterpolation"][pent, vals, {1/2, 1/2}]
Out[5]=

Scope (2) 

A triangle:

In[6]:=
triangle = CirclePoints[3]
Out[6]=

Define values at the triangle's vertices for a linear function:

In[7]:=
vals = 3 # + 2 #2 & @@@ triangle
Out[7]=

Evaluate the interpolant at a single point:

In[8]:=
ResourceFunction["PolygonInterpolation"][triangle, vals, {0.2, 0.4}]
Out[8]=

Evaluate the interpolant at multiple points:

In[9]:=
ResourceFunction[
 "PolygonInterpolation"][triangle, vals, {{0.2, 0.4}, {-0.6, 1.1}, {0.1, -1.7}}]
Out[9]=

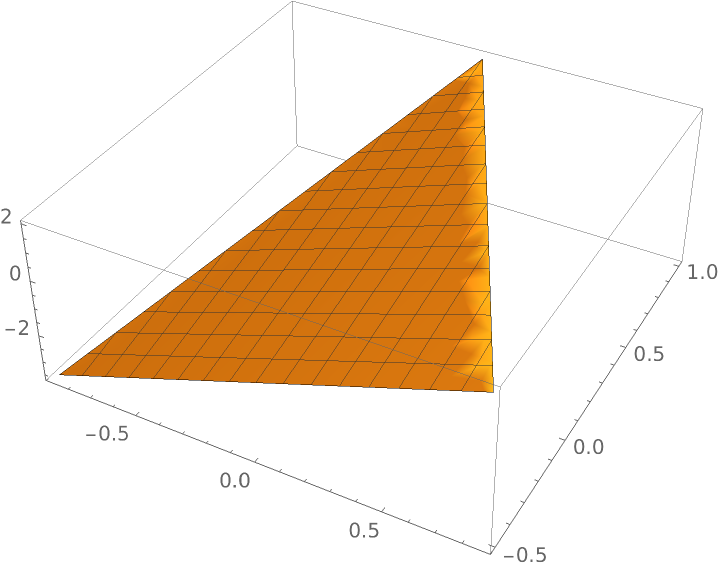
Plot the interpolant over the triangle:

In[10]:=
Plot3D[ResourceFunction["PolygonInterpolation"][triangle, vals, {x, y}], {x, y} \[Element] Polygon[triangle]]
Out[10]=

A star-shaped Polygon:

In[11]:=
star = Polygon[{{2.853169548885461, 0.9270509831248424}, {
   0.673541964869378, 0.9270509831248424}, {0., 3.}, {-0.673541964869378, 0.9270509831248424}, {-2.853169548885461,
    0.9270509831248424}, {-1.0898137920080413`, -0.3541019662496847}, \
{-1.7633557568774194`, -2.4270509831248424`}, {
   0., -1.1458980337503153`}, {
   1.7633557568774194`, -2.4270509831248424`}, {
   1.0898137920080413`, -0.3541019662496847}}];

Values at the polygon's vertices:

In[12]:=
vals = Sin[#1 - Cos[#2]] & @@@ First[star];

Evaluate the interpolant at a single point:

In[13]:=
ResourceFunction["PolygonInterpolation"][star, vals, {0.2, 0.4}]
Out[13]=

Evaluate the interpolant at multiple points:

In[14]:=
ResourceFunction[
 "PolygonInterpolation"][star, vals, {{0.2, 0.4}, {-0.6, 1.1}, {2.1, -1.7}}]
Out[14]=

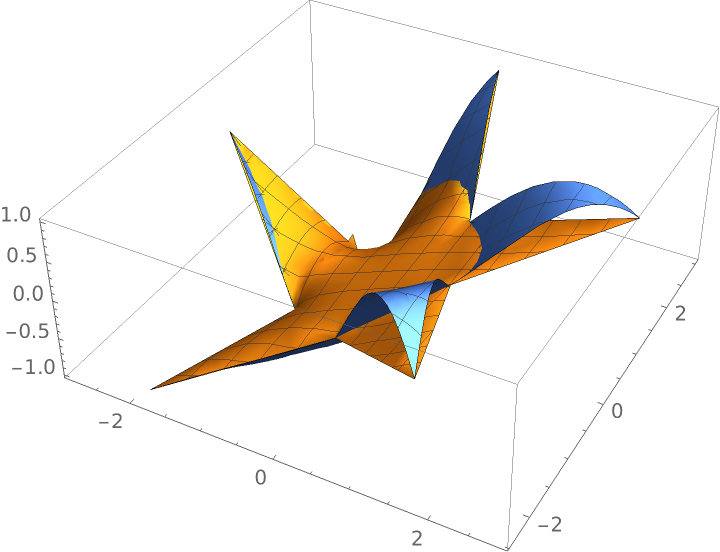
Plot the interpolant along with the original function over the star-shaped polygon:

In[15]:=
Plot3D[{ResourceFunction["PolygonInterpolation"][star, vals, {x, y}], Sin[x - Cos[y]]}, {x, y} \[Element] star]
Out[15]=

Applications (3) 

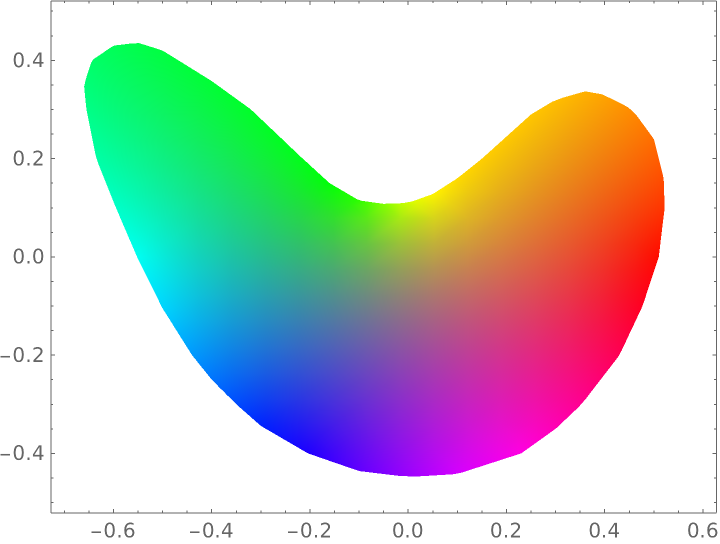
Vertices for a bean-shaped polygon, and colors specified as RGB components:

In[16]:=
bean = CompressedData["
1:eJxTTMoPSmViYGDQBmIQDQOaMf2HvmrssZ81EwRW7r957nvw46W7ofyd+wtt
ua4vLthrXy2yzv1h1ZH9xmBw2B6i78x+sLTtKaj8Faj8Zaj+m/u3ff57peLl
NXuIbQ/2P6wCKbwFlX+4v3Gqc3fO89v2EH2P97e+Dtwh13rb/jzIGbOf7Iea
Yy8Plni6Pw0Mrtl/0wA54AncviCgrteBMPUn7cHO4noM5e+0dwHa8nvlw/0M
KADmnl37If65A9MPsxeq/gLMXph9cDprT8lkCZZr+1+qGXKskTkF1wcLP6j/
4PZWghXegbur1t40bpfnHWg4n4WHG8xfMHtTrO/7906/Zg+zFxZOMPfu8uRh
0m6/B483SHg8sIfZ65ckEGG55QFM3n5JAcjCB7B4hcWPPVjbjnP2J8v2zZfS
v2uPFp/QeLgKDd/r9kcVNhRlTLwKVwdNB1DzLtiDQjWm/xLMnfbgYI45bw9L
RzBxmLtg7oGmR/s/Kz9e8k06YA8AP2hH7g==
"];
cols = CompressedData["
1:eJxTTMoPSmViYGDQBmJmIH68dPYRhQ2v7BnA4AOUZmBg0m4Xu3nuPoZ41p6S
yRIsxzDEUcEH+zeBO+RaXy+0Rxc35FgjE5WyG0P8/PdgkFMwxCe+rbE3jTuF
IR4EMj7wAoa49X3/3ul5lzDEJVnC+HQ3XcUQn+bcnfP8900McaHmA6cWut7D
EPcx73RMePoAQ1z59s+6rD1PMMRLgaEVxvcShzvfwcVxxYMxGDzGEC/OAIXM
XQxxsPMuXMIQ/7D8mLd550G4eAjYwgMY7goAukqo+QaGuP5dFbbGqY8xxPsP
fdWI6X+FIY5u/5+VHy/5Jr3BEOcBJ7RnGOKQ8H+Ew99XMcQXSIFciPDfLk+Q
ycsw3PX0ghIwpjDTE9h7zpcxxIGJDJjSbmOIS4MD5CGGeLXIOveHVZjpYN98
kAOfYYhfX1xgy3X9OYb42TMg8AJDHOJ/zPQkfvMcMAdhim+a+x4Y868xxAUi
LLecKEOkPwA/Z+EF
"];

Visualize the polygon colored using PolygonInterpolation:

In[17]:=
RegionPlot[{x, y} \[Element] Polygon[bean], {x, -0.7, 0.6}, {y, -0.5, 0.5}, AspectRatio -> Automatic, BoundaryStyle -> None, ColorFunction -> (RGBColor[
     Clip[ResourceFunction["PolygonInterpolation"][bean, cols, {#1, #2}], {0, 1}]] &), ColorFunctionScaling -> False]
Out[17]=

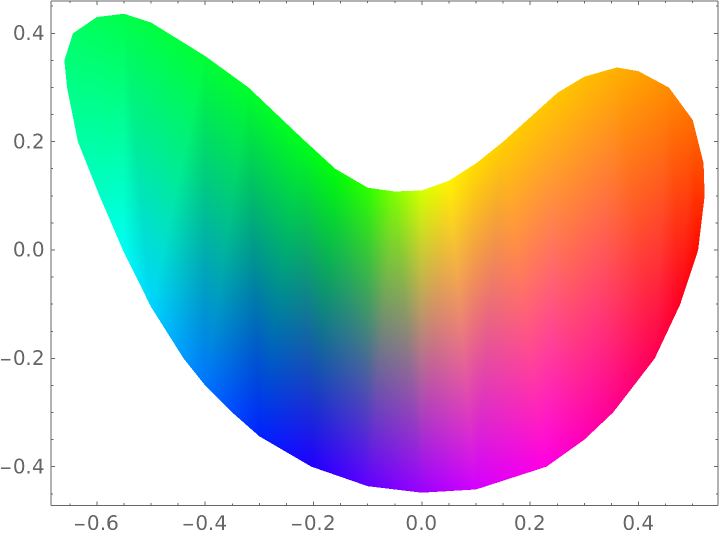
Compare with the result of using the VertexColors option of Polygon:

In[18]:=
Graphics[Polygon[bean, VertexColors -> (RGBColor @@@ cols)], Frame -> True]
Out[18]=

Neat Examples (4) 

Define a polygon using FindShortestTour over grid points:

In[19]:=
points = Tuples[Range[8], {2}];
poly = Polygon[p[[Last[FindShortestTour[p]]]]];

See the polygon:

In[20]:=
Graphics[poly]
Out[20]=

Define an arbitrary function and map it over all the vertices:

In[21]:=
vals = Max[#] - Min[#] & /@ First[poly]
Out[21]=

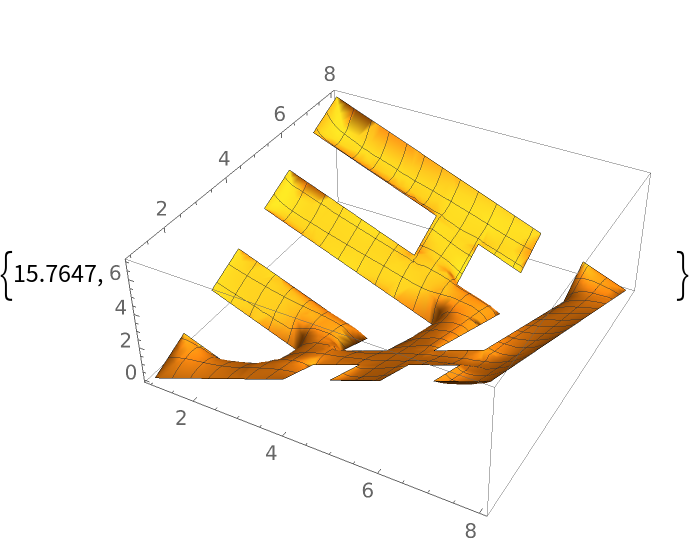
For 64 vertices, visualizing the results takes a few seconds:

In[22]:=
AbsoluteTiming@
 Plot3D[ResourceFunction["PolygonInterpolation"][poly, vals, {x, y}], {x, y} \[Element] poly]
Out[22]=

Version History

  • 1.0.0 – 14 January 2021

Source Metadata

Related Resources

Author Notes

The implementation of mean value coordinates used currently only works for simple polygons. An extension to polygons with holes is planned.

License Information