Wolfram Function Repository
Instant-use add-on functions for the Wolfram Language
Function Repository Resource:
Import data from the New York Times COVID-19 United States county-by-county data
ResourceFunction["NYTimesCOVID19Data"][type] retrieve the specified data type from the New York Times Github repository. |
Retrieve a formatted dataset with the latest ten thousand data points:
| In[1]:= |
| Out[1]= |
Get the twenty entries with the most deaths:
| In[2]:= |
| Out[2]= | 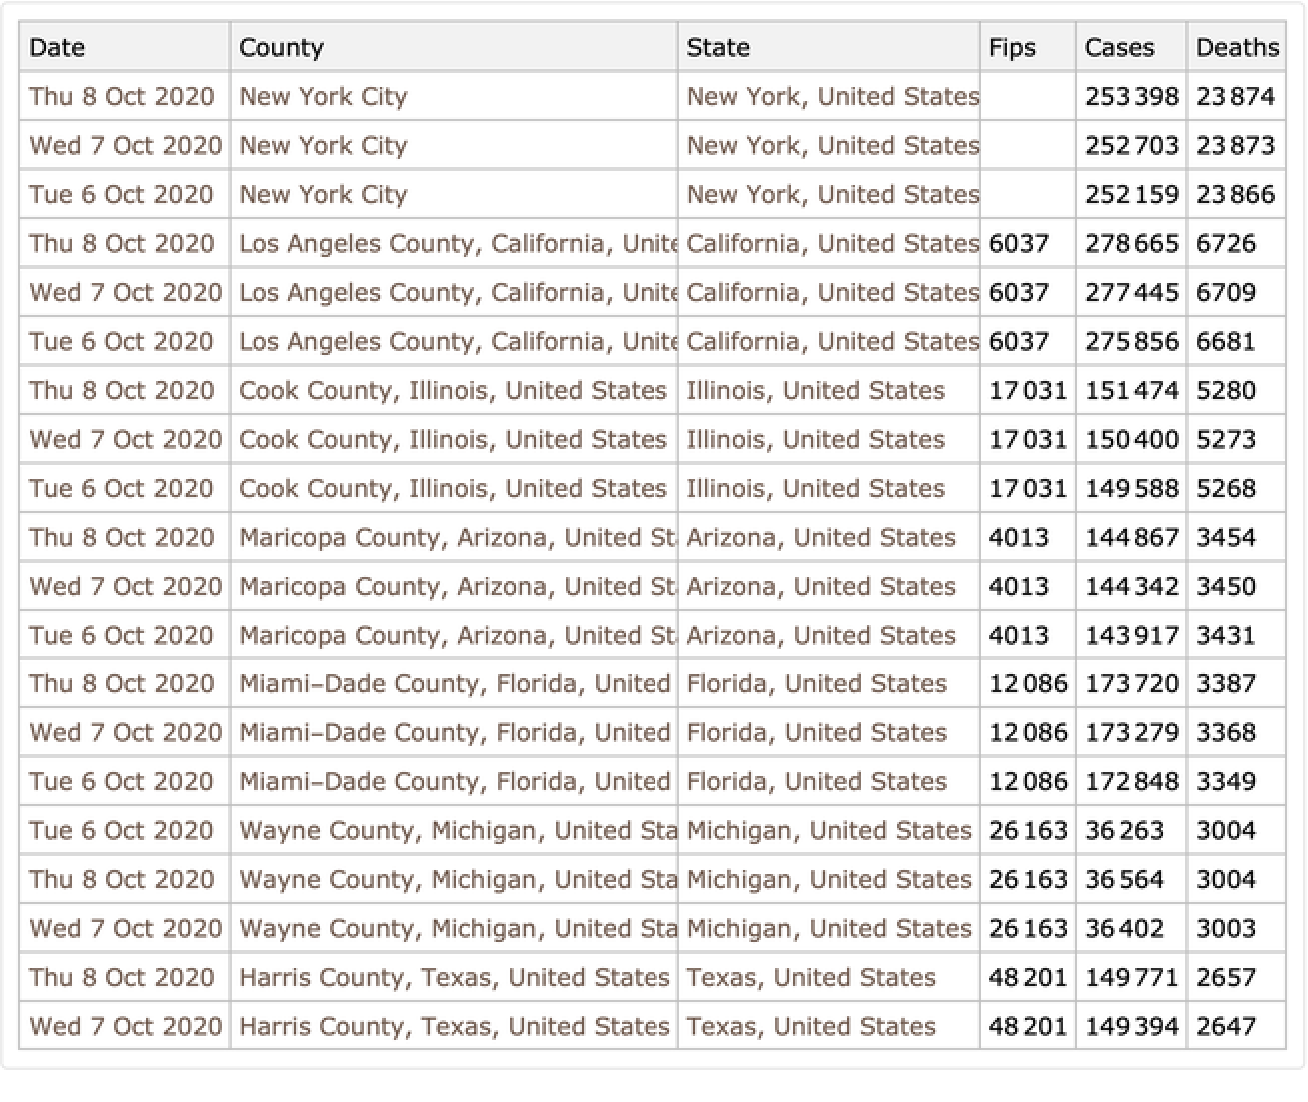 |
Show each county only once:
| In[3]:= |
| Out[3]= | 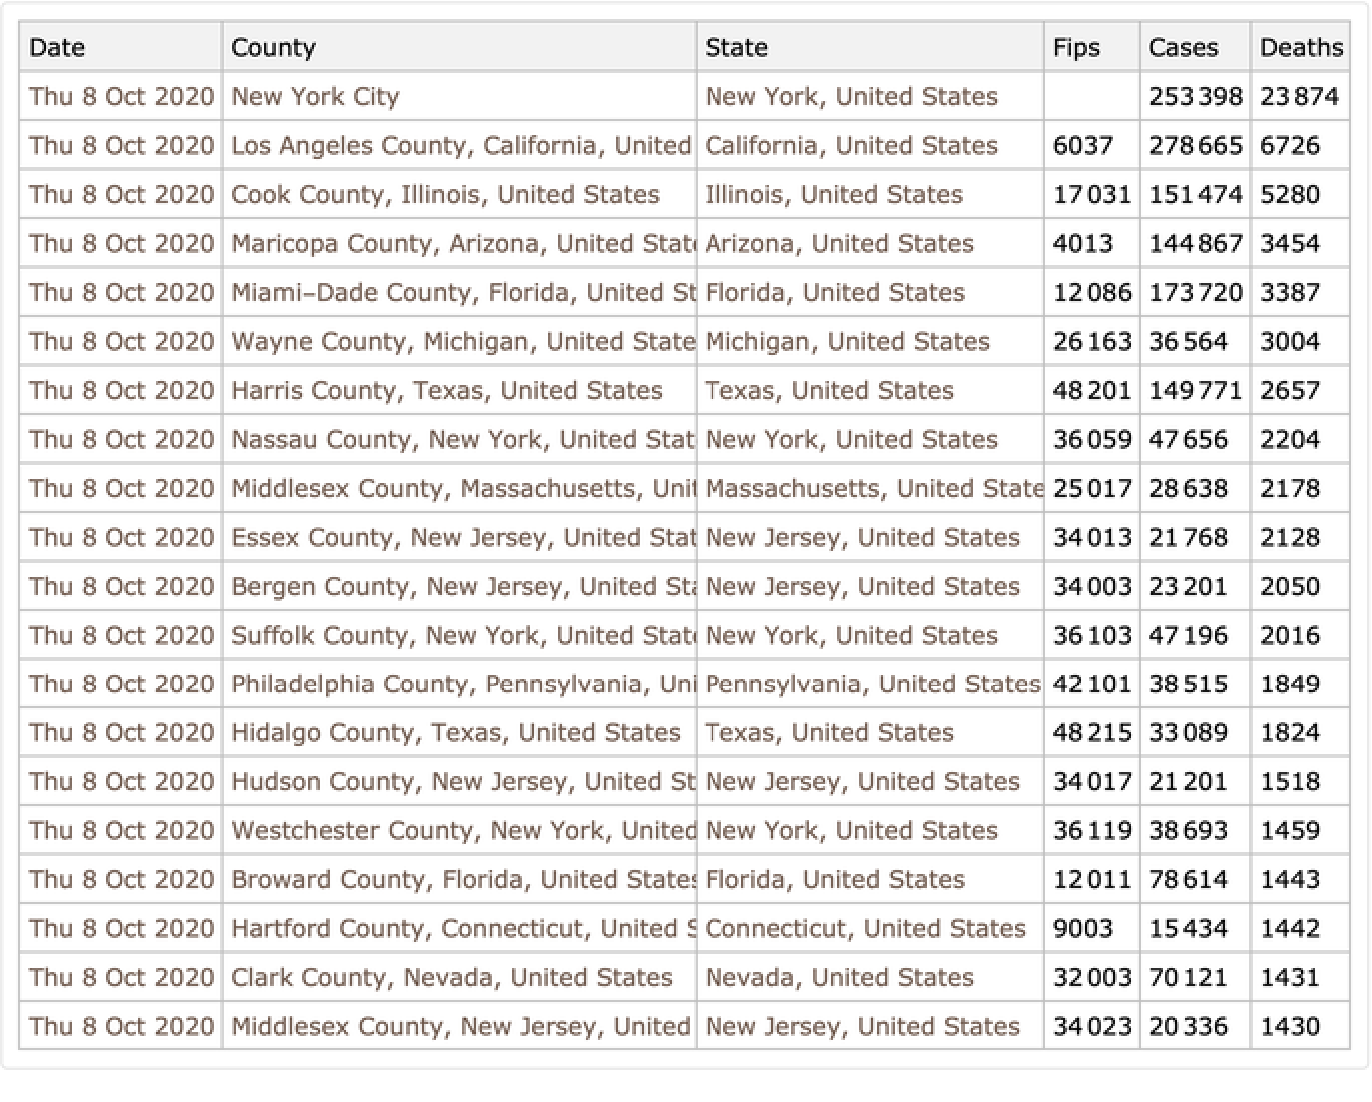 |
Get the full time series data for each state:
| In[4]:= |
| Out[4]= |
| In[5]:= |
| Out[5]= | 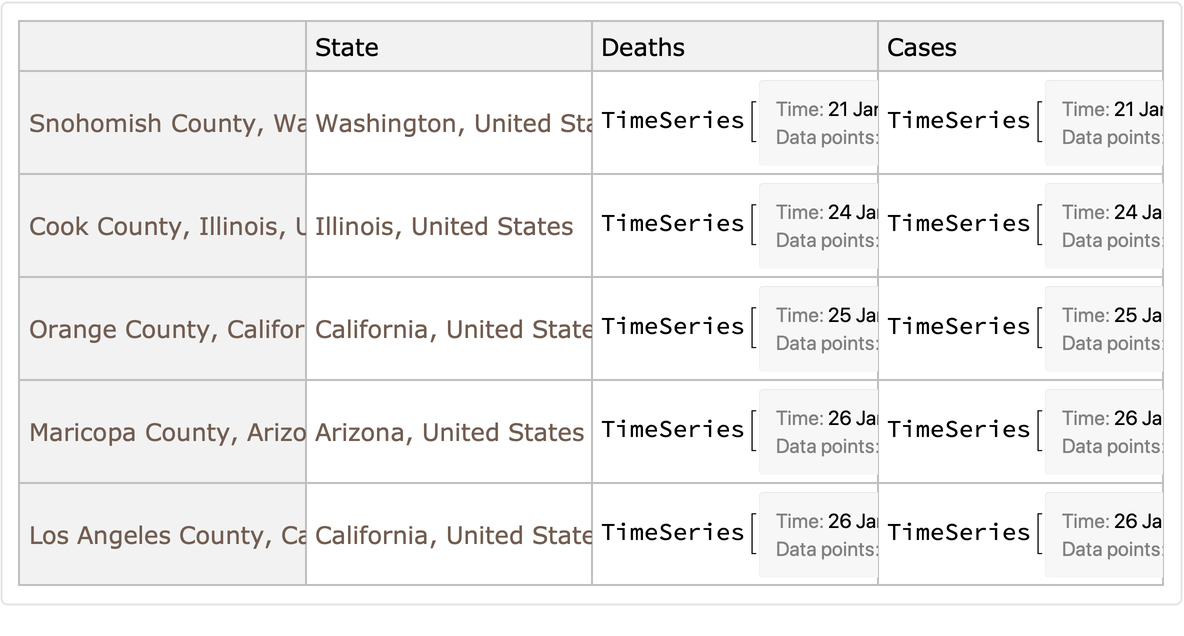 |
Plot the number of deaths over time for the ten counties with the most deaths:
| In[6]:= |
| Out[6]= | 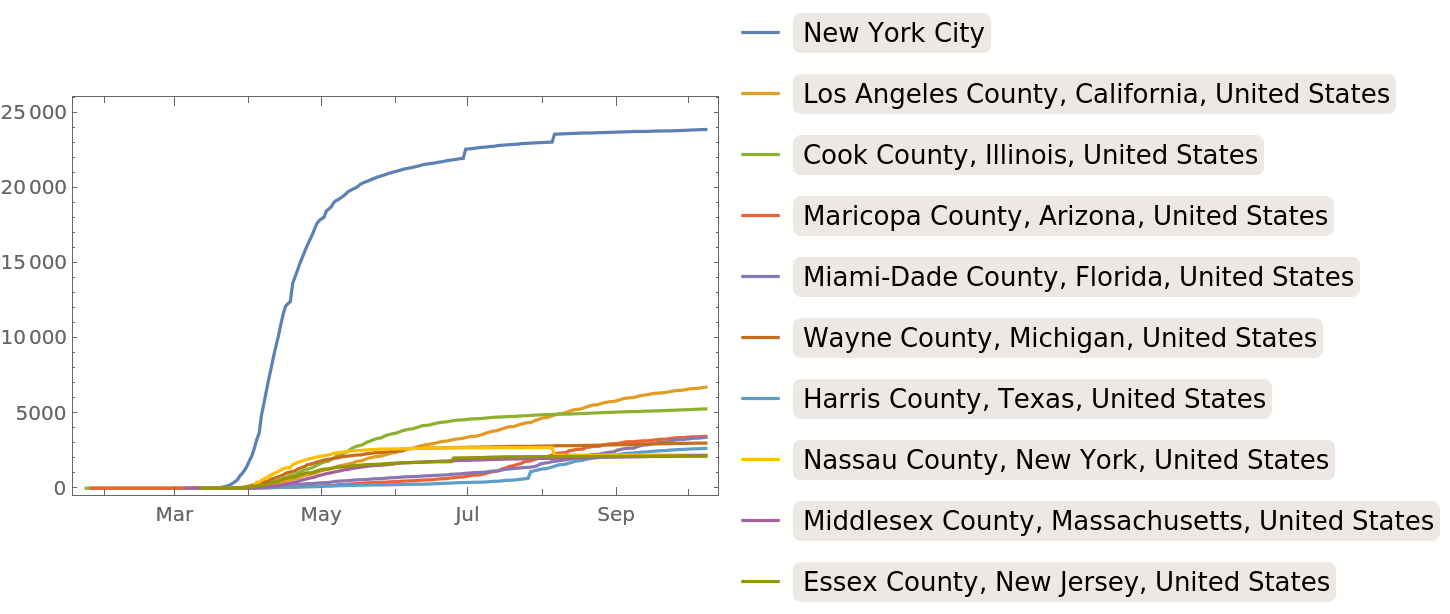 |
Plot the number of cases:
| In[7]:= |
| Out[7]= | 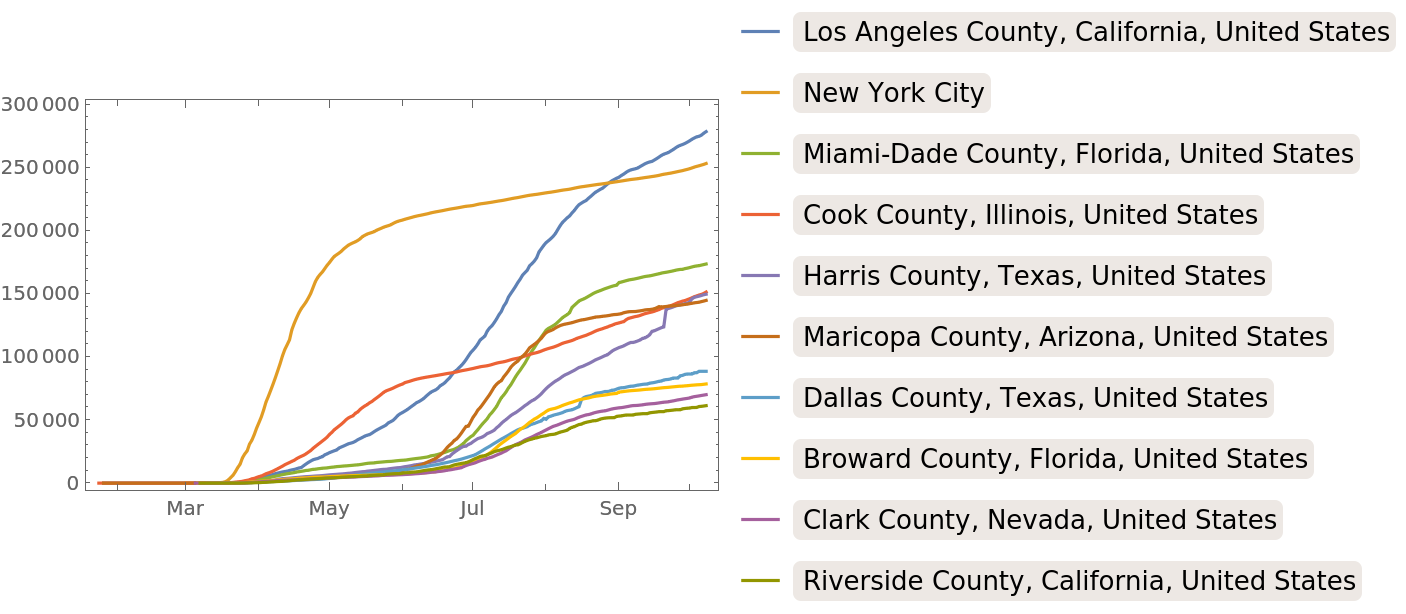 |
Create a map of case density in each county:
| In[8]:= | ![countyLatestCaseCounts = ResourceFunction["NYTimesCOVID19Data"]["USCountiesTimeSeries", MaxItems -> 100000][All, #Cases["LastValue"] &];](https://www.wolframcloud.com/obj/resourcesystem/images/3a6/3a66575b-a224-43de-86ce-2a21c364a87f/2935131226d0a492.png) |
| In[9]:= | ![GeoRegionValuePlot[
Normal@countyLatestCaseCounts[Select[IntegerQ]],
PlotLegends -> Automatic,
GeoRange -> Entity["Country", "UnitedStates"]
]](https://www.wolframcloud.com/obj/resourcesystem/images/3a6/3a66575b-a224-43de-86ce-2a21c364a87f/45ebf59b32dc2324.png) |
| Out[9]= | 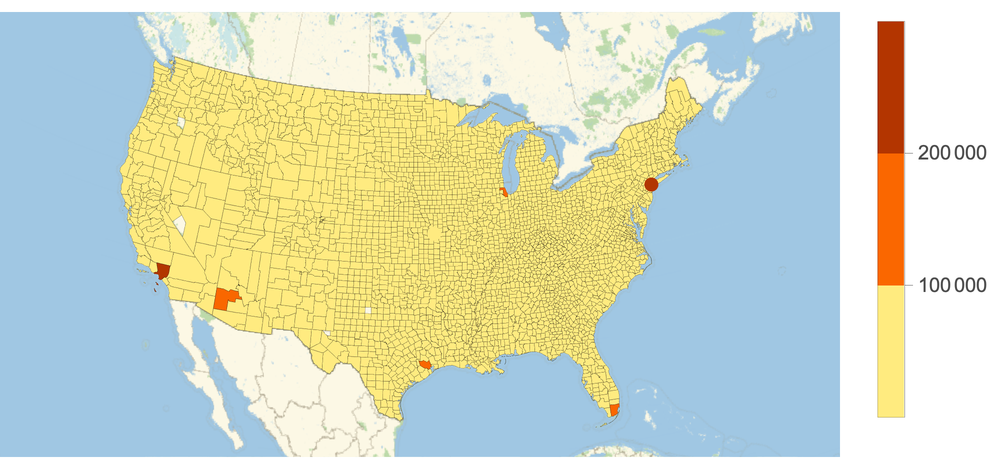 |
Filter out cases from Florida:
| In[10]:= | ![floridaCases = ResourceFunction["NYTimesCOVID19Data"]["USCountiesTimeSeries"][
Select[#State === Entity["AdministrativeDivision", {"Florida", "UnitedStates"}] &], "Cases"];](https://www.wolframcloud.com/obj/resourcesystem/images/3a6/3a66575b-a224-43de-86ce-2a21c364a87f/7cff90c6399788d4.png) |
| In[11]:= | ![DateListLogPlot[
floridaCases[
KeyMap[StringTrim[First@StringSplit[CommonName@#, ","], " County"] &]],
PlotRange -> All, PlotLegends -> Automatic, PlotLabel -> "COVID-19 cases in Florida by county"
]](https://www.wolframcloud.com/obj/resourcesystem/images/3a6/3a66575b-a224-43de-86ce-2a21c364a87f/02bea86162b94993.png) |
| Out[11]= | 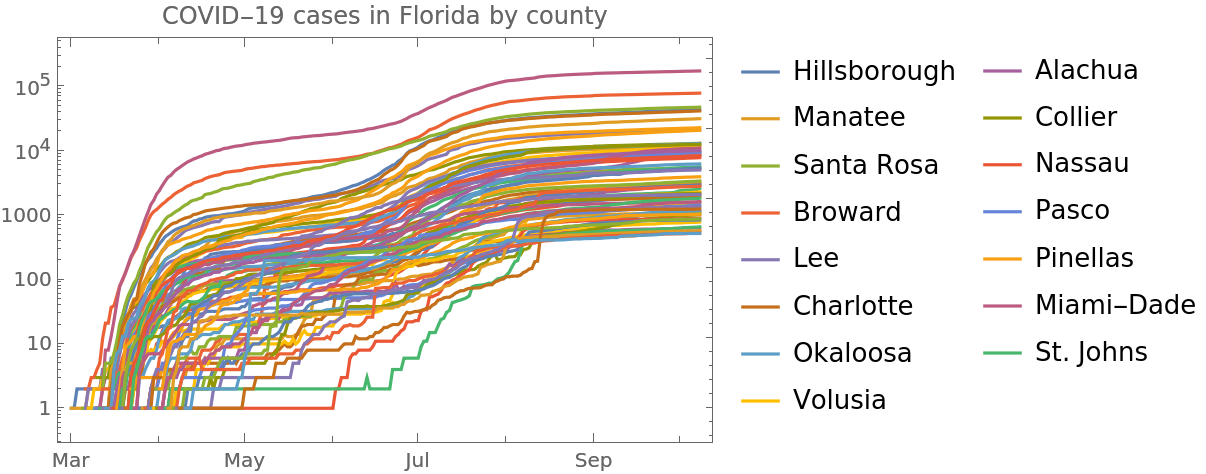 |
NYTimesCOVID19Data relies on the Entity framework to provide some caching. This can be slow on the first usage in each session:
| In[12]:= |
| Out[12]= |
The second evaluation uses the cache for improved speed:
| In[13]:= |
| Out[13]= |
This work is licensed under a Creative Commons Attribution 4.0 International License