Wolfram Function Repository
Instant-use add-on functions for the Wolfram Language
Function Repository Resource:
Plot a list of vectors in space
ResourceFunction["PlotVector3D"][{{x1,y1,z1},{x2,y2,z2},…}] plots the vectors {xi,yi,zi}, each located at the origin. | |
ResourceFunction["PlotVector3D"][{{x1,y1,z1},{x2,y2,z2},…},{p,q,r}] plots the vectors {xi,yi,zi}, each located at the point {p,q,r}. | |
ResourceFunction["PlotVector3D"][{{{x1,y1,z1},{p1,q1,r1}},{{x2,y2,z2},{p2,q2,r2}},…}] plots the vectors {xi,yi,zi} located at the corresponding points {pi,qi,ri}. | |
ResourceFunction["PlotVector3D"][{{x1,y1,z1},{x2,y2,z2},…},{{p1,q1,r1},{p2,q2,r2},…}] plots the vectors {xi,yi,zi} located at the corresponding points (pi,qi,r1}. |
| "ArrowSize" | Large | specifies the size of the arrowhead |
| "LocatedVector" | False | whether to draw vectors from the initial point (the first point of the list) |
| VectorStyle | RGBColor[.3,.4,.7] | specifes the style of the vector |
Plot the vector (1,1,1) located at the origin:
| In[1]:= |
| Out[1]= | 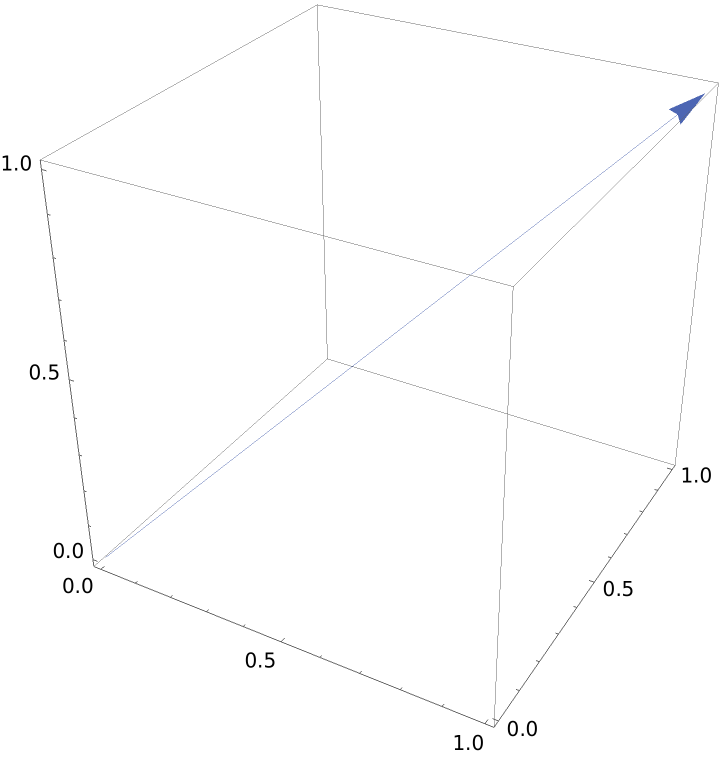 |
Plot a list of vectors located at the origin:
| In[2]:= |
| Out[2]= | 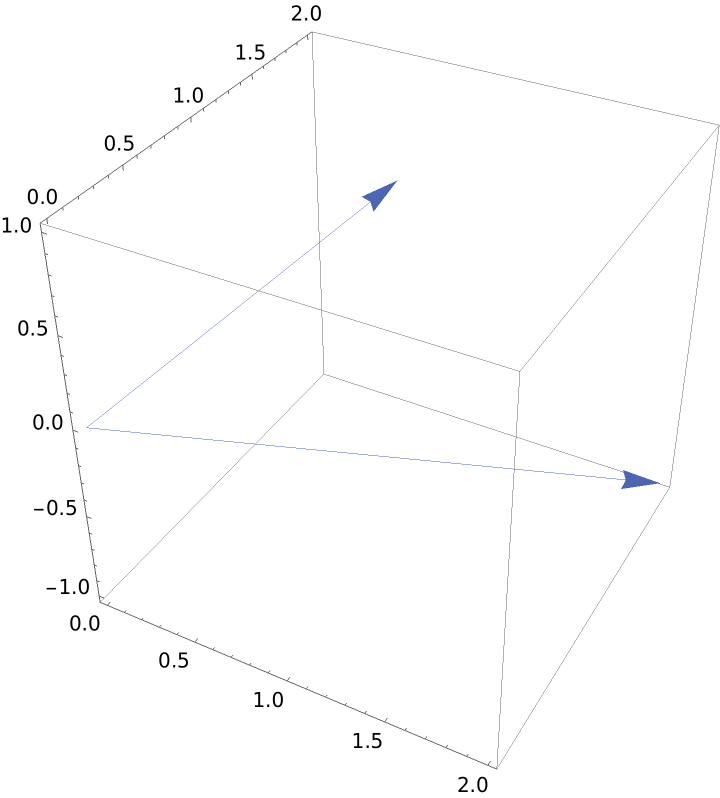 |
Plot the vector (2,2,2) located at the point {-1,1,1}:
| In[3]:= |
| Out[3]= | 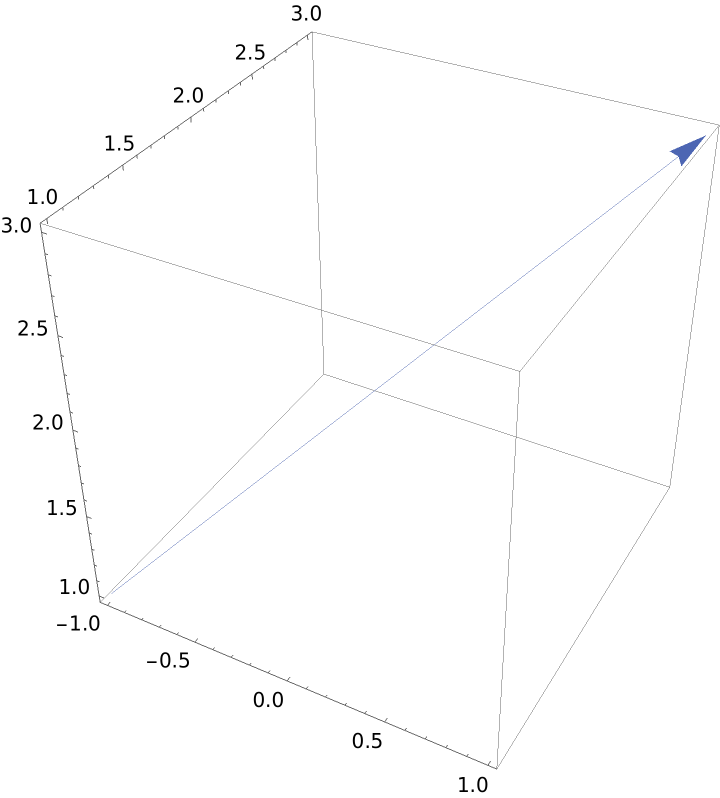 |
Plot a list of vectors located at the point {1,2,2}:
| In[4]:= |
| Out[4]= | 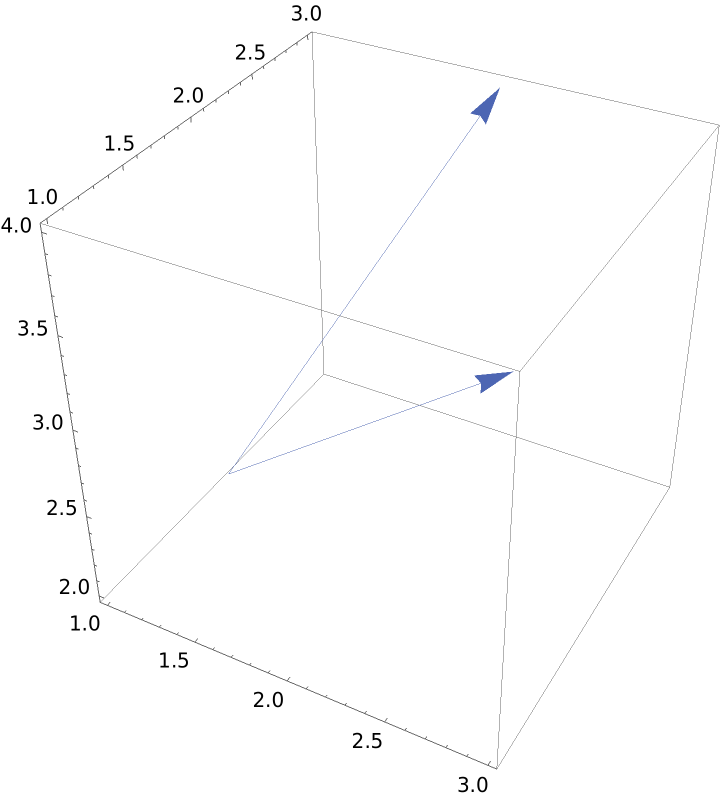 |
Plot a list of vectors located at different points. The first list is a list of vectors and the second is a list of initial points:
| In[5]:= |
| Out[5]= | 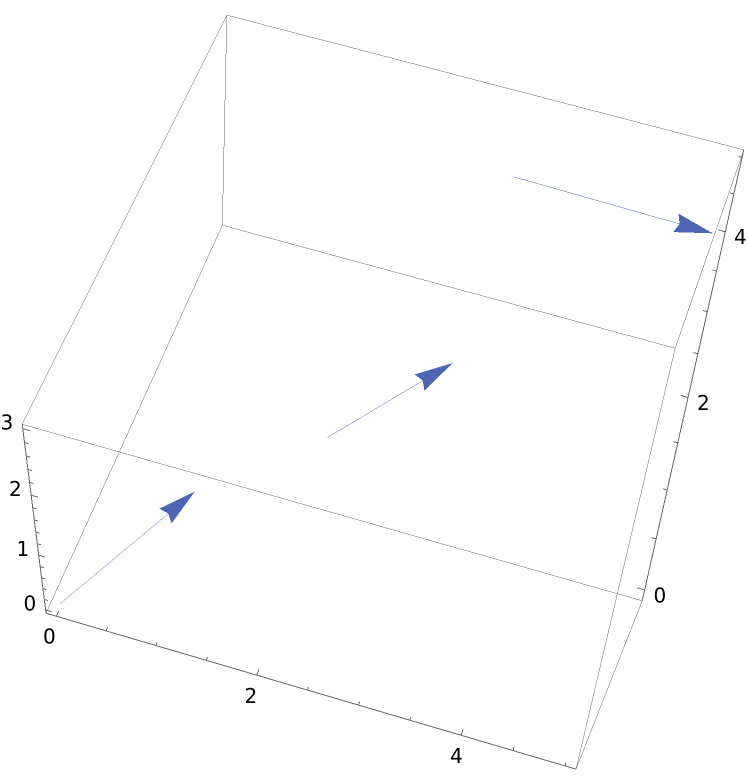 |
The length of the list of vectors must be the same as the length of the list of initial points:
| In[6]:= |
Change the arrow size of each vector:
| In[7]:= |
| Out[7]= | 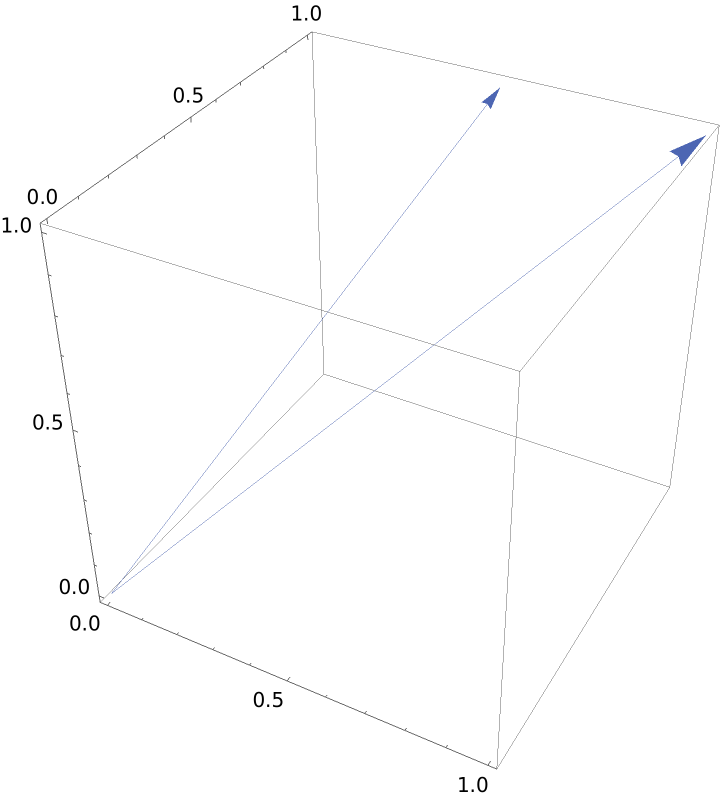 |
A located vector from the first point to the second point:
| In[8]:= |
| Out[8]= | 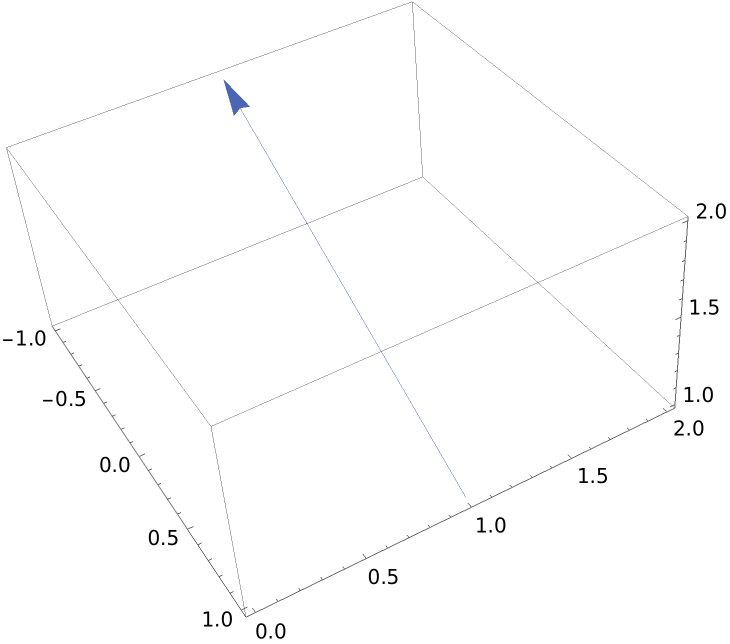 |
Setting "LocatedVector" to False draws the vector located at the origin:
| In[9]:= |
| Out[9]= | 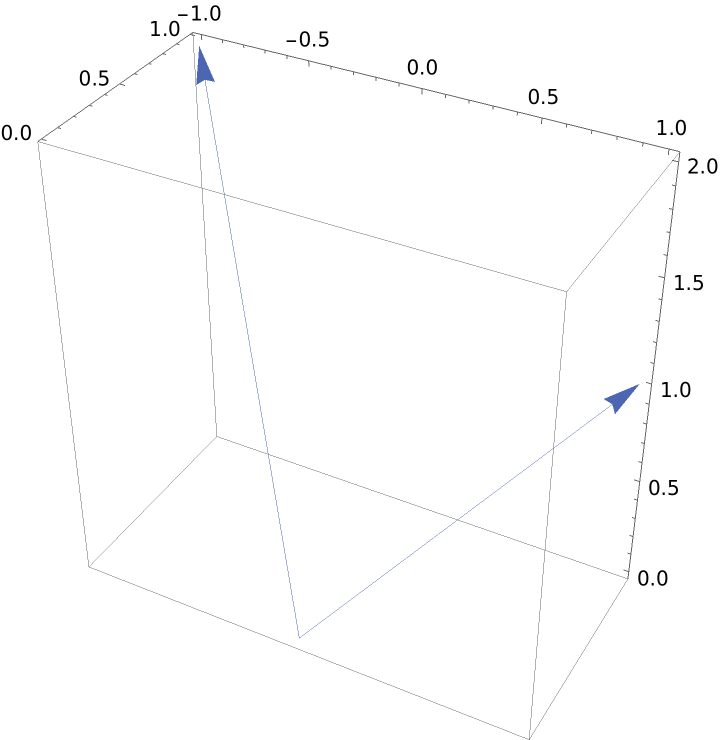 |
A list of lists of pairs of vectors with the option "LocatedVector"→True draws located vectors from the first point in each sublist to the second point in each sublist:
| In[10]:= |
| Out[10]= | 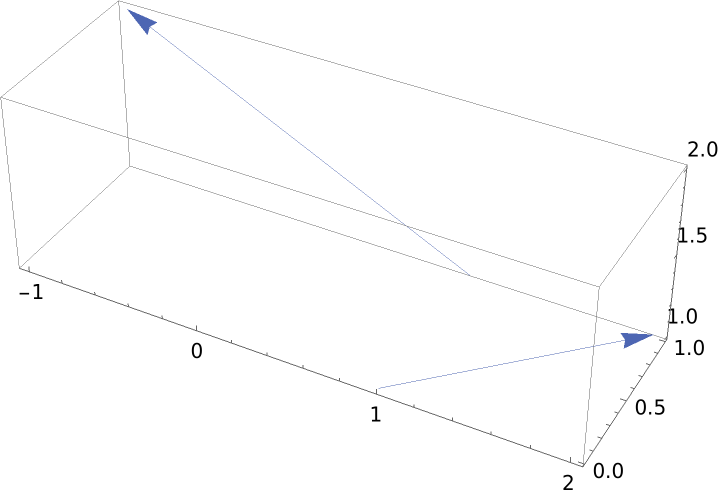 |
Without the option being set, the second tuple in each list gives the located point, and the first tuple gives the direction:
| In[11]:= |
| Out[11]= | 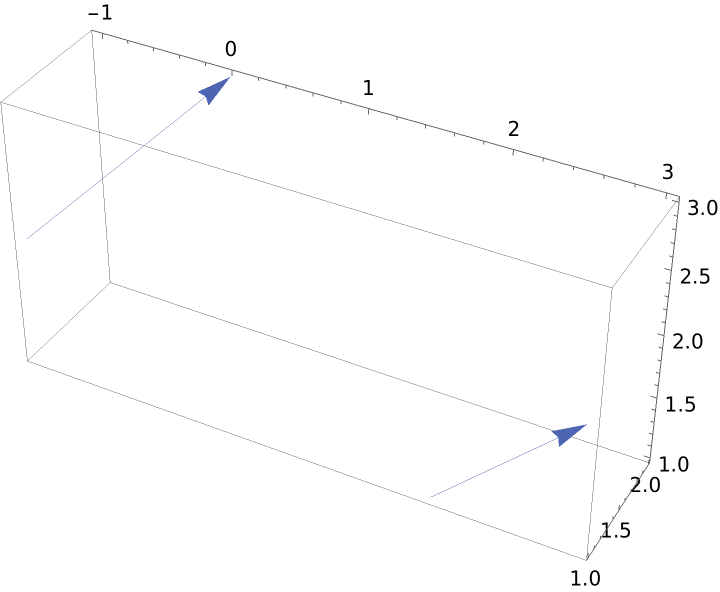 |
Change the style of the vectors:
| In[12]:= |
| Out[12]= | 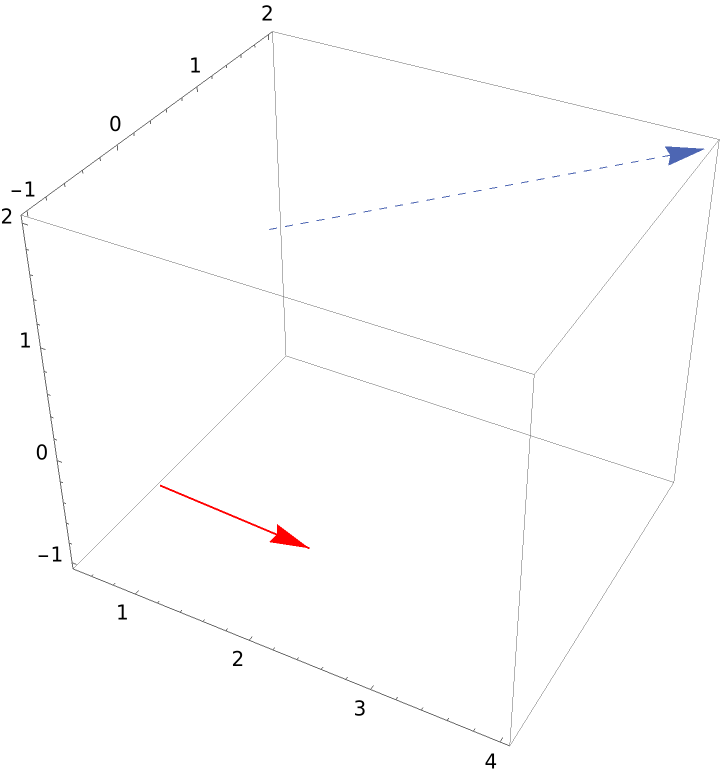 |
Set both the arrow size and style for each vector:
| In[13]:= |
| Out[13]= | 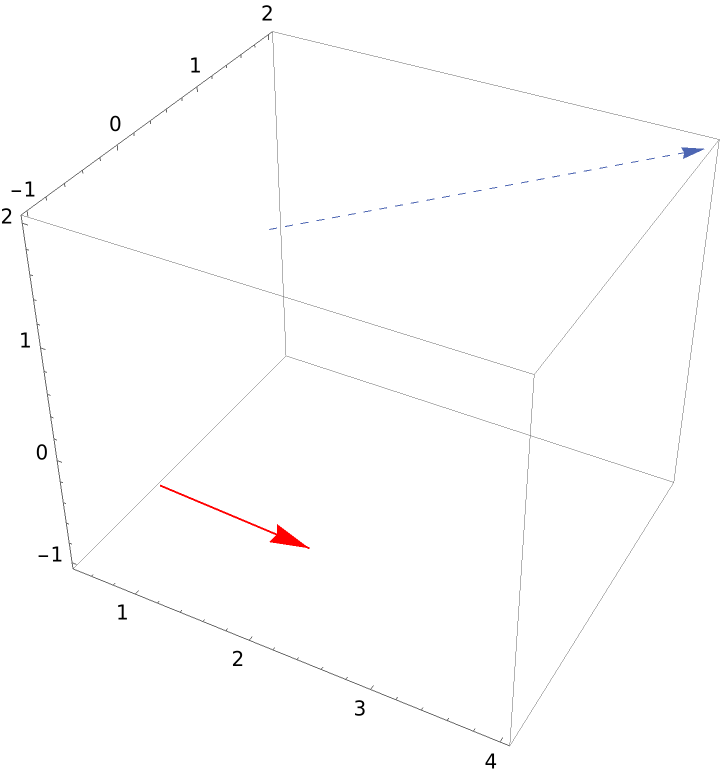 |
You can specify a vector located at a point using the second, third and fourth templates:
| In[14]:= | ![(* Evaluate this cell to get the example input *) CloudGet["https://www.wolframcloud.com/obj/0e99c7ee-e74f-4bdc-b59b-cddcc6f51eda"]](https://www.wolframcloud.com/obj/resourcesystem/images/3a2/3a29f421-e46a-4898-b31c-2bc890dc0c62/45985e2c71a329ab.png) |
| Out[14]= | 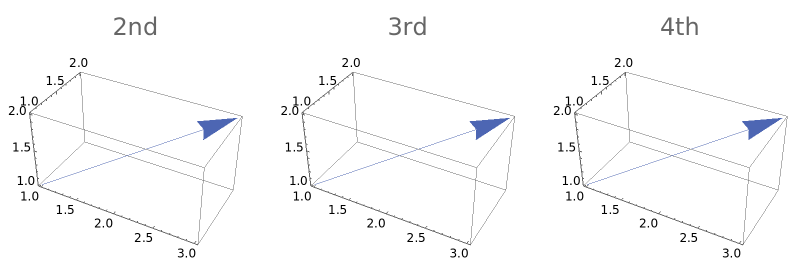 |
Use Arrow to produce any of these plots:
| In[15]:= |
| Out[15]= | 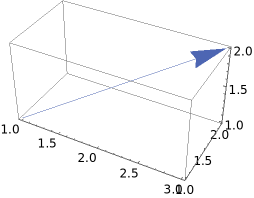 |
This work is licensed under a Creative Commons Attribution 4.0 International License