Wolfram Function Repository
Instant-use add-on functions for the Wolfram Language
Function Repository Resource:
Conveniently display two-dimensional data in a nicely styled grid
ResourceFunction["PrettyGrid"][data] displays the elements of data in an autostyled two-dimensional grid. |
| lists | {expr1,expr2,…} |
| associations | <|k1→v1,k2→v2,…|> |
| matrices | {{expr11,expr12,…},{expr21,expr22,…},…} |
| list of rules | {k1→v1,k2→v2,…} |
| list of lists of rules | {{k11→v11,…},{k21→v21,…},…} |
| list of associations | {<|k11→v11,…|>,<|k21→v21,…|>…} |
| Alignment | Left | horizontal alignment of items |
| "BaseFontSize" | Default | the font size used in BaseStyle of the grid |
| "ColumnHeadings" | Automatic | the headers used for the columns |
| PlotTheme | "Monochrome" | format the grid with a predefined set of styles |
| "RowHeadings" | Automatic | the headers used for the rows |
| Spacings | Automatic | this spec is passed directly to Grid |
 | "Monochrome" |
 | "Minimal" |
 | "Detailed" |
 | "Marketing" |
PrettyGrid displays matrices with formatting by default:
| In[1]:= |
| Out[1]= | 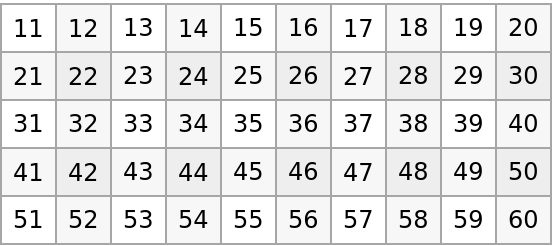 |
PrettyGrid accepts mixed lists of lists of rules and associations:
| In[2]:= | ![ResourceFunction[
"PrettyGrid"][{{"Apples" -> 3, "Pears" -> 0, "Oranges" -> 2}, {"Apples" -> 1, "Pears" -> 6, "Oranges" -> 3}, <|
"Apples" -> 3, "Pears" -> 2, "Oranges" -> 1|>}, PlotTheme -> "Detailed"]](https://www.wolframcloud.com/obj/resourcesystem/images/3a2/3a28eafc-d397-4f77-ba35-7ea83e797969/0662e2aaa7e9fc94.png) |
| Out[2]= | 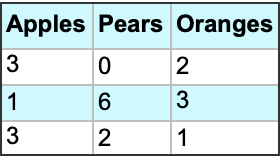 |
PrettyGrid works on both rectangular and ragged matrices:
| In[3]:= |
| Out[3]= | 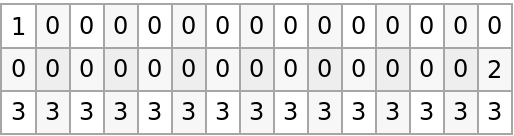 |
PrettyGrid works on certain datasets:
| In[4]:= |
| Out[5]= | 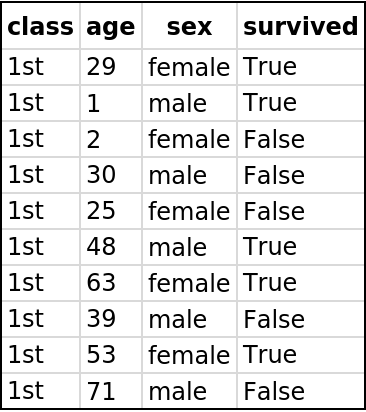 |
PrettyGrid works on ragged arrays:
| In[6]:= |
| Out[6]= | 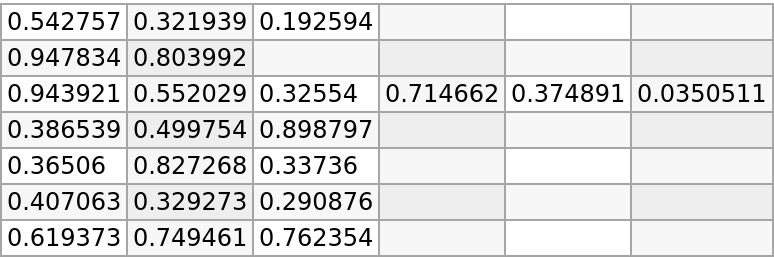 |
PrettyGrid attempts to infer headings from the table's content:
| In[7]:= | ![ResourceFunction[
"PrettyGrid"]@{<|"Apples" -> 1, "Pears" -> 2, "Oranges" -> 3|>, <|
"Apples" -> 2, "Oranges" -> 4, "Bananas" -> 2|>, <|"Oranges" -> 2, "Pears" -> 3, "Bananas" -> 9|>}](https://www.wolframcloud.com/obj/resourcesystem/images/3a2/3a28eafc-d397-4f77-ba35-7ea83e797969/68d3452c3d2aee86.png) |
| Out[7]= |  |
PrettyGrid also works with nested associations:
| In[8]:= | ![ResourceFunction[
"PrettyGrid"]@<|
"Monday" -> <|"Apples" -> 1, "Pears" -> 2, "Oranges" -> 3|>, "Tuesday" -> <|"Apples" -> 2, "Oranges" -> 4, "Bananas" -> 2|>, "Wednesday" -> <|"Oranges" -> 2, "Pears" -> 3, "Bananas" -> 9|>|>](https://www.wolframcloud.com/obj/resourcesystem/images/3a2/3a28eafc-d397-4f77-ba35-7ea83e797969/2d2a759d7760f665.png) |
| Out[8]= | 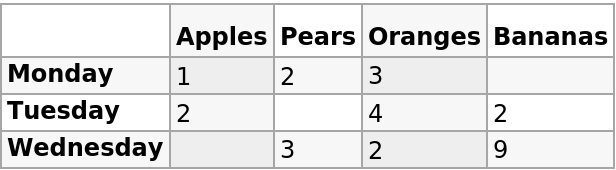 |
PrettyGrid takes an Alignment option for controlling horizontal item‐wise alignments:
| In[9]:= | ![Manipulate[
ResourceFunction[
"PrettyGrid"][{<|"Apples" -> 1, "Pears" -> 2, "Oranges" -> 3|>, <|
"Apples" -> 2, "Oranges" -> 4, "Bananas" -> 2|>, <|"Oranges" -> 2,
"Pears" -> 3, "Bananas" -> 9|>},
Alignment -> a, "BaseFontSize" -> 14], {a, {Left, Center, Right}}]](https://www.wolframcloud.com/obj/resourcesystem/images/3a2/3a28eafc-d397-4f77-ba35-7ea83e797969/383fa7c9f58b5eaa.png) |
| Out[9]= | 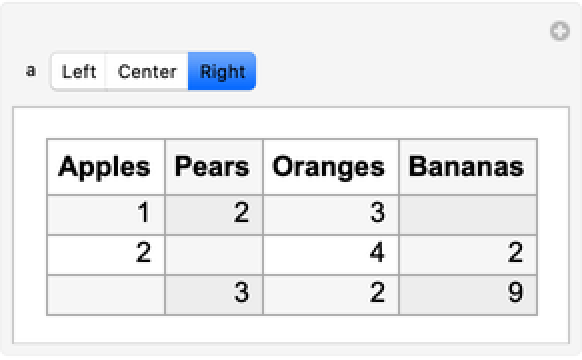 |
PrettyGrid takes an optional list of "ColumnHeadings" and "RowHeadings":
| In[10]:= | ![d = Table[RandomInteger[100], {i, 5}, {j, 3}];
ResourceFunction["PrettyGrid"][d, "ColumnHeadings" -> {"A", "B", "C"},
"RowHeadings" -> {"1", "2", "3", "4"}, "BaseFontSize" -> 14]](https://www.wolframcloud.com/obj/resourcesystem/images/3a2/3a28eafc-d397-4f77-ba35-7ea83e797969/43a5fc2f2f959d06.png) |
| Out[11]= | 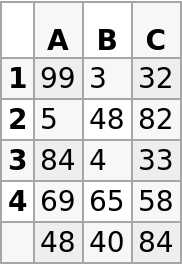 |
PrettyGrid has the Spacings option:
| In[12]:= | ![d = RandomInteger[100, {5, 3}];
Manipulate[
ResourceFunction["PrettyGrid"][d\[Transpose], "RowHeadings" -> {"A", "B", "C"}, Spacings -> {xs, ys}] , {{xs, 2}, 0, 4}, {{ys, 1}, 0, 4}]](https://www.wolframcloud.com/obj/resourcesystem/images/3a2/3a28eafc-d397-4f77-ba35-7ea83e797969/79f03b2ef1f18ca4.png) |
| Out[12]= | 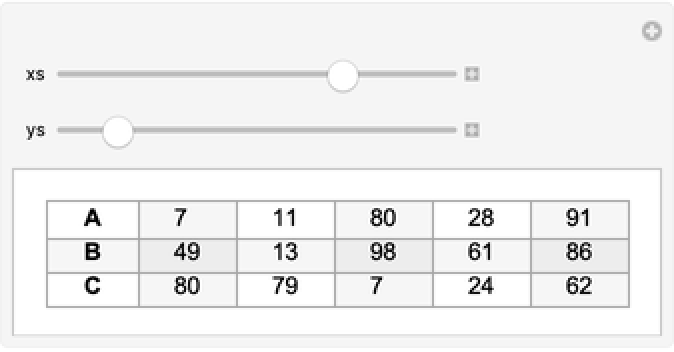 |
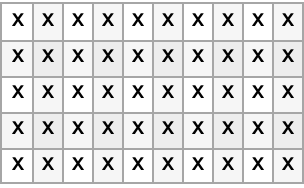
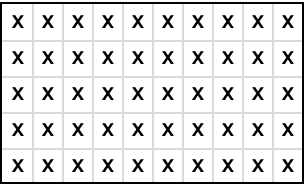
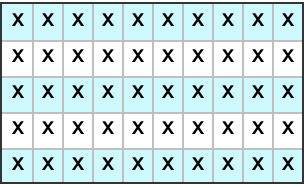
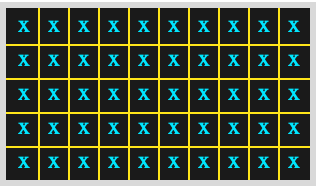
Compare the four available settings for the PlotTheme option:
| In[13]:= | ![r = RandomInteger[{1, 100}, {5, 12}]; Manipulate[
ResourceFunction["PrettyGrid"][r, PlotTheme -> plotTheme], {plotTheme, {"Detailed", "Marketing", "Minimal", "Monochrome" }}]](https://www.wolframcloud.com/obj/resourcesystem/images/3a2/3a28eafc-d397-4f77-ba35-7ea83e797969/41eb08011e20d06b.png) |
| Out[13]= | 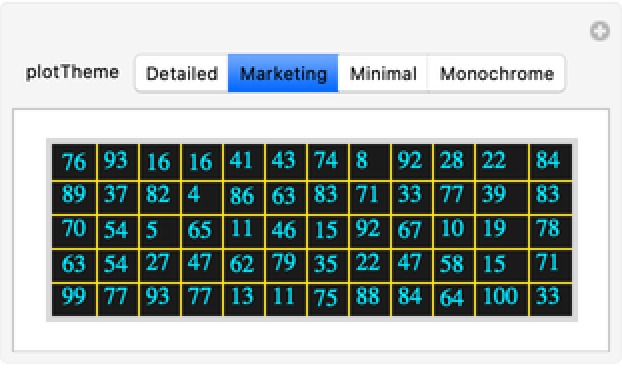 |
For small 2D data, Dataset does similar things, but sometimes does not format as expected:
| In[14]:= |
| Out[12]= | 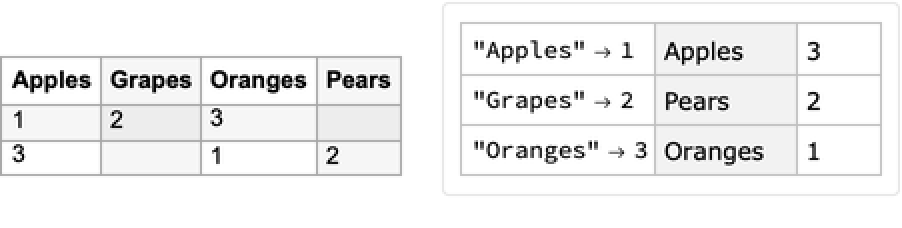 |
This work is licensed under a Creative Commons Attribution 4.0 International License