Wolfram Function Repository
Instant-use add-on functions for the Wolfram Language
Function Repository Resource:
A version of ListPlot that displays two lists of data with different y axes
ResourceFunction["MultipleAxesListPlot"][{data1,data2}] generates a plot of the data with two y axes. |
Plot two datasets together but with different y-axes:
| In[1]:= |
| Out[1]= | 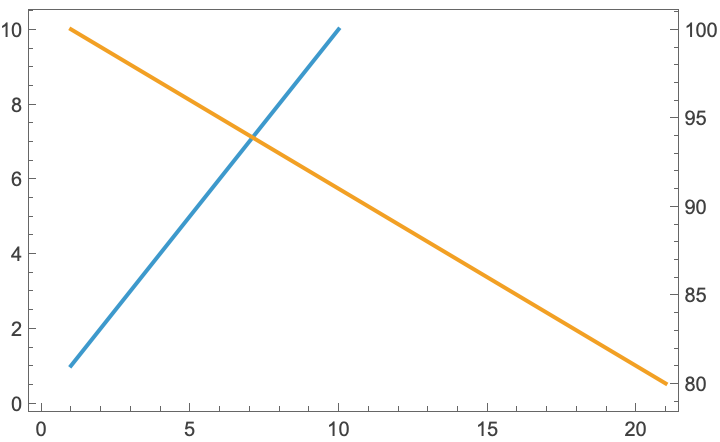 |
Data can be a one-dimensional list or pairs of {x,y}-values:
| In[2]:= | ![ResourceFunction[
"MultipleAxesListPlot", ResourceSystemBase -> "https://www.wolframcloud.com/obj/resourcesystem/api/1.0"][{
{{0, 0}, {10, 10}},
{{0, 101}, {10, 100}}
}, Joined -> True]](https://www.wolframcloud.com/obj/resourcesystem/images/38c/38c2a24c-960e-44e5-a169-552c16b71959/6736a79703dc2f6d.png) |
| Out[2]= | 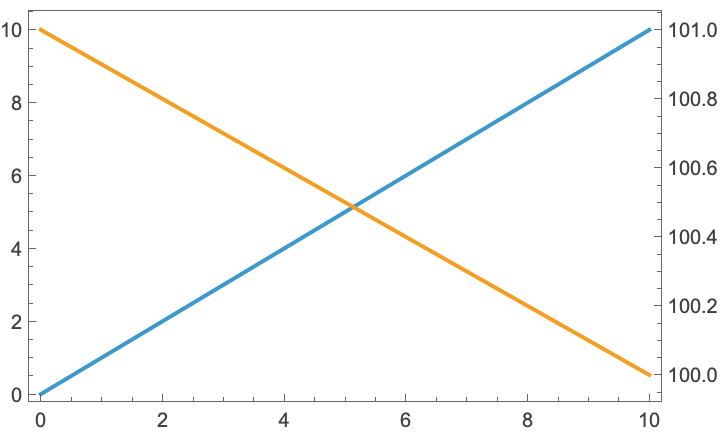 |
To make clearer which axis refers to which line, you can use "SecondaryAxesColor":
| In[3]:= | ![ResourceFunction[
"MultipleAxesListPlot", ResourceSystemBase -> "https://www.wolframcloud.com/obj/resourcesystem/api/1.0"][{{0., 0.19866933079506122`, 0.3894183423086505, 0.5646424733950355, 0.7173560908995228, 0.8414709848078965, 0.9320390859672264, 0.9854497299884603, 0.9995736030415051, 0.9738476308781951, 0.9092974268256817, 0.8084964038195901, 0.6754631805511506, 0.5155013718214642, 0.33498815015590466`, 0.1411200080598672, -0.058374143427580086`, -0.25554110202683167`, -0.44252044329485246`, -0.6118578909427193, -0.7568024953079282, -0.8715757724135881, -0.9516020738895161, -0.9936910036334645, -0.9961646088358406, -0.9589242746631385, -0.8834546557201531, -0.7727644875559871, -0.6312666378723208, -0.4646021794137566, -0.27941549819892586`}, {1., 1.2214027581601699`, 1.4918246976412703`,
1.822118800390509, 2.225540928492468, 2.718281828459045, 3.320116922736548, 4.055199966844675, 4.953032424395115, 6.0496474644129465`, 7.38905609893065, 9.025013499434122, 11.023176380641605`, 13.463738035001692`, 16.444646771097055`, 20.085536923187668`, 24.532530197109352`, 29.964100047397025`, 36.59823444367799, 44.701184493300836`, 54.598150033144236`, 66.68633104092515, 81.45086866496814, 99.48431564193386, 121.51041751873497`, 148.4131591025766, 181.27224187515122`, 221.40641620418717`, 270.42640742615276`, 330.2995599096489, 403.4287934927351}}, Joined -> True, PlotStyle -> {Black, Blue}, "SecondaryAxesColor" -> Blue]](https://www.wolframcloud.com/obj/resourcesystem/images/38c/38c2a24c-960e-44e5-a169-552c16b71959/396dcf26843d5b55.png) |
| Out[3]= | 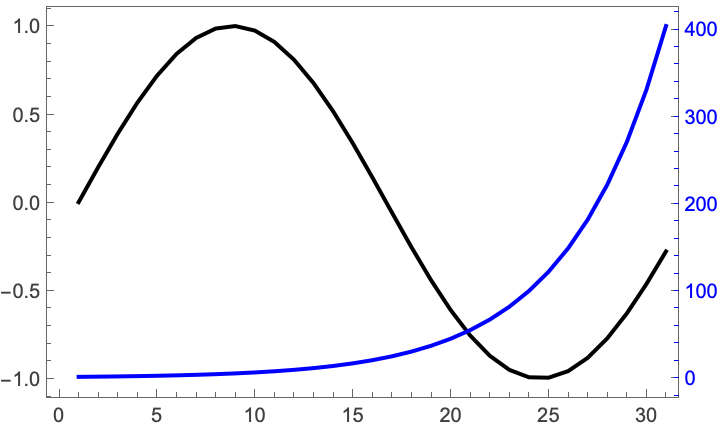 |
You can control the plot ranges of the two lines using PlotRange and "SecondaryPlotRange":
| In[4]:= | ![ResourceFunction[
"MultipleAxesListPlot", ResourceSystemBase -> "https://www.wolframcloud.com/obj/resourcesystem/api/1.0"][{{0., 0.19866933079506122`, 0.3894183423086505, 0.5646424733950355, 0.7173560908995228, 0.8414709848078965, 0.9320390859672264, 0.9854497299884603, 0.9995736030415051, 0.9738476308781951, 0.9092974268256817, 0.8084964038195901, 0.6754631805511506, 0.5155013718214642, 0.33498815015590466`, 0.1411200080598672, -0.058374143427580086`, -0.25554110202683167`, -0.44252044329485246`, -0.6118578909427193, -0.7568024953079282, -0.8715757724135881, -0.9516020738895161, -0.9936910036334645, -0.9961646088358406, -0.9589242746631385, -0.8834546557201531, -0.7727644875559871, -0.6312666378723208, -0.4646021794137566, -0.27941549819892586`}, {1., 1.2214027581601699`, 1.4918246976412703`,
1.822118800390509, 2.225540928492468, 2.718281828459045, 3.320116922736548, 4.055199966844675, 4.953032424395115, 6.0496474644129465`, 7.38905609893065, 9.025013499434122, 11.023176380641605`, 13.463738035001692`, 16.444646771097055`, 20.085536923187668`, 24.532530197109352`, 29.964100047397025`, 36.59823444367799, 44.701184493300836`, 54.598150033144236`, 66.68633104092515, 81.45086866496814, 99.48431564193386, 121.51041751873497`, 148.4131591025766, 181.27224187515122`, 221.40641620418717`, 270.42640742615276`, 330.2995599096489, 403.4287934927351}}, Joined -> True,
PlotRange -> {0, 1}, "SecondaryPlotRange" -> {100, 400}]](https://www.wolframcloud.com/obj/resourcesystem/images/38c/38c2a24c-960e-44e5-a169-552c16b71959/1a6ebfd8e104e475.png) |
| Out[4]= | 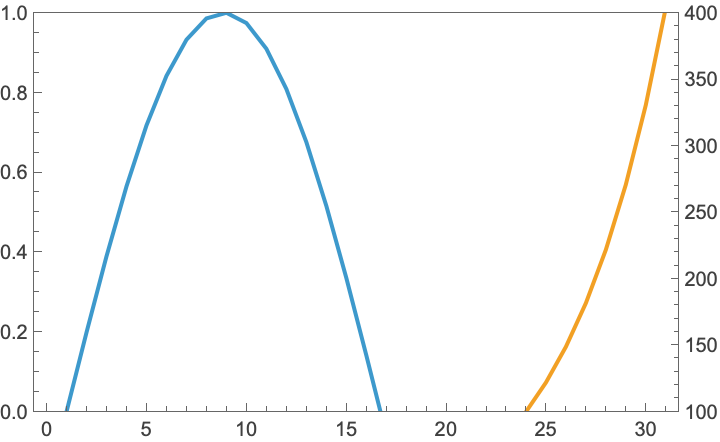 |
PlotRangePadding applies to both datasets, but uses the coordinate system of the first dataset:
| In[5]:= | ![ResourceFunction[
"MultipleAxesListPlot", ResourceSystemBase -> "https://www.wolframcloud.com/obj/resourcesystem/api/1.0"][{{0., 0.19866933079506122`, 0.3894183423086505, 0.5646424733950355, 0.7173560908995228, 0.8414709848078965, 0.9320390859672264, 0.9854497299884603, 0.9995736030415051, 0.9738476308781951, 0.9092974268256817, 0.8084964038195901, 0.6754631805511506, 0.5155013718214642, 0.33498815015590466`, 0.1411200080598672, -0.058374143427580086`, -0.25554110202683167`, -0.44252044329485246`, -0.6118578909427193, -0.7568024953079282, -0.8715757724135881, -0.9516020738895161, -0.9936910036334645, -0.9961646088358406, -0.9589242746631385, -0.8834546557201531, -0.7727644875559871, -0.6312666378723208, -0.4646021794137566, -0.27941549819892586`}, {1., 1.2214027581601699`, 1.4918246976412703`,
1.822118800390509, 2.225540928492468, 2.718281828459045, 3.320116922736548, 4.055199966844675, 4.953032424395115, 6.0496474644129465`, 7.38905609893065, 9.025013499434122, 11.023176380641605`, 13.463738035001692`, 16.444646771097055`, 20.085536923187668`, 24.532530197109352`, 29.964100047397025`, 36.59823444367799, 44.701184493300836`, 54.598150033144236`, 66.68633104092515, 81.45086866496814, 99.48431564193386, 121.51041751873497`, 148.4131591025766, 181.27224187515122`, 221.40641620418717`, 270.42640742615276`, 330.2995599096489, 403.4287934927351}}, Joined -> True,
PlotRangePadding -> {Automatic, 2}]](https://www.wolframcloud.com/obj/resourcesystem/images/38c/38c2a24c-960e-44e5-a169-552c16b71959/2245275f396585e8.png) |
| Out[5]= | 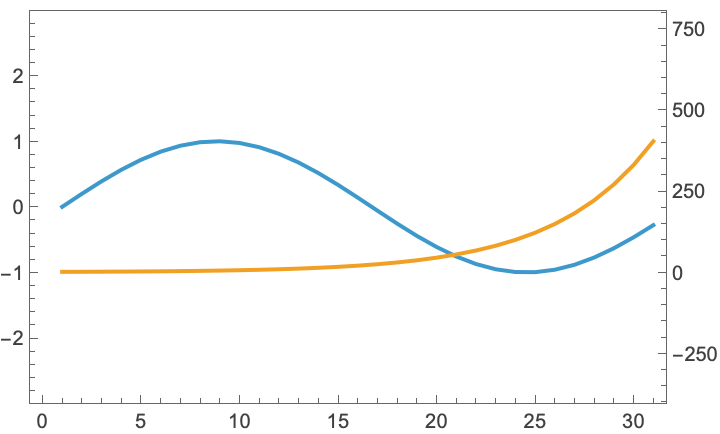 |
This work is licensed under a Creative Commons Attribution 4.0 International License