Details
The ResourceFunction["SimpleCausalGraphCoordinates"] can generate a causal graph one can input to this function.
data is the causal data coordinate data set. Currently the only supported value is ResourceFunction["SimpleCausalGraphCoordinates"]. It will create the causal graph coordinate data (with initial node number as of size) of the form {index,time,space}, where the second and third coordinates denote initial values in Minkowski 1+1 dimensional space-time.
β is the ratio of velocity to the light speed, that is, v/c.
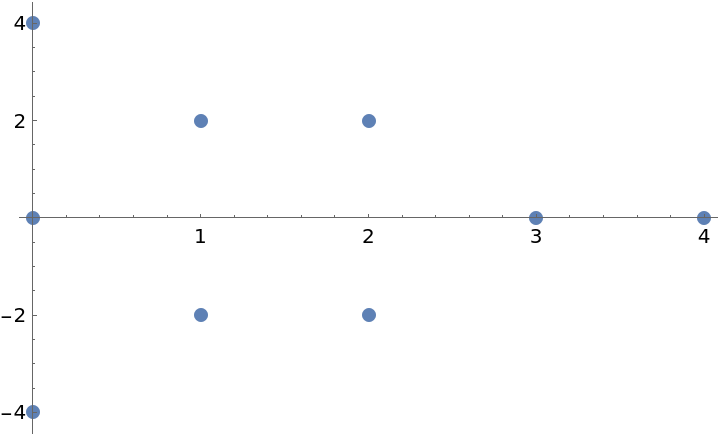
ResourceFunction["SimpleCausalGraphCoordinates"] offers several type of the causal graph: "Triangle" stands for Triangular grid, "Hexagon" stands for Hexagonal grid and "Triangle-Hexagon" stands for Triangular-Hexagonal mixed grid.
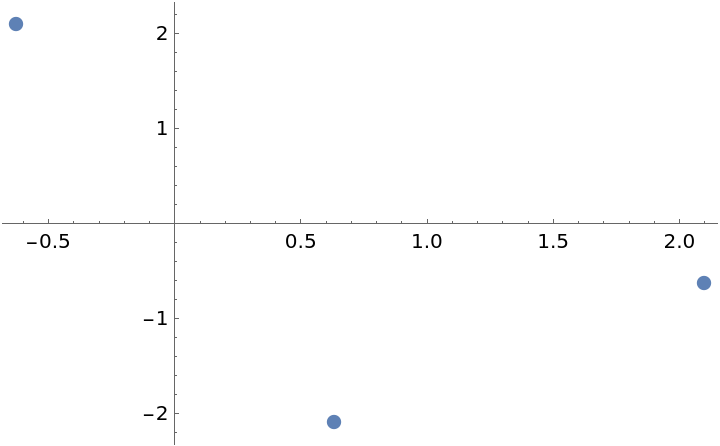
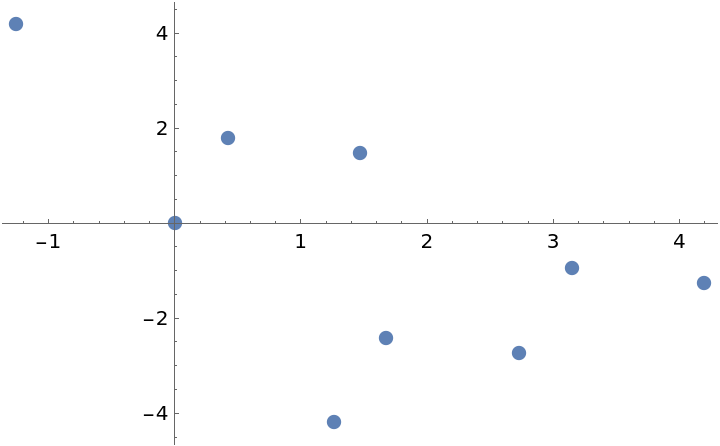
The result of ResourceFunction["LorentzCoordinate2D"] is given as a list of elements. Each element in the result represents a node and contains its information as a triple of the form {index,time,spacecoordinate}.
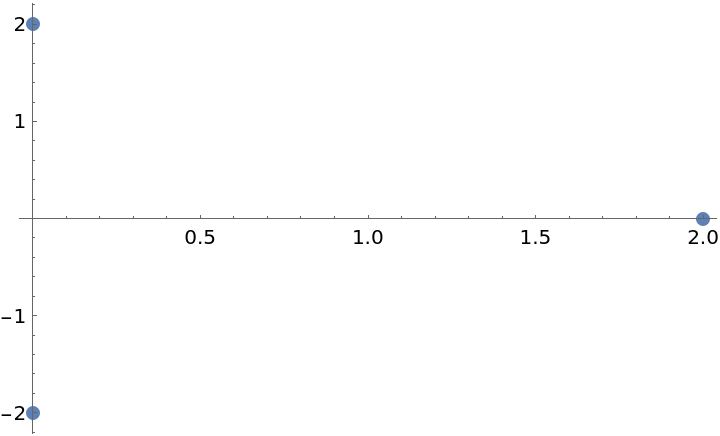
For example, the data set {{1,0,2},{2,0,-2},{3,2,0}} represents three-point coordinate information of the triangular shaped causal graph. The first element of each set is the index of the point, eg. point 1, point 2, point 3. The second and third elements are the temporal and spacial coordinates, e.g. point 1 is the event at time=0, space=2.
Here the causal graph use the same analogy as Minkowski space-time diagram which one axis noted for space coordinate and one axis is for time. One can assume this function describes the one-spatial direction(eg. x-axis) motion on the space-time, so we do not need other(eg. y- or z-axis) coordinate.
The function uses the Lorentz transform
x'=γ(x-β c t),
ct'=γ(ct-βx), where
γ is the standard Lorentz term

.


