Wolfram Function Repository
Instant-use add-on functions for the Wolfram Language
Function Repository Resource:
Get the plot range used in a piece of graphics
ResourceFunction["GraphicsBounds"][graphics] gives a list {{left,right},{bottom,top}} of the coordinates that bound all graphics primitives occurring in graphics. |
Display some graphics primitives:
| In[1]:= |
| Out[1]= | 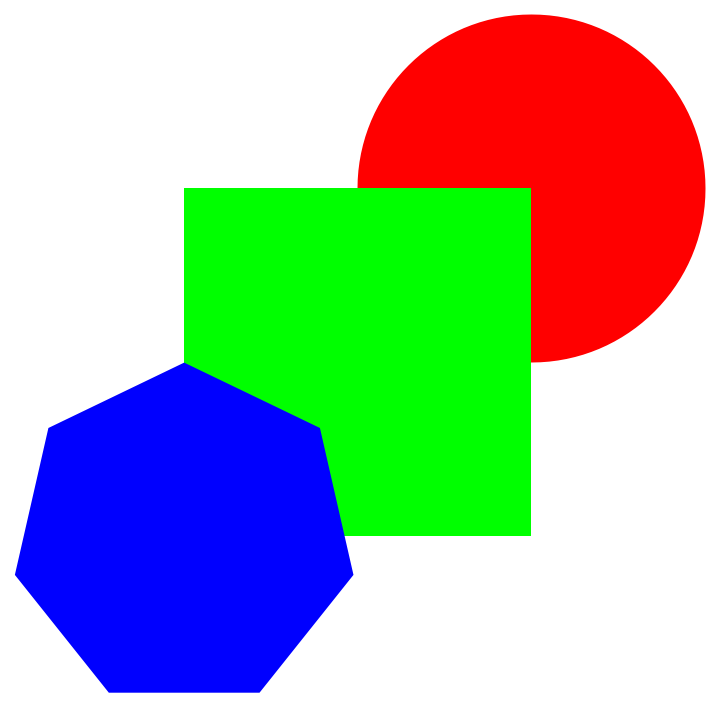 |
Get the plot range:
| In[2]:= |
| Out[2]= |
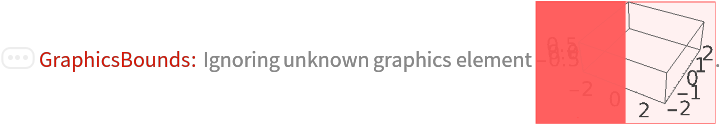
Without displaying graphics:
| In[3]:= | ![ResourceFunction["GraphicsBounds"][
Graphics[{Red, Disk[{2, 2}], Green, Rectangle[{0, 0}, {2, 2}], Blue, Polygon[CirclePoints[7]]}, PlotRangePadding -> 0.6]]](https://www.wolframcloud.com/obj/resourcesystem/images/32a/32a8d232-1433-4812-9052-f5c0a7f9037a/09ce8c4adbd76a7c.png) |
| Out[3]= |
Get a plot:
| In[4]:= |
| Out[4]= | 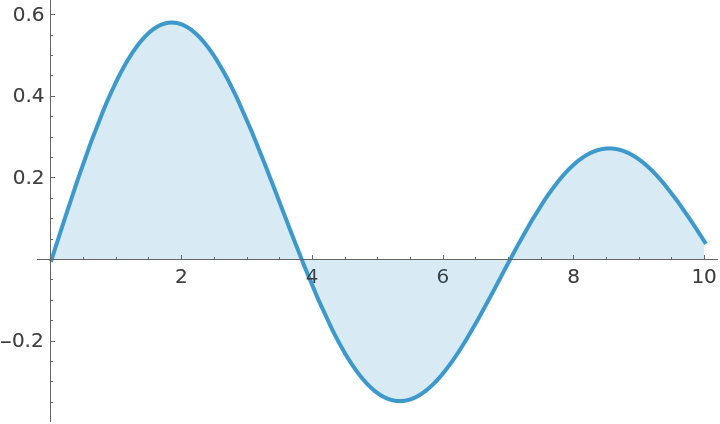 |
Get the plot range:
| In[5]:= |
| Out[5]= |
Wolfram Language 11.3 (March 2018) or above
This work is licensed under a Creative Commons Attribution 4.0 International License