Wolfram Function Repository
Instant-use add-on functions for the Wolfram Language
Function Repository Resource:
Plot the growth of lists and temporal data
ResourceFunction["ListGrowthPlot"][{n1,n2,…}] plots the percentage growth of n. | |
ResourceFunction["ListGrowthPlot"][{n11,n12,…},{n21,n22,…},…] plots the percentage growth of each list of n. | |
ResourceFunction["ListGrowthPlot"][td] plots the percentage growth of TemporalData td. |
| AspectRatio | ratio of height to width | |
| "BalancePoint" | 1 | zero growth point on the x-axis for all lists |
| Frame | None | whether to put a frame around the plot |
| InterpolationOrder | 2 | polynomial degree of curves used in joining data points |
| PlotRange | Automatic | this setting is overridden and has no effect |
| Ticks | Automatic | this setting is overridden and has no effect |
Plot the percentage growth of a list of numbers:
| In[1]:= |
| Out[1]= | 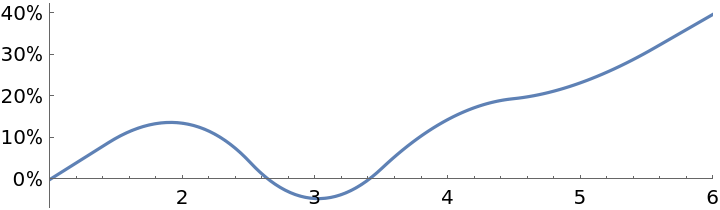 |
Plot the percentage growth of multiple lists of numbers:
| In[2]:= |
| Out[2]= | 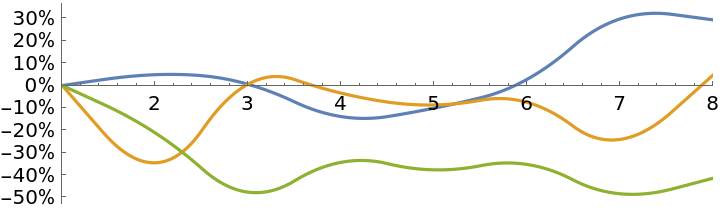 |
Plot the percentage growth of a time series:
| In[3]:= | ![v = {4, 2.5, 6, 5, 7, 4};
t = {1, 2, 5, 10, 12, 15};
ts = TimeSeries[v, {t}];
ResourceFunction["ListGrowthPlot"][ts, ImageSize -> Medium]](https://www.wolframcloud.com/obj/resourcesystem/images/2d7/2d777e90-d36a-4b52-a780-7f05c1939ce6/401a0be7eb477875.png) |
| Out[3]= | 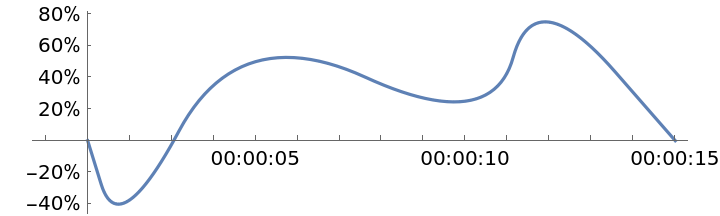 |
Plot the percentage growth of multiple paths within one TemporalData object:
| In[4]:= |
| Out[4]= | 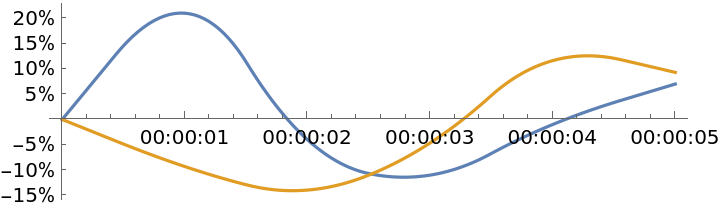 |
All plotted lines meet at {b, 0} where b is the value of the option "BalancePoint":
| In[5]:= | ![dat2 = Table[RandomReal[{5, 15}, 8], 3];
Table[ResourceFunction["ListGrowthPlot"][dat2, "BalancePoint" -> b, ImageSize -> Medium], {b, {1, 3, 5, 7}}]](https://www.wolframcloud.com/obj/resourcesystem/images/2d7/2d777e90-d36a-4b52-a780-7f05c1939ce6/4adbe8c4db37e403.png) |
| Out[5]= | 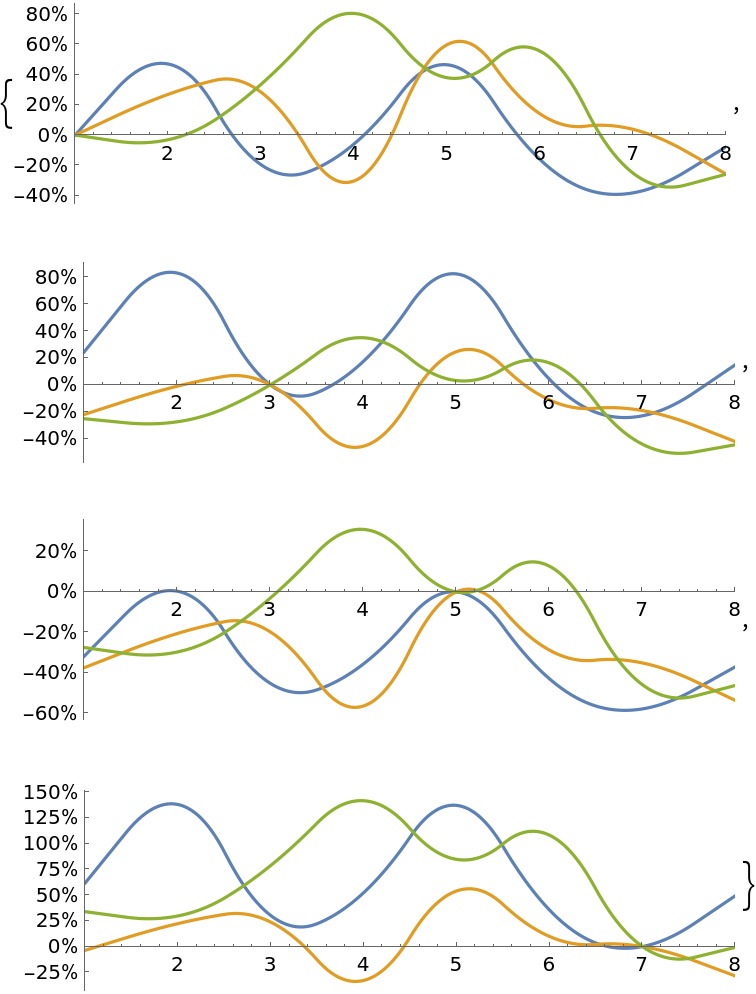 |
Plot the performance of two stock investments, even though the stock prices are different:
| In[6]:= | ![dates = {"Sep. 1, 2019", "Dec. 31, 2019"};
path1 = FinancialData["MSFT", dates];
path2 = FinancialData["AAPL", dates];
ResourceFunction["ListGrowthPlot"][TemporalData[{path1, path2}],
PlotLabels -> {"Microsoft", "Apple"},
ImageSize -> Large]](https://www.wolframcloud.com/obj/resourcesystem/images/2d7/2d777e90-d36a-4b52-a780-7f05c1939ce6/091348c6d8428973.png) |
| Out[6]= | 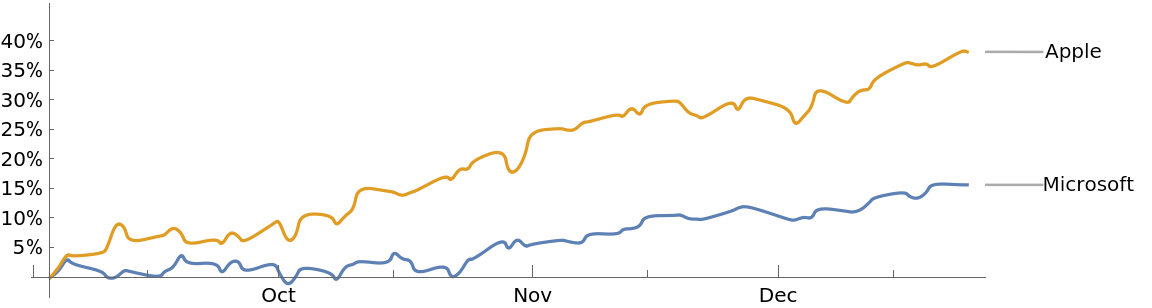 |
Compare the changes in population of two countries, even though the populations are of vastly different magnitude:
| In[7]:= | ![co1 = CountryData["UnitedStates", {"Population", {1950, 2010}}];
co2 = CountryData["Belize", {"Population", {1950, 2010}}];
ResourceFunction["ListGrowthPlot"][TemporalData[{co1, co2}], PlotLabels -> {"USA", "Belize"},
ImageSize -> Large]](https://www.wolframcloud.com/obj/resourcesystem/images/2d7/2d777e90-d36a-4b52-a780-7f05c1939ce6/34558bc64094bf50.png) |
| Out[7]= | 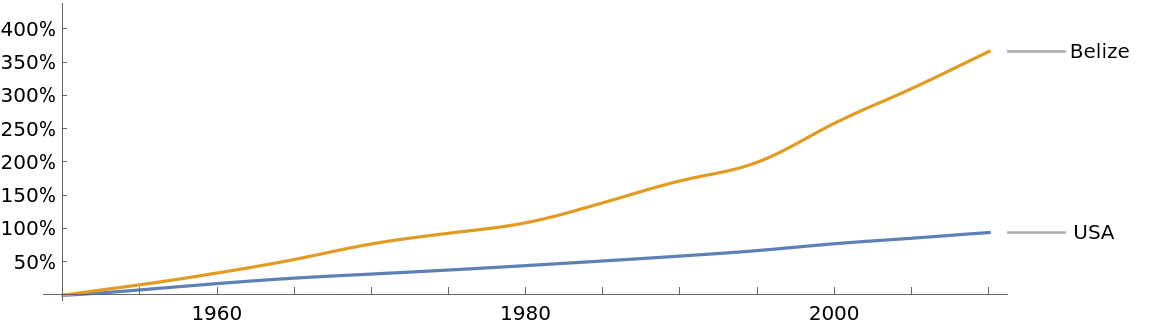 |
Percentage change from zero is meaningless, so an error occurs if the value of the balance point is zero for any of the lines plotted:
| In[8]:= | ![lst1 = {4.0, 3.3, 5.7};
lst2 = {0, 2.8, 5.5};
ResourceFunction["ListGrowthPlot"][{lst1, lst2}]](https://www.wolframcloud.com/obj/resourcesystem/images/2d7/2d777e90-d36a-4b52-a780-7f05c1939ce6/424ec762d7427f74.png) |
| Out[8]= | 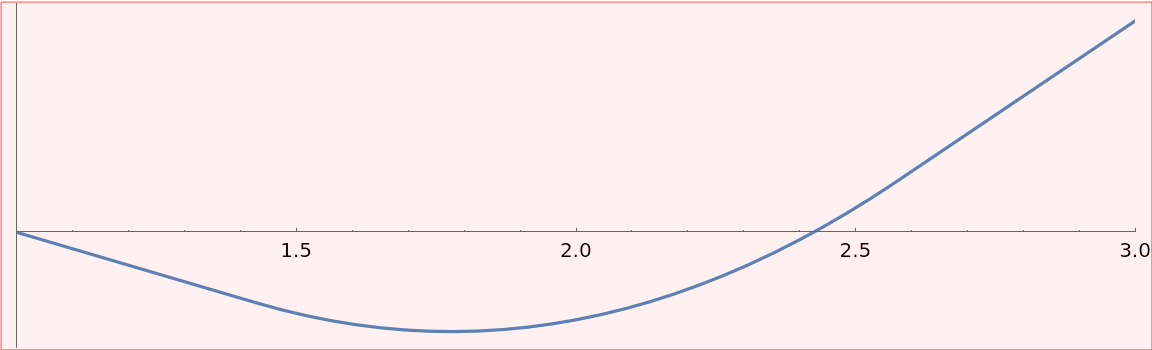 |
This work is licensed under a Creative Commons Attribution 4.0 International License