Wolfram Function Repository
Instant-use add-on functions for the Wolfram Language
Function Repository Resource:
Get a 3D molecule plot with atoms or bonds colored according to property values
ResourceFunction["MoleculeValuePlot3D"][mol,property] returns a 3D molecule plot highlighted with colors corresponding to property. |
| ColorFunction | Automatic | how to determine the coloring of atoms and bonds |
| ColorFunctionScaling | True | whether to scale numeric arguments to ColorFunction |
| "ExclusionFunction" | (False &) | function to determine which property values to exclude from the resulting plot |
Color each atom according to its partial charge:
| In[1]:= |
| Out[1]= | 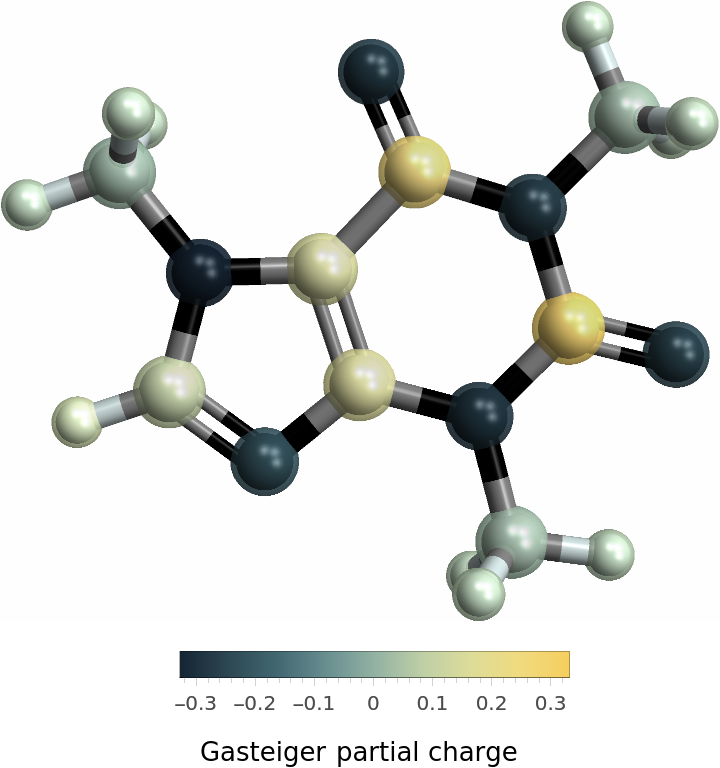 |
Color atoms according to their hybridization:
| In[2]:= |
| Out[2]= | 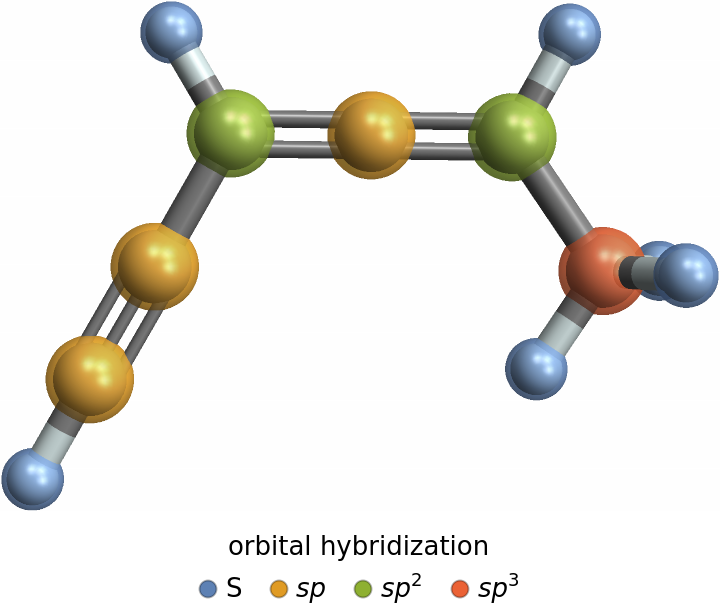 |
Color bonds according to their bond type:
| In[3]:= |
| Out[3]= | 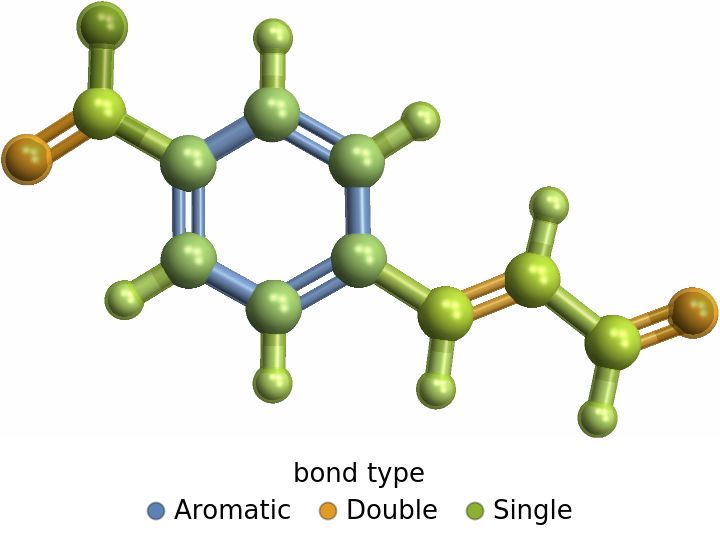 |
The atom and bond properties can be accessed via MoleculeValue and EntityProperties:
| In[4]:= |
| Out[4]= |  |
| In[5]:= |
| Out[5]= |  |
Label atoms by their phase at standard temperature and pressure:
| In[6]:= |
| Out[7]= | 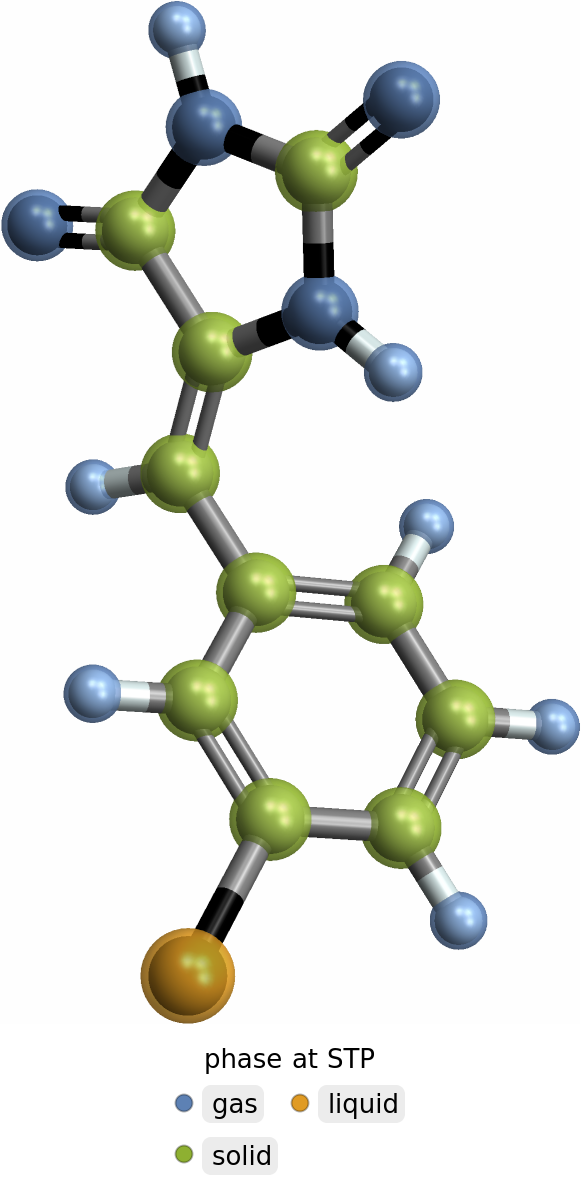 |
Disable the plot legends using the PlotLegends option:
| In[8]:= | ![ResourceFunction["MoleculeValuePlot3D"][
Molecule[
Entity["Chemical", "2Thiopheneethylamine"]], "CoordinationNumber", PlotLegends -> None]](https://www.wolframcloud.com/obj/resourcesystem/images/2b7/2b765766-54af-4fcf-af23-717d75167bfe/7ca4026702db69bd.png) |
| Out[8]= | 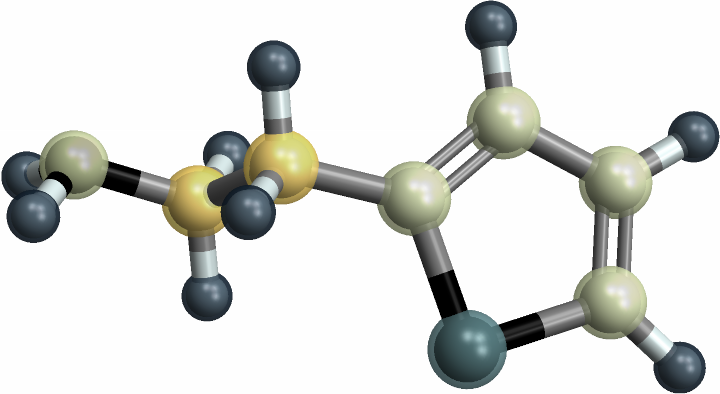 |
Specify an alternate color function for numeric data:
| In[9]:= | ![ResourceFunction["MoleculeValuePlot3D"][
Molecule["O=C(CNC(=O)[C@@H](Cc1ccccc1)CSC(=O)C)OCc1ccccc1"], EntityProperty["Element", "Electronegativity"], ColorFunction -> "Rainbow"]](https://www.wolframcloud.com/obj/resourcesystem/images/2b7/2b765766-54af-4fcf-af23-717d75167bfe/5ecb46884a3fbbea.png) |
| Out[9]= | 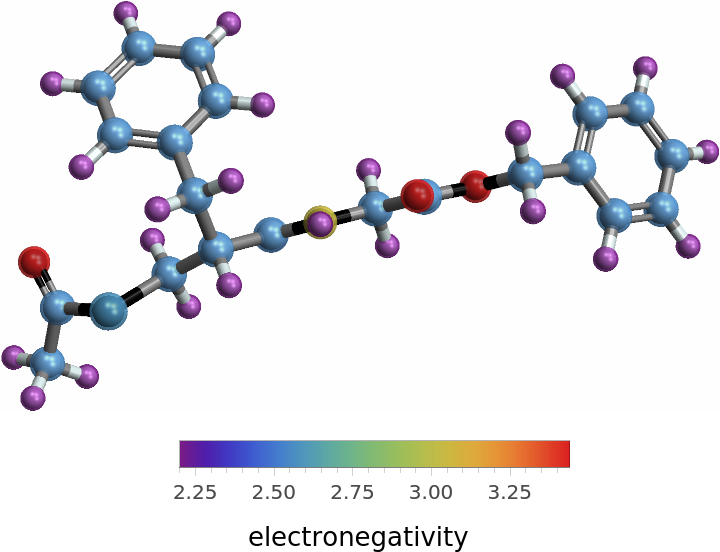 |
Specify an alternate color function for discrete data:
| In[10]:= | ![ResourceFunction["MoleculeValuePlot3D"][
Molecule["O=C(CNC(=O)[C@@H](Cc1ccccc1)CSC(=O)C)OCc1ccccc1"], EntityProperty["Element", "TermSymbol"], ColorFunction -> 98]](https://www.wolframcloud.com/obj/resourcesystem/images/2b7/2b765766-54af-4fcf-af23-717d75167bfe/4992ca5a2e1c3e15.png) |
| Out[10]= | 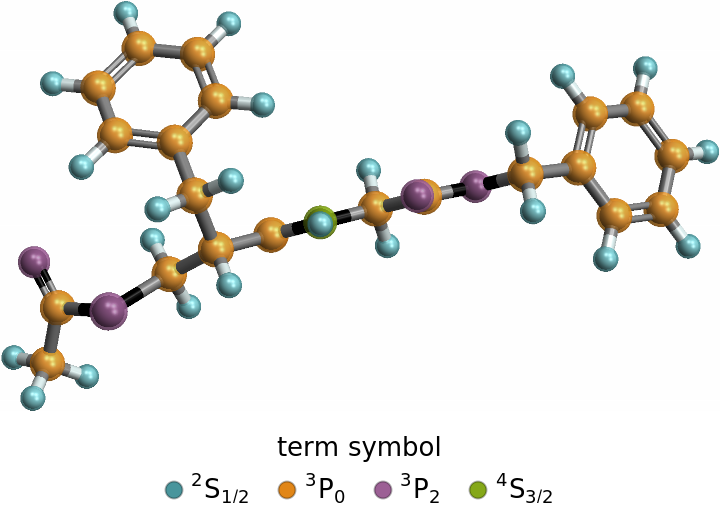 |
Pass options directly to the legend:
| In[11]:= | ![ResourceFunction["MoleculeValuePlot3D"][
Molecule["O=C(CNC(=O)[C@@H](Cc1ccccc1)CSC(=O)C)OCc1ccccc1"], EntityProperty["Element", "DiscoveryYear"], LegendLabel -> None, LegendFunction -> "Frame"]](https://www.wolframcloud.com/obj/resourcesystem/images/2b7/2b765766-54af-4fcf-af23-717d75167bfe/0493003678d5f8db.png) |
| Out[11]= | 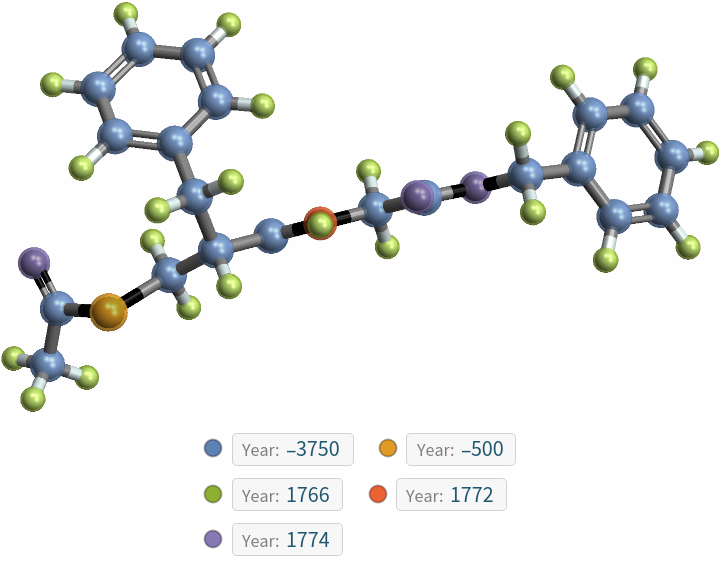 |
When some values are missing, the data is treated as discrete rather than numeric:
| In[12]:= | ![ResourceFunction["MoleculeValuePlot3D"][
Molecule["Oc1ccc(cc1)O[P@](=O)(Oc1ccc(cc1)[C@H]1OC(=O)c2c1cccc2)O"], EntityProperty["Element", "SoundSpeed"]]](https://www.wolframcloud.com/obj/resourcesystem/images/2b7/2b765766-54af-4fcf-af23-717d75167bfe/5dc9a737f1da76d1.png) |
| Out[12]= | 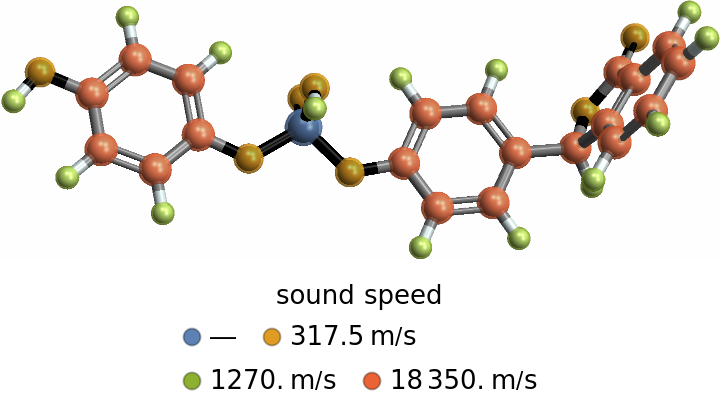 |
Use MissingQ to exclude missing values:
| In[13]:= | ![ResourceFunction["MoleculeValuePlot3D"][
Molecule["Oc1ccc(cc1)O[P@](=O)(Oc1ccc(cc1)[C@H]1OC(=O)c2c1cccc2)O"], EntityProperty["Element", "SoundSpeed"], "ExclusionFunction" -> MissingQ]](https://www.wolframcloud.com/obj/resourcesystem/images/2b7/2b765766-54af-4fcf-af23-717d75167bfe/2c0dee2f3e998d2c.png) |
| Out[13]= | 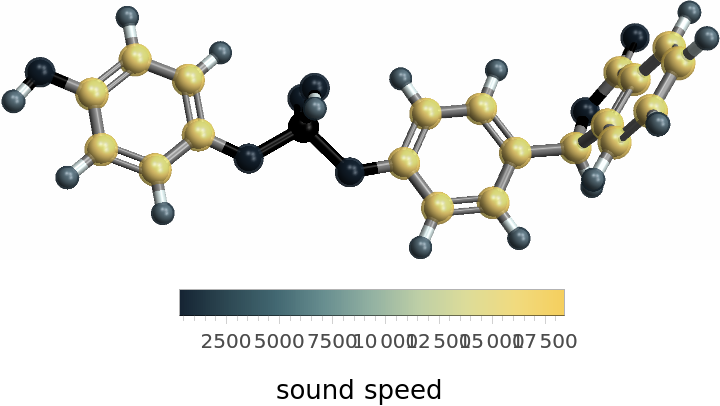 |
Label atoms by their chirality, using the "ExclusionFunction" option to make sure achiral atoms are not labeled:
| In[14]:= | ![(* Evaluate this cell to get the example input *) CloudGet["https://www.wolframcloud.com/obj/be17c0c4-d798-4540-ac39-abc5c42a93c8"]](https://www.wolframcloud.com/obj/resourcesystem/images/2b7/2b765766-54af-4fcf-af23-717d75167bfe/23646e9355f1191e.png) |
| Out[14]= | 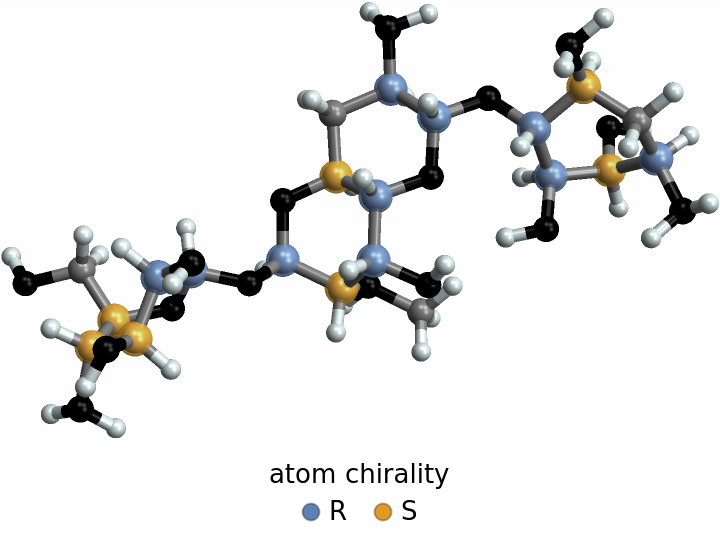 |
This work is licensed under a Creative Commons Attribution 4.0 International License