Basic Examples (2)
Compute the derivative of a piecewise function:
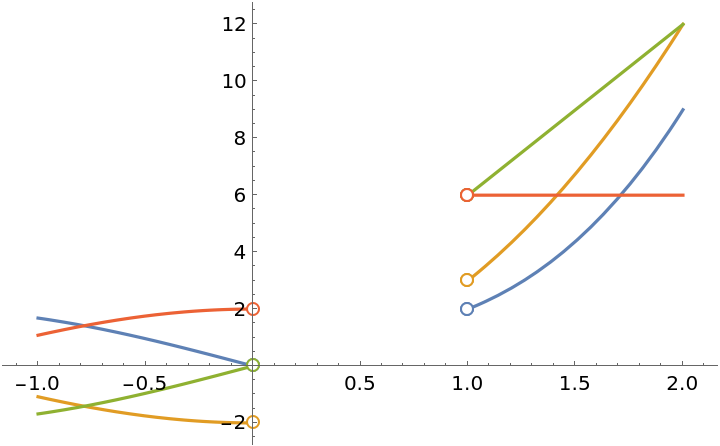
Compute the derivatives of a function whose domain is not an interval:
Compute just the third derivative:
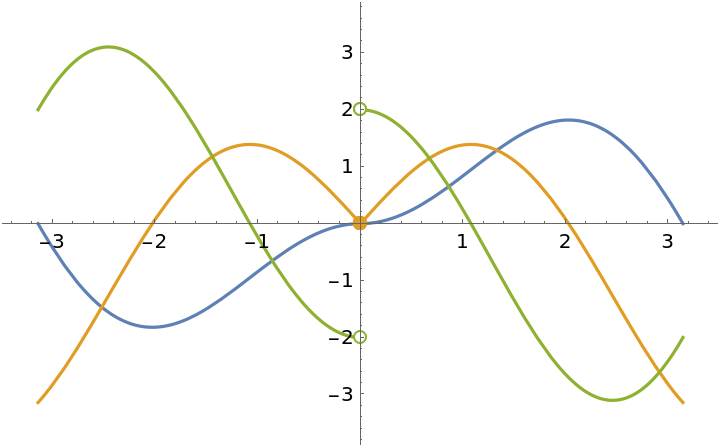
Plot the function together with its first three derivatives:
Scope (4)
Find and plot the first- and second-order derivatives. The function and its first-order derivative are continuous at x=0, but not the second-order derivative:
Check that the first derivative is continuous:
Check that the second derivative is not continuous:
Plot the results:
Applications (5)
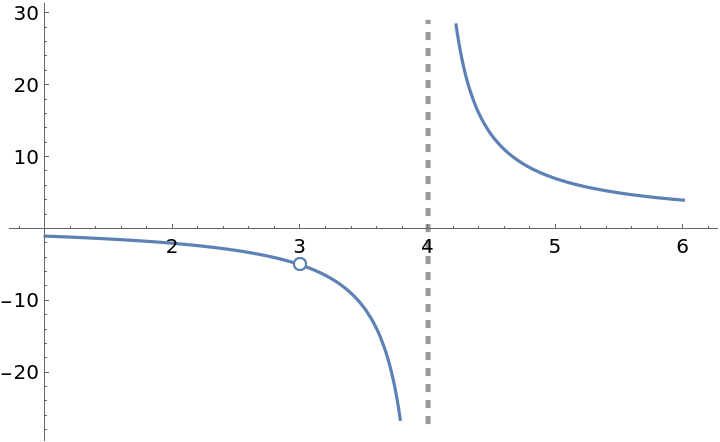
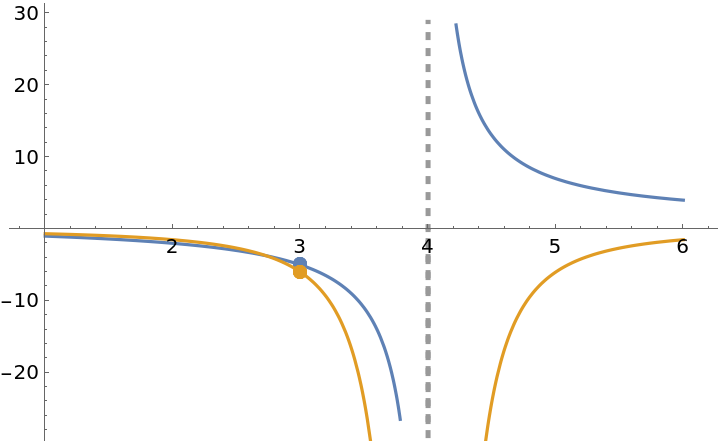
The following function has a removable discontinuity at x=3 and an infinite discontinuity at x=4:
Extend the definition at x=3 to make the extended function continuous there:
The extended function is actually differentiable at x=3:
The resource function EnhancedPlot produces a correct plot:
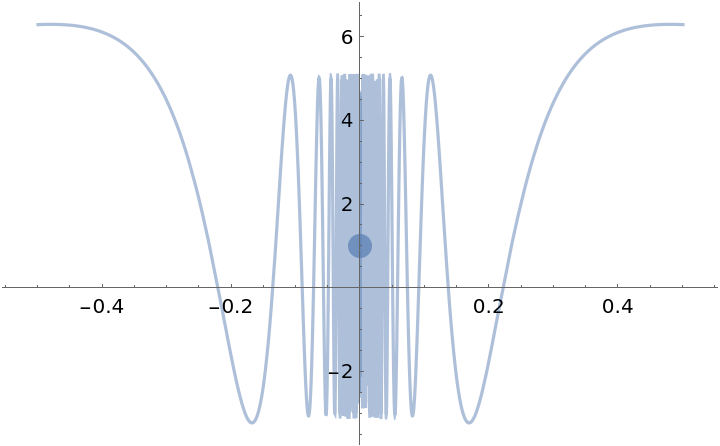
The function g is differentiable at x=0 and PiecewiseD returns the correct value, 1. The function D, however, returns the value 0 for the derivative at x=0:
However, the derivative is not continuous:
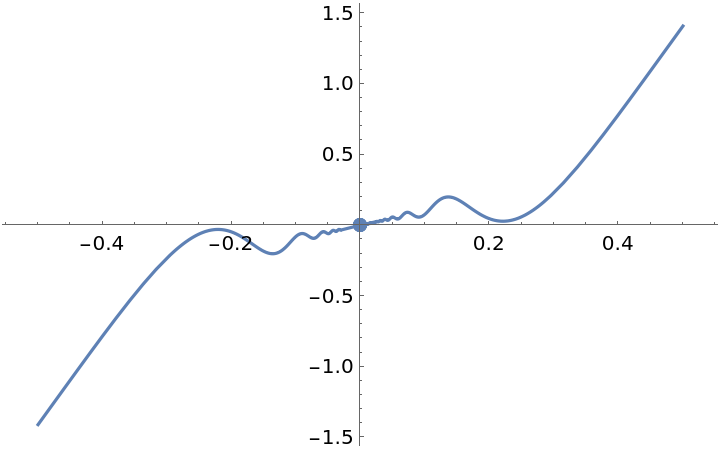
This function is differentiable at x=0 and its derivative is continuous there:
Plot the result using the resource function EnhancedPlot:
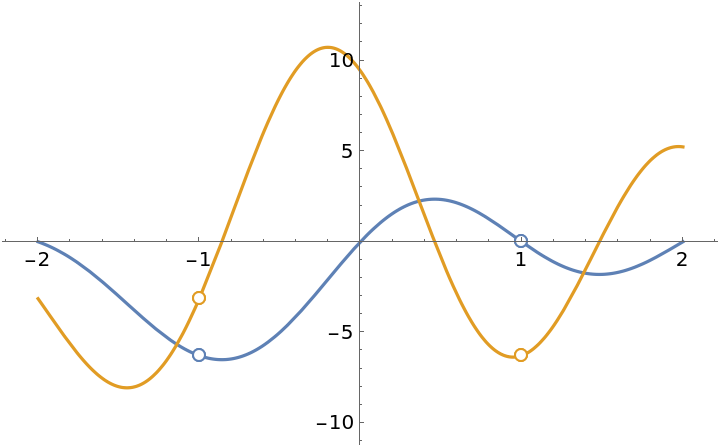
A function with a singularity at x=-1 and x=1; PiecewiseD returns the correct result. Note that if this expression is simplified, the singularity at x=1 will be lost:
The resource function EnhancedPlot is able to produce a correct plot:
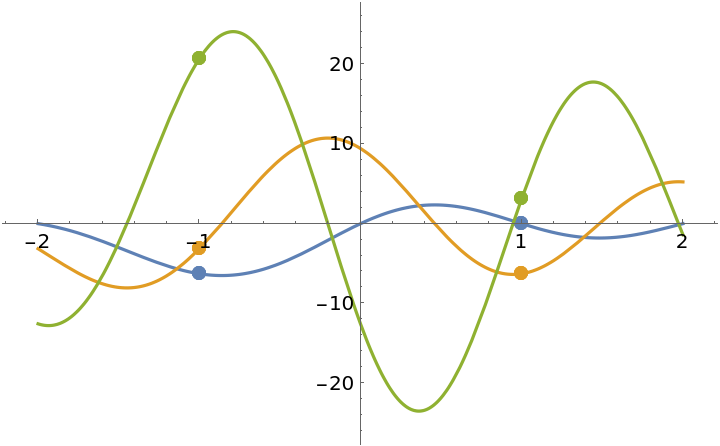
Extend the function so that it becomes continuous at -1 and 1:
The first and second derivatives are continuous at ±1:
Plot the extended function and its first two derivatives:
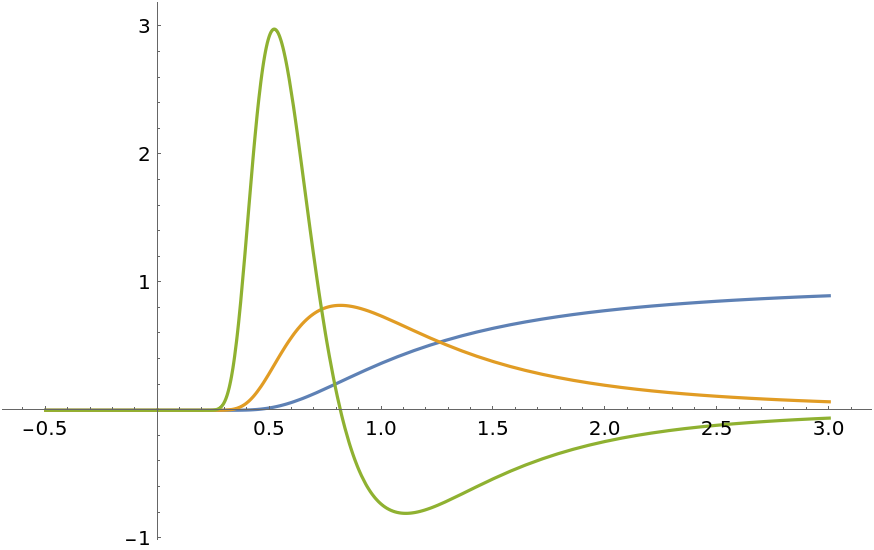
A classic example of a nonzero infinitely differentiable function all of whose derivatives at x=0 are 0 and hence all of whose Taylor polynomials based at 0 are the zero polynomial:
Illustrate with ResourceFunction["EnhancedPlot"]:
![f[x_] := \!\(\*
TagBox[GridBox[{
{"\[Piecewise]", GridBox[{
{
RowBox[{
RowBox[{"-", "2"}], " ", "x"}],
RowBox[{"x", "<", "0"}]},
{
RowBox[{
RowBox[{"2", " ", "x"}], "+", "1"}],
RowBox[{"x", ">", "0"}]}
},
AllowedDimensions->{2, Automatic},
Editable->True,
GridBoxAlignment->{"Columns" -> {{Left}}, "Rows" -> {{Baseline}}},
GridBoxItemSize->{"Columns" -> {{Automatic}}, "Rows" -> {{1.}}},
GridBoxSpacings->{"Columns" -> {
Offset[0.27999999999999997`], {
Offset[0.84]},
Offset[0.27999999999999997`]}, "Rows" -> {
Offset[0.2], {
Offset[0.4]},
Offset[0.2]}},
Selectable->True]}
},
GridBoxAlignment->{"Columns" -> {{Left}}, "Rows" -> {{Baseline}}},
GridBoxItemSize->{"Columns" -> {{Automatic}}, "Rows" -> {{1.}}},
GridBoxSpacings->{"Columns" -> {
Offset[0.27999999999999997`], {
Offset[0.35]},
Offset[0.27999999999999997`]}, "Rows" -> {
Offset[0.2], {
Offset[0.4]},
Offset[0.2]}}],
"Piecewise",
DeleteWithContents->True,
Editable->False,
SelectWithContents->True,
Selectable->False,
StripWrapperBoxes->True]\)
ResourceFunction["PiecewiseD"][f[x], x]](https://www.wolframcloud.com/obj/resourcesystem/images/2a1/2a1bf499-6130-438a-b37d-3929eb18cba2/32fa91dbbecbd174.png)
![f[x_] := \!\(\*
TagBox[GridBox[{
{"\[Piecewise]", GridBox[{
{
RowBox[{
RowBox[{"-", "2"}], " ",
RowBox[{"Sin", "[", "x", "]"}]}],
RowBox[{
RowBox[{"-", "1"}], "<", "x", "<", "0"}]},
{
RowBox[{
SuperscriptBox["x", "3"], "+", "1"}],
RowBox[{"x", ">", "1"}]},
{"0",
RowBox[{"x", "<",
RowBox[{"-", "1"}]}]}
},
AllowedDimensions->{2, Automatic},
Editable->True,
GridBoxAlignment->{"Columns" -> {{Left}}, "Rows" -> {{Baseline}}},
GridBoxItemSize->{"Columns" -> {{Automatic}}, "Rows" -> {{1.}}},
GridBoxSpacings->{"Columns" -> {
Offset[0.27999999999999997`], {
Offset[0.84]},
Offset[0.27999999999999997`]}, "Rows" -> {
Offset[0.2], {
Offset[0.4]},
Offset[0.2]}},
Selectable->True]}
},
GridBoxAlignment->{"Columns" -> {{Left}}, "Rows" -> {{Baseline}}},
GridBoxItemSize->{"Columns" -> {{Automatic}}, "Rows" -> {{1.}}},
GridBoxSpacings->{"Columns" -> {
Offset[0.27999999999999997`], {
Offset[0.35]},
Offset[0.27999999999999997`]}, "Rows" -> {
Offset[0.2], {
Offset[0.4]},
Offset[0.2]}}],
"Piecewise",
DeleteWithContents->True,
Editable->False,
SelectWithContents->True,
Selectable->False,
StripWrapperBoxes->True]\)
ResourceFunction["PiecewiseD"][f[x], x, 3]](https://www.wolframcloud.com/obj/resourcesystem/images/2a1/2a1bf499-6130-438a-b37d-3929eb18cba2/393254d1cb1e5f21.png)


![ResourceFunction["EnhancedPlot"][
ResourceFunction["PiecewiseD"][f[x], x, 3], {x, -1, 2}, "Exception" -> {0, 1}, PlotRange -> All]](https://www.wolframcloud.com/obj/resourcesystem/images/2a1/2a1bf499-6130-438a-b37d-3929eb18cba2/75e14e610d80eade.png)

![ResourceFunction["EnhancedPlot"][
ResourceFunction["PiecewiseD"][f[x], x, 2], {x, -\[Pi], \[Pi]}, "Exception" -> 0, PlotRange -> {-3.5, 3.5}]](https://www.wolframcloud.com/obj/resourcesystem/images/2a1/2a1bf499-6130-438a-b37d-3929eb18cba2/23353f4cd0f71fa4.png)
![f[x_] := (x^2 - x - 6)/((x - 3) (x - 4))
ResourceFunction["EnhancedPlot"][f[x], {x, 1, 6}, "Exception" -> 3, "Asymptote" -> 4]](https://www.wolframcloud.com/obj/resourcesystem/images/2a1/2a1bf499-6130-438a-b37d-3929eb18cba2/01758ae43c0bca0a.png)
![g[x_] := \!\(\*
TagBox[GridBox[{
{"\[Piecewise]", GridBox[{
{
RowBox[{"f", "[", "x", "]"}],
RowBox[{
RowBox[{"x", "!=", "3"}], "&&",
RowBox[{"x", "!=", "4"}]}]},
{
RowBox[{"-", "5"}],
RowBox[{"x", "==", "3"}]}
},
AllowedDimensions->{2, Automatic},
Editable->True,
GridBoxAlignment->{"Columns" -> {{Left}}, "ColumnsIndexed" -> {}, "Rows" -> {{Baseline}}, "RowsIndexed" -> {}},
GridBoxItemSize->{"Columns" -> {{Automatic}}, "ColumnsIndexed" -> {}, "Rows" -> {{1.}}, "RowsIndexed" -> {}},
GridBoxSpacings->{"Columns" -> {
Offset[0.27999999999999997`], {
Offset[0.84]},
Offset[0.27999999999999997`]}, "ColumnsIndexed" -> {}, "Rows" -> {
Offset[0.2], {
Offset[0.4]},
Offset[0.2]}, "RowsIndexed" -> {}},
Selectable->True]}
},
GridBoxAlignment->{"Columns" -> {{Left}}, "ColumnsIndexed" -> {}, "Rows" -> {{Baseline}}, "RowsIndexed" -> {}},
GridBoxItemSize->{"Columns" -> {{Automatic}}, "ColumnsIndexed" -> {}, "Rows" -> {{1.}}, "RowsIndexed" -> {}},
GridBoxSpacings->{"Columns" -> {
Offset[0.27999999999999997`], {
Offset[0.35]},
Offset[0.27999999999999997`]}, "ColumnsIndexed" -> {}, "Rows" -> {
Offset[0.2], {
Offset[0.4]},
Offset[0.2]}, "RowsIndexed" -> {}}],
"Piecewise",
DeleteWithContents->True,
Editable->False,
SelectWithContents->True,
Selectable->False,
StripWrapperBoxes->True]\)
ResourceFunction["EnhancedPlot"][g[x], {x, 1, 6}, "Exception" -> 3, "Asymptote" -> 4]](https://www.wolframcloud.com/obj/resourcesystem/images/2a1/2a1bf499-6130-438a-b37d-3929eb18cba2/537c17ed3e995fe5.png)


![ResourceFunction["EnhancedPlot"][
ResourceFunction["PiecewiseD"][g[x], x, 1], {x, 1, 6}, "Exception" -> 3, "Asymptote" -> 4]](https://www.wolframcloud.com/obj/resourcesystem/images/2a1/2a1bf499-6130-438a-b37d-3929eb18cba2/50119e54e85e4c5d.png)
![Clear[g]
g[x_] := \!\(\*
TagBox[GridBox[{
{"\[Piecewise]", GridBox[{
{
RowBox[{
RowBox[{"4",
SuperscriptBox["x", "2"],
RowBox[{"Sin", "[",
FractionBox["1", "x"], "]"}]}], "+", "x"}],
RowBox[{"x", "!=", "0"}]},
{"0",
RowBox[{"x", "==", "0"}]}
},
AllowedDimensions->{2, Automatic},
Editable->True,
GridBoxAlignment->{"Columns" -> {{Left}}, "ColumnsIndexed" -> {}, "Rows" -> {{Baseline}}, "RowsIndexed" -> {}},
GridBoxItemSize->{"Columns" -> {{Automatic}}, "ColumnsIndexed" -> {}, "Rows" -> {{1.}}, "RowsIndexed" -> {}},
GridBoxSpacings->{"Columns" -> {
Offset[0.27999999999999997`], {
Offset[0.84]},
Offset[0.27999999999999997`]}, "ColumnsIndexed" -> {}, "Rows" -> {
Offset[0.2], {
Offset[0.4]},
Offset[0.2]}, "RowsIndexed" -> {}},
Selectable->True]}
},
GridBoxAlignment->{"Columns" -> {{Left}}, "ColumnsIndexed" -> {}, "Rows" -> {{Baseline}}, "RowsIndexed" -> {}},
GridBoxItemSize->{"Columns" -> {{Automatic}}, "ColumnsIndexed" -> {}, "Rows" -> {{1.}}, "RowsIndexed" -> {}},
GridBoxSpacings->{"Columns" -> {
Offset[0.27999999999999997`], {
Offset[0.35]},
Offset[0.27999999999999997`]}, "ColumnsIndexed" -> {}, "Rows" -> {
Offset[0.2], {
Offset[0.4]},
Offset[0.2]}, "RowsIndexed" -> {}}],
"Piecewise",
DeleteWithContents->True,
Editable->False,
SelectWithContents->True,
Selectable->False]\)
{ResourceFunction["PiecewiseD"][g[x], x], D[g[x], x]}](https://www.wolframcloud.com/obj/resourcesystem/images/2a1/2a1bf499-6130-438a-b37d-3929eb18cba2/240e13764154c8d8.png)

![ResourceFunction["EnhancedPlot"][
ResourceFunction["PiecewiseD"][g[x], x], {x, -.5, .5}, "Exception" -> 0, PlotStyle -> Opacity[.5], "PointStyle" -> AbsolutePointSize[12]]](https://www.wolframcloud.com/obj/resourcesystem/images/2a1/2a1bf499-6130-438a-b37d-3929eb18cba2/50ef8f1cfe3ea00b.png)
![Clear[g]
g[x_] := \!\(\*
TagBox[GridBox[{
{"\[Piecewise]", GridBox[{
{
RowBox[{
RowBox[{
SuperscriptBox["x", "3"],
RowBox[{"Sin", "[",
FractionBox["1", "x"], "]"}]}], "+", "x"}],
RowBox[{"x", "!=", "0"}]},
{"0",
RowBox[{"x", "==", "0"}]}
},
AllowedDimensions->{2, Automatic},
Editable->True,
GridBoxAlignment->{"Columns" -> {{Left}}, "ColumnsIndexed" -> {}, "Rows" -> {{Baseline}}, "RowsIndexed" -> {}},
GridBoxItemSize->{"Columns" -> {{Automatic}}, "ColumnsIndexed" -> {}, "Rows" -> {{1.}}, "RowsIndexed" -> {}},
GridBoxSpacings->{"Columns" -> {
Offset[0.27999999999999997`], {
Offset[0.84]},
Offset[0.27999999999999997`]}, "ColumnsIndexed" -> {}, "Rows" -> {
Offset[0.2], {
Offset[0.4]},
Offset[0.2]}, "RowsIndexed" -> {}},
Selectable->True]}
},
GridBoxAlignment->{"Columns" -> {{Left}}, "ColumnsIndexed" -> {}, "Rows" -> {{Baseline}}, "RowsIndexed" -> {}},
GridBoxItemSize->{"Columns" -> {{Automatic}}, "ColumnsIndexed" -> {}, "Rows" -> {{1.}}, "RowsIndexed" -> {}},
GridBoxSpacings->{"Columns" -> {
Offset[0.27999999999999997`], {
Offset[0.35]},
Offset[0.27999999999999997`]}, "ColumnsIndexed" -> {}, "Rows" -> {
Offset[0.2], {
Offset[0.4]},
Offset[0.2]}, "RowsIndexed" -> {}}],
"Piecewise",
DeleteWithContents->True,
Editable->False,
SelectWithContents->True,
Selectable->False]\)
dg[x_] = ResourceFunction["PiecewiseD"][g[x], x]](https://www.wolframcloud.com/obj/resourcesystem/images/2a1/2a1bf499-6130-438a-b37d-3929eb18cba2/39437bc24988e56e.png)

![ResourceFunction["EnhancedPlot"][
ResourceFunction["PiecewiseD"][g[x], x], {x, -.5, .5}, "Exception" -> 0, "PointStyle" -> AbsolutePointSize[10]]](https://www.wolframcloud.com/obj/resourcesystem/images/2a1/2a1bf499-6130-438a-b37d-3929eb18cba2/1effe2ae8199aa7b.png)

![ResourceFunction["EnhancedPlot"][
ResourceFunction[
"PiecewiseD"][(x^2 + 2 x - 3)/(x^2 - 1) Sin[\[Pi] x], x, 1], {x, -2,
2}, "Exception" -> {-1, 1}, PlotRange -> {-10, 12}]](https://www.wolframcloud.com/obj/resourcesystem/images/2a1/2a1bf499-6130-438a-b37d-3929eb18cba2/6e2fa4e028035ab8.png)
![Clear[h]
h[x_] := \!\(\*
TagBox[GridBox[{
{"\[Piecewise]", GridBox[{
{
RowBox[{
FractionBox[
RowBox[{
SuperscriptBox["x", "2"], "+",
RowBox[{"2", "x"}], "-", "3"}],
RowBox[{
SuperscriptBox["x", "2"], "-", "1"}]],
RowBox[{"Sin", "[",
RowBox[{"\[Pi]", " ", "x"}], "]"}]}],
RowBox[{
RowBox[{"x", "!=",
RowBox[{"-", "1"}]}], "&&",
RowBox[{"x", "!=", "1"}]}]},
{
RowBox[{
RowBox[{"-", "2"}], "\[Pi]"}],
RowBox[{"x", "==",
RowBox[{"-", "1"}]}]},
{"0",
RowBox[{"x", "==", "1"}]}
},
AllowedDimensions->{2, Automatic},
Editable->True,
GridBoxAlignment->{"Columns" -> {{Left}}, "ColumnsIndexed" -> {}, "Rows" -> {{Baseline}}, "RowsIndexed" -> {}},
GridBoxItemSize->{"Columns" -> {{Automatic}}, "ColumnsIndexed" -> {}, "Rows" -> {{1.}}, "RowsIndexed" -> {}},
GridBoxSpacings->{"Columns" -> {
Offset[0.27999999999999997`], {
Offset[0.84]},
Offset[0.27999999999999997`]}, "ColumnsIndexed" -> {}, "Rows" -> {
Offset[0.2], {
Offset[0.4]},
Offset[0.2]}, "RowsIndexed" -> {}},
Selectable->True]}
},
GridBoxAlignment->{"Columns" -> {{Left}}, "ColumnsIndexed" -> {}, "Rows" -> {{Baseline}}, "RowsIndexed" -> {}},
GridBoxItemSize->{"Columns" -> {{Automatic}}, "ColumnsIndexed" -> {}, "Rows" -> {{1.}}, "RowsIndexed" -> {}},
GridBoxSpacings->{"Columns" -> {
Offset[0.27999999999999997`], {
Offset[0.35]},
Offset[0.27999999999999997`]}, "ColumnsIndexed" -> {}, "Rows" -> {
Offset[0.2], {
Offset[0.4]},
Offset[0.2]}, "RowsIndexed" -> {}}],
"Piecewise",
DeleteWithContents->True,
Editable->False,
SelectWithContents->True,
Selectable->False,
StripWrapperBoxes->True]\)](https://www.wolframcloud.com/obj/resourcesystem/images/2a1/2a1bf499-6130-438a-b37d-3929eb18cba2/18a64fff985762af.png)
![ResourceFunction["EnhancedPlot"][
ResourceFunction["PiecewiseD"][h[x], x, 2], {x, -2, 2}, "Exception" -> {-1, 1}, PlotRange -> {-25, 25}]](https://www.wolframcloud.com/obj/resourcesystem/images/2a1/2a1bf499-6130-438a-b37d-3929eb18cba2/4ce1f0ec8be93664.png)
![Clear[f]
f[x_] := \!\(\*
TagBox[GridBox[{
{"\[Piecewise]", GridBox[{
{
RowBox[{"Exp", "[",
RowBox[{"-",
FractionBox["1",
SuperscriptBox["x", "2"]]}], "]"}],
RowBox[{"x", ">", "0"}]},
{"0", "True"}
},
AllowedDimensions->{2, Automatic},
Editable->True,
GridBoxAlignment->{"Columns" -> {{Left}}, "ColumnsIndexed" -> {}, "Rows" -> {{Baseline}}, "RowsIndexed" -> {}},
GridBoxItemSize->{"Columns" -> {{Automatic}}, "ColumnsIndexed" -> {}, "Rows" -> {{1.}}, "RowsIndexed" -> {}},
GridBoxSpacings->{"Columns" -> {
Offset[0.27999999999999997`], {
Offset[0.84]},
Offset[0.27999999999999997`]}, "ColumnsIndexed" -> {}, "Rows" -> {
Offset[0.2], {
Offset[0.4]},
Offset[0.2]}, "RowsIndexed" -> {}},
Selectable->True]}
},
GridBoxAlignment->{"Columns" -> {{Left}}, "ColumnsIndexed" -> {}, "Rows" -> {{Baseline}}, "RowsIndexed" -> {}},
GridBoxItemSize->{"Columns" -> {{Automatic}}, "ColumnsIndexed" -> {}, "Rows" -> {{1.}}, "RowsIndexed" -> {}},
GridBoxSpacings->{"Columns" -> {
Offset[0.27999999999999997`], {
Offset[0.35]},
Offset[0.27999999999999997`]}, "ColumnsIndexed" -> {}, "Rows" -> {
Offset[0.2], {
Offset[0.4]},
Offset[0.2]}, "RowsIndexed" -> {}}],
"Piecewise",
DeleteWithContents->True,
Editable->False,
SelectWithContents->True,
Selectable->False,
StripWrapperBoxes->True]\)
ResourceFunction["PiecewiseD"][f[x], x, 3] // Simplify](https://www.wolframcloud.com/obj/resourcesystem/images/2a1/2a1bf499-6130-438a-b37d-3929eb18cba2/1032289080c1986c.png)

![ResourceFunction["EnhancedPlot"][
ResourceFunction["PiecewiseD"][f[x], x, 2, "ZeroToNull" -> False], {x, -.5, 3}, PlotRange -> All] // Quiet](https://www.wolframcloud.com/obj/resourcesystem/images/2a1/2a1bf499-6130-438a-b37d-3929eb18cba2/652c28d34ff86239.png)