Wolfram Function Repository
Instant-use add-on functions for the Wolfram Language
Function Repository Resource:
Compute and plot an approximation to the integral of a function of two variables over a rectangle
ResourceFunction["IntegralApproximationPlot3D"][f,{x,xmin,xmax},{y,ymin,ymax},method,{m,n}] plots f and an approximation to the integral of f over the rectangle determined by xmin≤x≤xmax and ymin≤y≤ymax based on the approximation method and regular partitions of the x- and y-axes with m and n equal subintervals. | |
ResourceFunction["IntegralApproximationPlot3D"][f,{x,xmin,xmax},{y,ymin,ymax},method,n] returns ResourceFunction["IntegralApproximationPlot3D"][f,{x,xmin,xmax},{y,ymin,ymax},method,{n,n}]. |
| "Upper" | the height of the approximating rectangle is determined by the maximum value of the function on each subinterval |
| "Midpoint" | the height of the approximating rectangle is determined by the value of the function at the midpoint of each subinterval |
| "Lower" | the height of the approximating rectangle is determined by the minimum value of the function on each subinterval |
A midpoint sum approximation of a function over a rectangular region determined by a 20×25 grid:
| In[1]:= |
| Out[1]= | 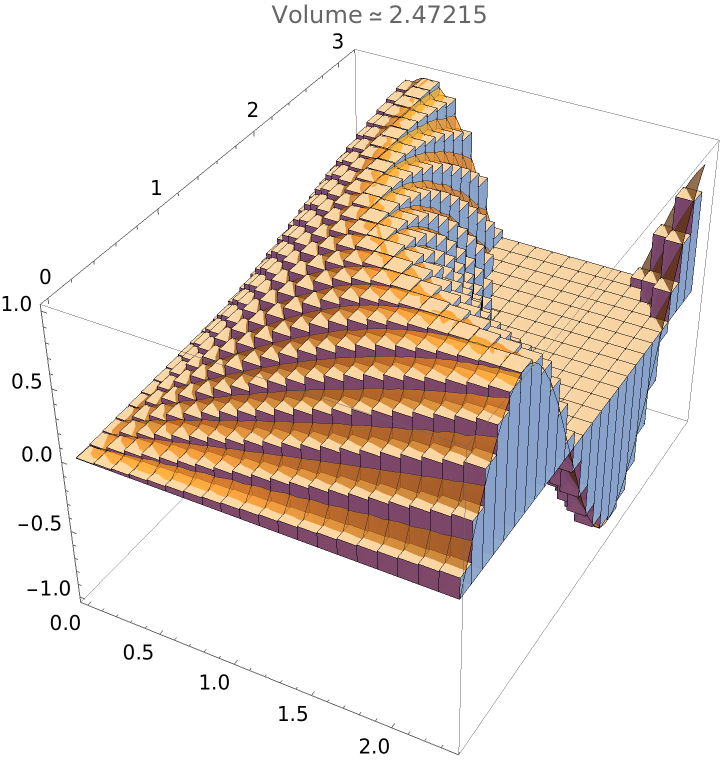 |
A upper sum approximation over a square region. This will take a few seconds since there are 225 optimizations that must be performed:
| In[2]:= |
| Out[2]= | 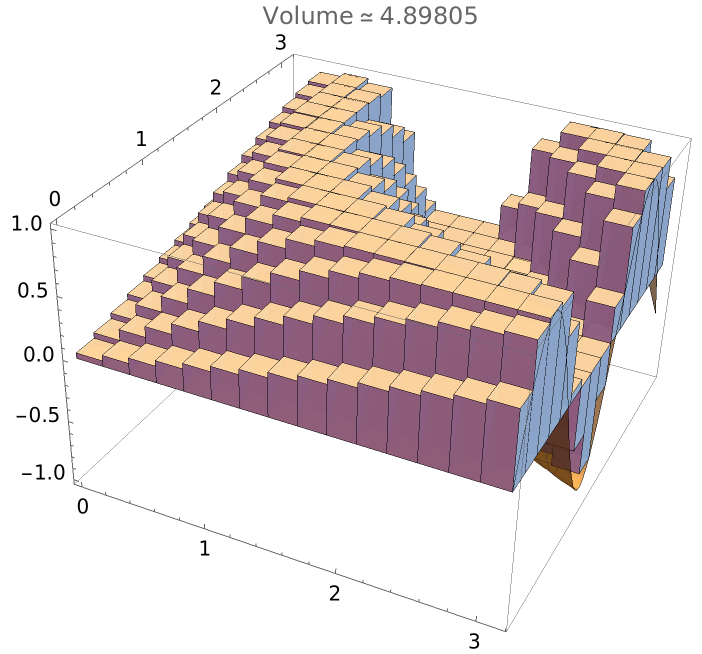 |
A lower sum approximation with a rectangular partition. As with upper sum approximations, this will take a few seconds:
| In[3]:= |
| Out[3]= | 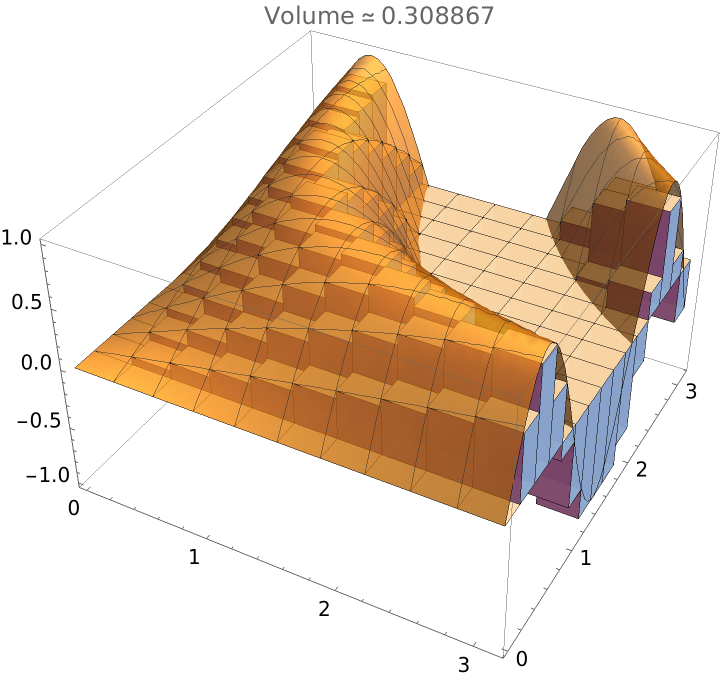 |
Set a style for the cuboids to obtain a better view of the surface and change to a 15×15 grid:
| In[4]:= |
| Out[4]= | 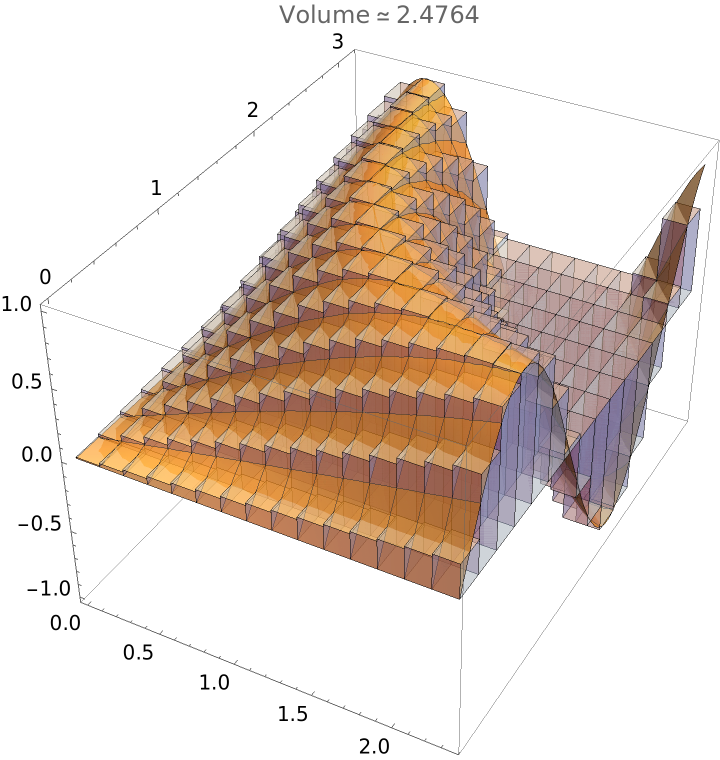 |
Suppress the plot of the surface and the approximation of the volume and just show the cuboids:
| In[5]:= |
| Out[5]= | 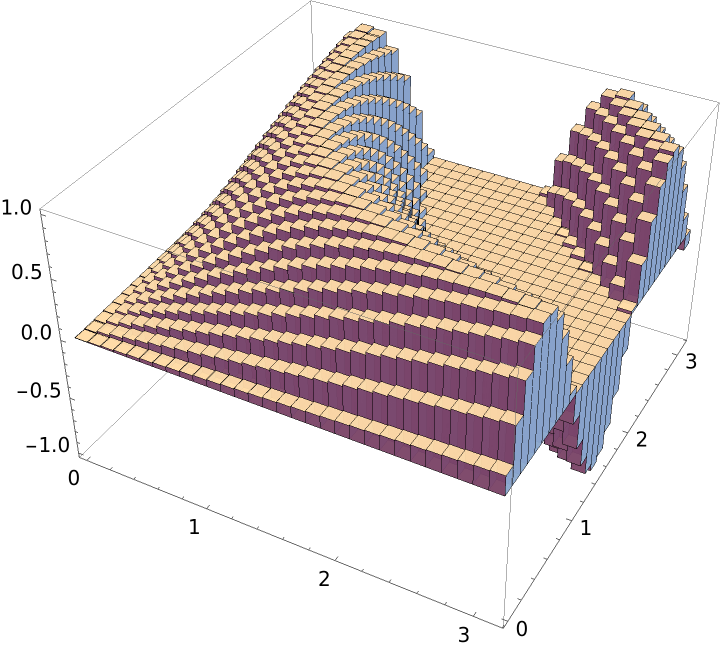 |
Suppress the graphical output:
| In[6]:= |
| Out[6]= |
This work is licensed under a Creative Commons Attribution 4.0 International License