Wolfram Function Repository
Instant-use add-on functions for the Wolfram Language
Function Repository Resource:
Generate a density plot of opinion alignment from a list of relations
ResourceFunction["AlignmentClusterPlot"][relations] generates a density plot based on the relationships in relations. |
Plot the alignment of 5 individuals:
| In[1]:= |
| In[2]:= |
| Out[2]= | 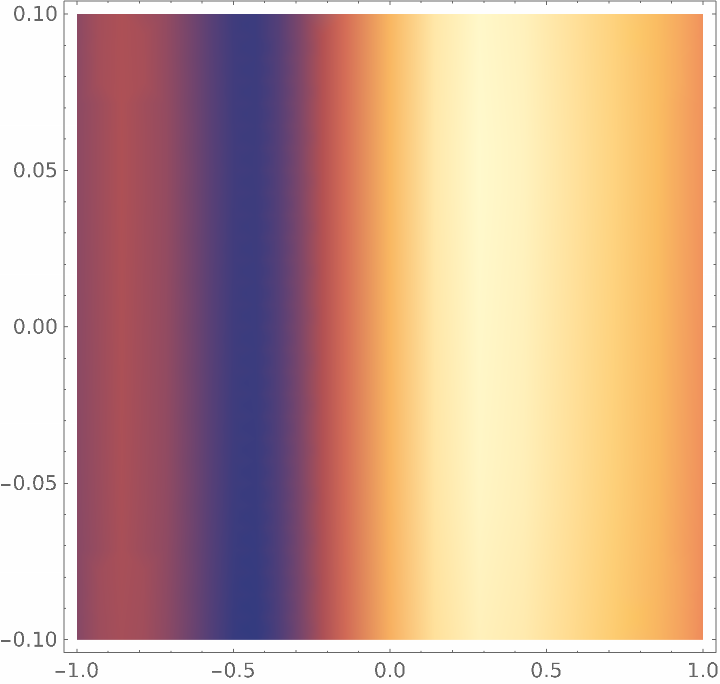 |
Plot the alignment of 30 individuals over ten time points:
| In[3]:= |
| In[4]:= |
| Out[4]= | 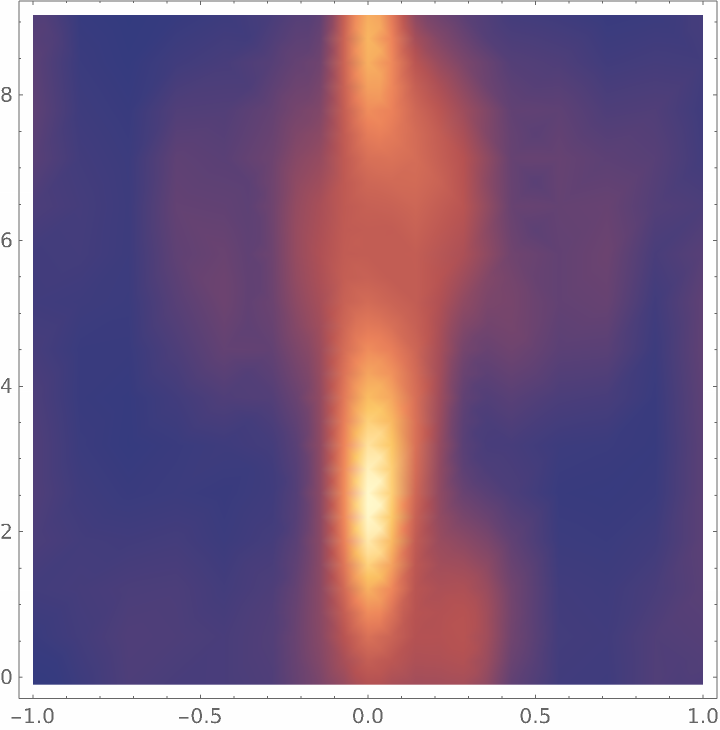 |
Each alignment plot is generated by stepping each individual in either direction until the forces (attraction for agreement and repulsion for disagreement) are balanced. Increasing the number of steps improves the accuracy of the plot, but returns diminish as steps increases:
| In[5]:= | ![data = <|{1, 2} -> 0.6, {1, 3} -> 0.6, {1, 4} -> -1., {1, 5} -> -0.6, {2, 3} -> -0.2, {2, 4} -> 0.6, {2, 5} -> 1., {3, 4} -> 0.6, {3, 5} -> 0.2, {4, 5} -> -0.6|>;
ResourceFunction["AlignmentClusterPlot"][data, Steps -> #] & /@ Range[10]](https://www.wolframcloud.com/obj/resourcesystem/images/15d/15d5b5a6-4a1a-432e-8b17-8cc3fd39d90d/3dc42440efd23e2c.png) |
| Out[6]= | 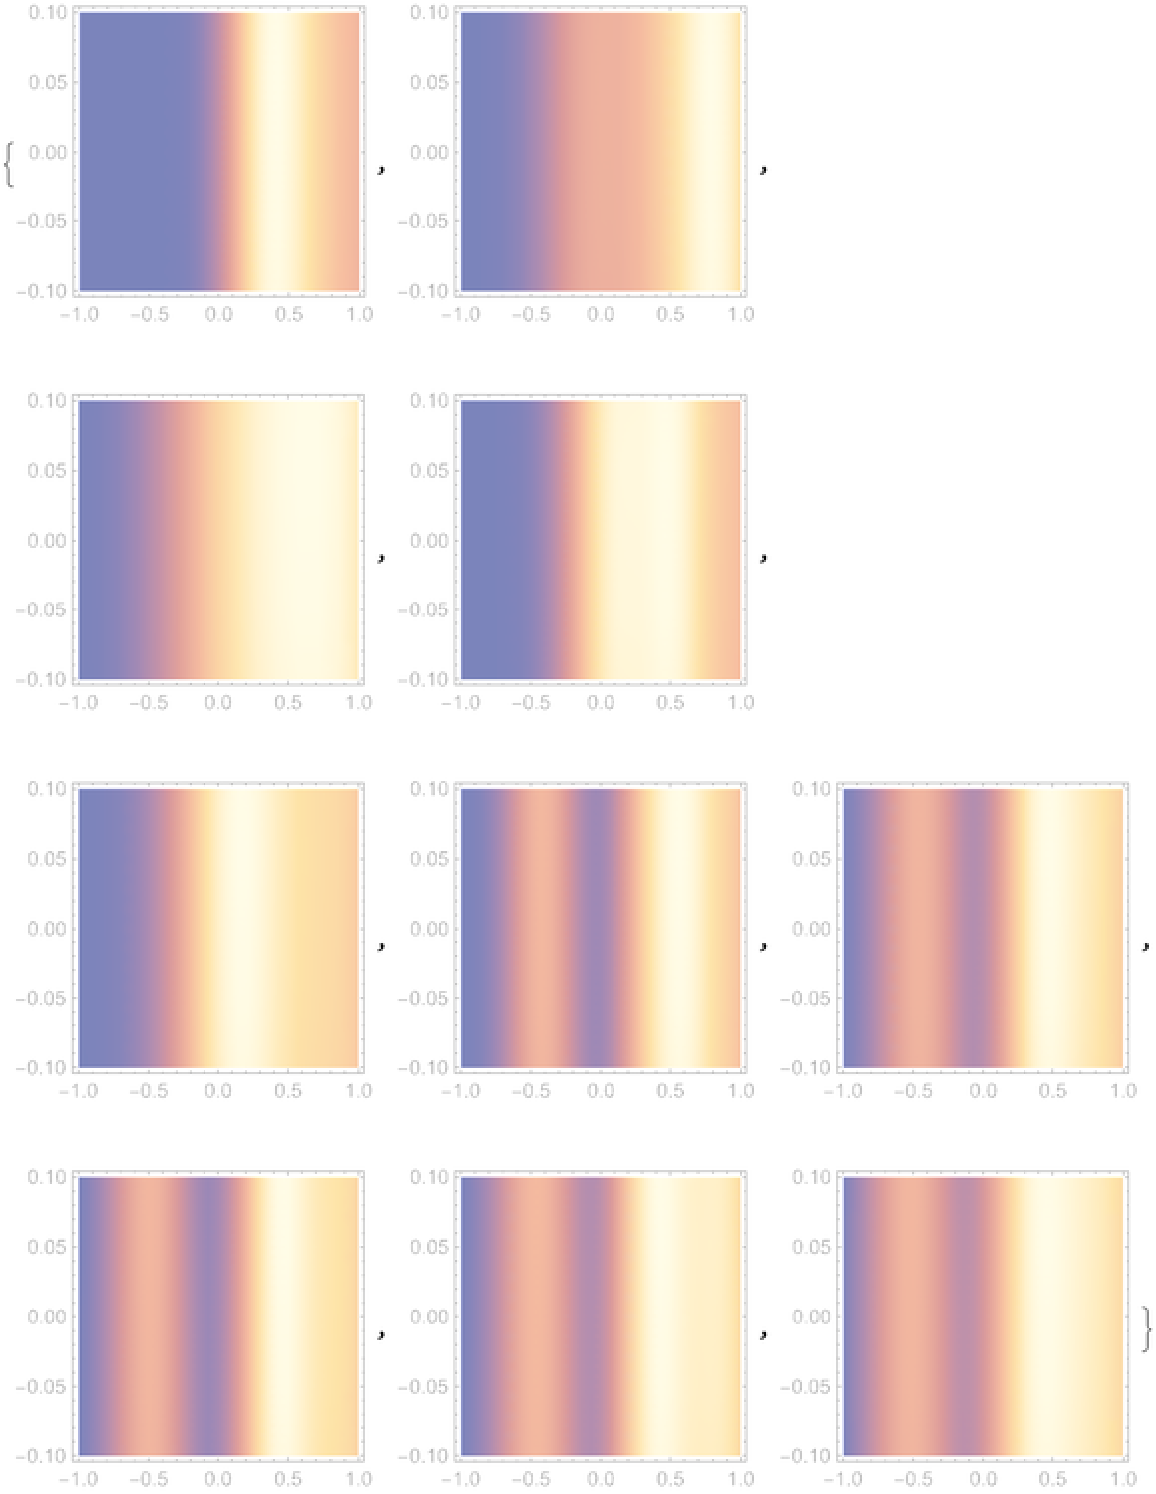 |
Particularly volatile data can lead to artifacts in the plot:
| In[7]:= | ![data = <|{1, 2} -> -0.2, {1, 3} -> 0.2, {1, 4} -> 0.2, {1, 5} -> 0.2, {1, 6} -> 0.2, {1, 7} -> 0.2, {1, 8} -> -0.2, {1, 9} -> 0.2, {1, 10} -> 0.2, {2, 3} -> -0.6, {2, 4} -> 0.2, {2, 5} -> -0.6, {2, 6} -> 0.2, {2, 7} -> 0.2, {2, 8} -> 0.6, {2, 9} -> 1., {2, 10} -> 0.2, {3, 4} -> 0.6, {3, 5} -> -0.2, {3, 6} -> 0.6, {3, 7} -> -0.2, {3, 8} -> 0.2, {3, 9} -> 0.6, {3, 10} -> -0.2, {4, 5} -> -0.2, {4, 6} -> -1., {4, 7} -> 0.6, {4, 8} -> 0.2, {4, 9} -> -0.2, {4, 10} -> 0.6, {5, 6} -> -0.2, {5, 7} -> -0.2, {5, 8} -> 1., {5, 9} -> 0.6, {5, 10} -> 0.6, {6, 7} -> 0.6, {6, 8} -> 0.2, {6, 9} -> -0.2, {6, 10} -> 0.6, {7, 8} -> 0.2, {7, 9} -> -0.2, {7, 10} -> -0.2, {8, 9} -> -0.6, {8, 10} -> -0.6, {9, 10} -> -0.2|>;
ResourceFunction["AlignmentClusterPlot"][data, Steps -> 10]](https://www.wolframcloud.com/obj/resourcesystem/images/15d/15d5b5a6-4a1a-432e-8b17-8cc3fd39d90d/7557a765d7daf461.png) |
| Out[12]= | 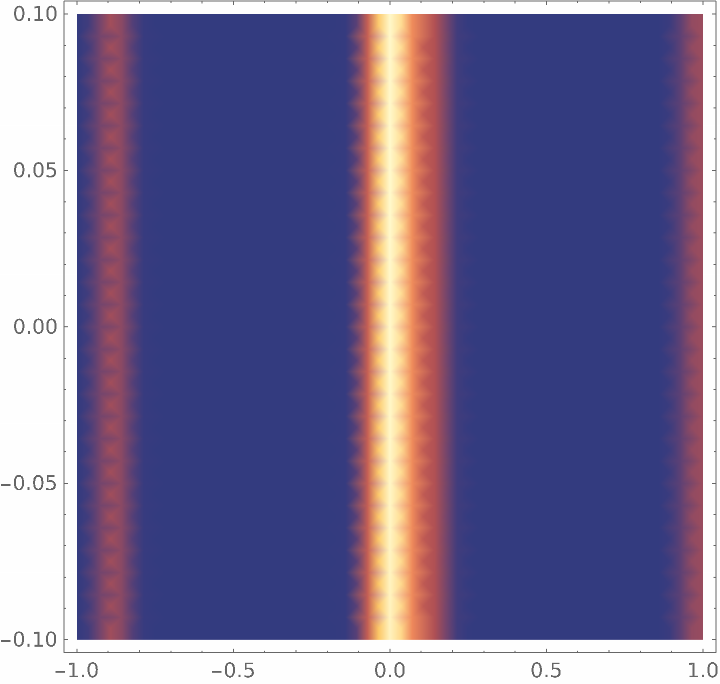 |
Visualize the level of agreement in the voting record of 50 members of Congress on four particular votes:
| In[13]:= | ![(* Evaluate this cell to get the example input *) CloudGet["https://www.wolframcloud.com/obj/5ebf0827-1113-43bb-aaa5-7b3459640a52"]](https://www.wolframcloud.com/obj/resourcesystem/images/15d/15d5b5a6-4a1a-432e-8b17-8cc3fd39d90d/1d84c318f91f16cd.png) |
| Out[14]= | 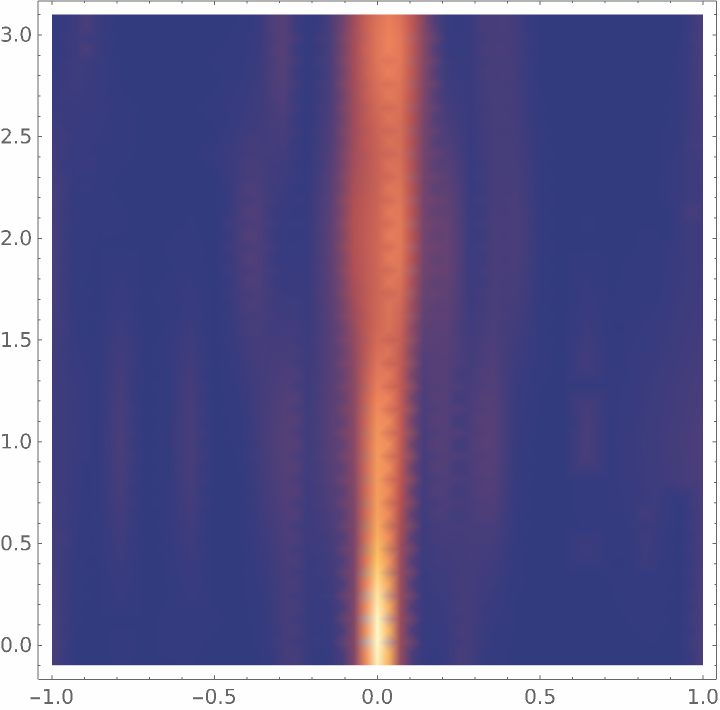 |
Wolfram Language 13.0 (December 2021) or above
This work is licensed under a Creative Commons Attribution 4.0 International License