Wolfram Function Repository
Instant-use add-on functions for the Wolfram Language
Function Repository Resource:
Find the path matrix of a graph
ResourceFunction["GraphPathMatrix"][g] gives the path matrix of the graph g. |
Find the path matrix representation of a directed graph:
| In[1]:= | ![ResourceFunction["GraphPathMatrix"][\!\(\*
GraphicsBox[
NamespaceBox["NetworkGraphics",
DynamicModuleBox[{Typeset`graph = HoldComplete[
Graph[{$CellContext`\[ScriptCapitalA], $CellContext`\[ScriptCapitalB], $CellContext`\[ScriptCapitalC], $CellContext`\[ScriptCapitalE], $CellContext`\[ScriptCapitalD], $CellContext`\[ScriptCapitalG], $CellContext`\[ScriptCapitalH]}, {{{1,
2}, {2, 3}, {3, 4}, {4, 5}, {5, 6}, {6, 2}, {3, 7}, {1, 7}}, Null}, {VertexShapeFunction -> {"Name"}}]]},
TagBox[GraphicsGroupBox[
GraphicsComplexBox[{{2.733309926992625, 1.139507749446123}, {
1.7120684494104554`, 1.196328991389978}, {
1.7120466999747426`, 0.22094561816968322`}, {
0.6414468573710435, 0.}, {0., 0.7087881142831897}, {
0.6411100015694988, 1.4170433452358484`}, {
2.731194525723913, 0.2772567560767854}}, {
{Hue[0.6, 0.7, 0.5], Opacity[0.7], Arrowheads[Medium], ArrowBox[{{1, 2}, {1, 7}, {2, 3}, {3, 4}, {3, 7}, {4, 5}, {5, 6}, {6, 2}}, 0.05659194539806142]},
{Hue[0.6, 0.2, 0.8], EdgeForm[{GrayLevel[0], Opacity[0.7]}], InsetBox[
PaneBox["\[ScriptCapitalA]",
Alignment->Center,
ImageMargins->2], 1,
BaseStyle->"Graphics"], InsetBox[
PaneBox["\[ScriptCapitalB]",
Alignment->Center,
ImageMargins->2], 2,
BaseStyle->"Graphics"], InsetBox[
PaneBox["\[ScriptCapitalC]",
Alignment->Center,
ImageMargins->2], 3,
BaseStyle->"Graphics"], InsetBox[
PaneBox["\[ScriptCapitalE]",
Alignment->Center,
ImageMargins->2], 4,
BaseStyle->"Graphics"], InsetBox[
PaneBox["\[ScriptCapitalD]",
Alignment->Center,
ImageMargins->2], 5,
BaseStyle->"Graphics"], InsetBox[
PaneBox["\[ScriptCapitalG]",
Alignment->Center,
ImageMargins->2], 6,
BaseStyle->"Graphics"], InsetBox[
PaneBox["\[ScriptCapitalH]",
Alignment->Center,
ImageMargins->2], 7,
BaseStyle->"Graphics"]}}]],
MouseAppearanceTag["NetworkGraphics"]],
AllowKernelInitialization->False]],
DefaultBaseStyle->{"NetworkGraphics", FrontEnd`GraphicsHighlightColor -> Hue[0.8, 1., 0.6]},
FormatType->TraditionalForm,
FrameTicks->None]\)] // MatrixForm](https://www.wolframcloud.com/obj/resourcesystem/images/127/1279fd56-2c54-49ac-81d0-8f7ed2fab1e0/7da769311280cbeb.png) |
| Out[1]= |  |
A random graph:
| In[2]:= |
| Out[2]= |  |
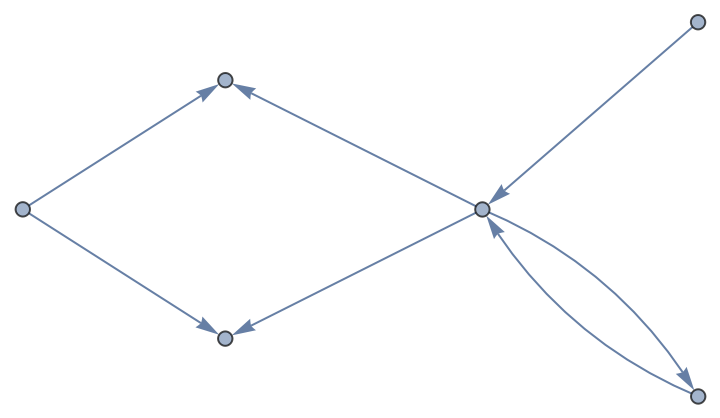
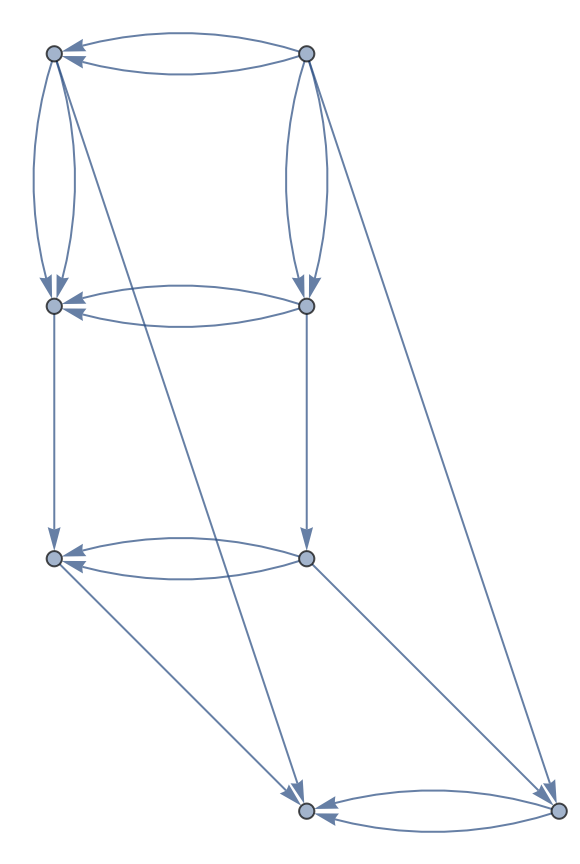
A directed graph generated from the Price graph distribution:
| In[3]:= | ![ResourceFunction["GraphPathMatrix"][
Echo[DirectedGraph[RandomGraph[PriceGraphDistribution[7, 2, 1]], "Random"]]] // MatrixForm](https://www.wolframcloud.com/obj/resourcesystem/images/127/1279fd56-2c54-49ac-81d0-8f7ed2fab1e0/65baf7b246a1ef95.png) |
| Out[3]= |  |
Random cycle graph:
| In[4]:= |
| Out[4]= |  |
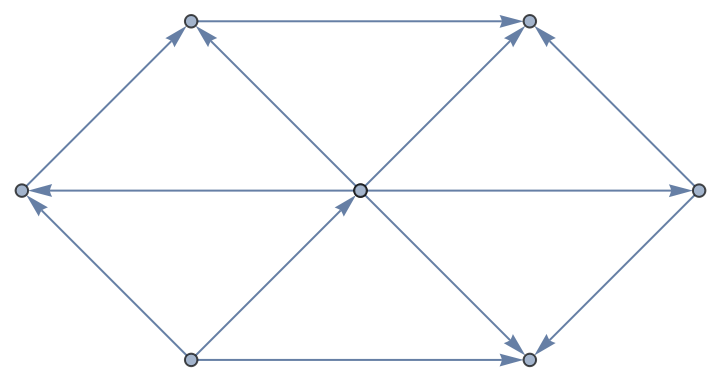
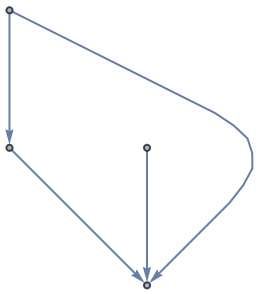
Directed graph from graph product:
| In[5]:= | ![ResourceFunction["GraphPathMatrix"][
Echo[DirectedGraph[GraphProduct[\!\(\*
GraphicsBox[
NamespaceBox["NetworkGraphics",
DynamicModuleBox[{Typeset`graph = HoldComplete[
Graph[{1, 2, 3, 4}, {Null, {{1, 2}, {2, 3}, {3, 4}, {4, 1}}}, {FrameTicks -> None, VertexCoordinates -> {{1., 6.123233995736766*^-17}, {
1.2246467991473532`*^-16, -1.}, {-1., -1.8369701987210297`*^-16}, {-2.4492935982947064`*^-16, 1.}}}]], Typeset`boxes = GraphicsGroupBox[{{
Directive[
Hue[0.6, 0.2, 0.8],
EdgeForm[
Directive[
GrayLevel[0],
Opacity[0.7]]]],
TagBox[
DiskBox[{1., 6.123233995736766*^-17}, 0.02261146496815286], "DynamicName", BoxID -> "VertexID$1"],
TagBox[
DiskBox[{1.2246467991473532`*^-16, -1.}, 0.02261146496815286], "DynamicName", BoxID -> "VertexID$2"],
TagBox[
DiskBox[{-1., -1.8369701987210297`*^-16}, 0.02261146496815286], "DynamicName", BoxID -> "VertexID$3"],
TagBox[
DiskBox[{-2.4492935982947064`*^-16, 1.}, 0.02261146496815286], "DynamicName", BoxID -> "VertexID$4"]}, {
Directive[
Opacity[0.7],
Hue[0.6, 0.7, 0.5]],
LineBox[{{
DynamicLocation["VertexID$1", Automatic, Center],
DynamicLocation["VertexID$2", Automatic, Center]}, {
DynamicLocation["VertexID$1", Automatic, Center],
DynamicLocation["VertexID$4", Automatic, Center]}, {
DynamicLocation["VertexID$2", Automatic, Center],
DynamicLocation["VertexID$3", Automatic, Center]}, {
DynamicLocation["VertexID$3", Automatic, Center],
DynamicLocation["VertexID$4", Automatic, Center]}}]}}]},
DynamicBox[GraphComputation`NetworkGraphicsBox[
1, Typeset`graph, Typeset`boxes], {CachedValue :> Typeset`boxes, SingleEvaluation -> True, SynchronousUpdating -> False, TrackedSymbols :> {}},
ImageSizeCache->{{0.13407836914062776`, 56.56984008789062}, {-30.524476953124996`, 25.911284765625}}]]],
DefaultBaseStyle->{"NetworkGraphics", FrontEnd`GraphicsHighlightColor -> Hue[0.8, 1., 0.6]},
FrameTicks->None,
ImageSize->{56.70391845703125, Automatic}]\), \!\(\*
GraphicsBox[
NamespaceBox["NetworkGraphics",
DynamicModuleBox[{Typeset`graph = HoldComplete[
Graph[{1, 2}, {Null, {{1, 2}}}]], Typeset`deleteGraphTag},
TagBox[GraphicsComplexBox[{{1., 0.}, {-1., 0.}}, {
{Hue[0.6, 0.7, 0.5], Opacity[0.7],
{Arrowheads[0.], ArrowBox[{1, 2}, 0.02261146496815286]}},
{Hue[0.6, 0.2, 0.8], EdgeForm[{GrayLevel[0], Opacity[0.7]}], DiskBox[1, 0.02261146496815286], DiskBox[2, 0.02261146496815286]}}],
MouseAppearanceTag["NetworkGraphics"]],
AllowKernelInitialization->False]],
DefaultBaseStyle->{"NetworkGraphics", FrontEnd`GraphicsHighlightColor -> Hue[0.8, 1., 0.6]},
FormatType->TraditionalForm,
FrameTicks->None]\)], "Random"]]] // MatrixForm](https://www.wolframcloud.com/obj/resourcesystem/images/127/1279fd56-2c54-49ac-81d0-8f7ed2fab1e0/14f901932e713fa2.png) |
| Out[5]= |  |
Directed graph from graph product of multigraphs:
| In[6]:= | ![ResourceFunction["GraphPathMatrix"][
Echo[DirectedGraph[GraphProduct[\!\(\*
GraphicsBox[
NamespaceBox["NetworkGraphics",
DynamicModuleBox[{Typeset`graph = HoldComplete[
Graph[{1, 2, 3, 4}, {{{1, 2}, {1, 2}, {2, 3}, {1, 4}, {3, 4}}, Null}, {EdgeStyle -> {
Arrowheads[0.1]}}]], Typeset`deleteGraphTag},
TagBox[GraphicsComplexBox[CompressedData["
1:eJxdk38s1GEcx7/nOMrEFJKl5bYUwvIrm+7zbHZ+LPOrTmhr2KEZo7WpxYZC
GaHOVlL+iHH9wmUZRz3D/Fq5rBolSc6M7txxorkd5ew85nnv+92z1/N8nuf7
ee2752hSZnSyEcMwoZuvftwdM0RNULwIu0d6frt+p85qMN7ZeuEpDBWO9LQ6
myJ0TTowltgII/yszPJFDkKvuIrHri9AuephUdvOQQk3B5K4IU1wdnZGys7n
oEHv4qGh+BYoiDLSTQVxUGylsI/nL4HJZ931Fyw4qCW+QqV8J4F7Jg79JZ9N
0GJUu2ORQgLVW9nh1BR9jEh9pnbGP9vNiJzHjeFdFGtY5Ht5TevsIx0sFGno
p83ega/LYyFPQ782e0Y0icGbbPDxlFZUXrFkIcbg65fjcSbsK4MM/pjyx5Q/
pvwx5Y8pf0z5Y8ofU/6Y8seUP6b8MeWPKX9M+WPKH2/7V1v4+dT1iGGI63p1
5bEpcmx+eW68Vwp3HiWd/HXCFN3oqrYZFvWBv7DBvbeBg45rHlSG9MtgMn81
u2Y/B4XlXh5uzv0C2YvRnLQsEzST6nSoxHYcjFs7J9zfGiP1jwC72INTUDjo
qZ1fY6PDAX5F95PlsOb5+lLNMTbKCWfGljWzkKiEvYGBm74igQ18m4NTfGtn
EWYhWaEg7Hzxb1AHldSu+rDQtBOT66VVwMOl+qyMBgZVZAjqJ7wXwIWf/OSv
FYNGhYK+CF8VRN6qCnVRbECHGfOzbEMFTrJGizLxOvjGCZZEd9UwmGZ8+0C8
DsJjBDqhXA3Bcc/f9P7Tknux9TtSVgnXRWjrI7R/CMtPl28+y8AyMNdJHw1Z
TzRvSzBv27lnMC/izYtUhLs69VEQ9tcfJ58jrN+dYD5L2GsrcsK1ktIxyJwi
LLMsrSpo/E76sUvvtk3vHiXr9telPuD2ibA4VTm98vE94SqevsFewlPzo7qW
kA7CGy4fSvaZiOE/rUjWKw==
"], {
{Hue[0.6, 0.7, 0.5], Opacity[0.7], Arrowheads[0.1], ArrowBox[
BezierCurveBox[{1, {0.16444074718311652`, 2.4999999999999996`}, 2}], 0.030239520958083826`], ArrowBox[
BezierCurveBox[{1, {-0.16444074718311652`, 2.4999999999999996`}, 2}], 0.030239520958083826`], ArrowBox[
BezierCurveBox[{1, 39, 40, 41, 42, 43, 44, 45, 46, 47, 48, 49, 50, 51, 52, 53, 54, 55, 56, 57, 58, 59, 60, 61, 62, 63, 64, 65, 66, 67, 68, 69, 70, 71, 72, 73, 4}], 0.030239520958083826`], ArrowBox[{2, 3}, 0.030239520958083826`], ArrowBox[{3, 4}, 0.030239520958083826`]},
{Hue[0.6, 0.2, 0.8], EdgeForm[{GrayLevel[0], Opacity[0.7]}], DiskBox[1, 0.030239520958083826], DiskBox[2, 0.030239520958083826], DiskBox[3, 0.030239520958083826], DiskBox[4, 0.030239520958083826]}}],
MouseAppearanceTag["NetworkGraphics"]],
AllowKernelInitialization->False]],
DefaultBaseStyle->{"NetworkGraphics", FrontEnd`GraphicsHighlightColor -> Hue[0.8, 1., 0.6]},
FormatType->TraditionalForm,
FrameTicks->None]\), \!\(\*
GraphicsBox[
NamespaceBox["NetworkGraphics",
DynamicModuleBox[{Typeset`graph = HoldComplete[
Graph[{1, 2}, {{{1, 2}, {1, 2}}, Null}, {EdgeStyle -> {
Arrowheads[0.08]}}]], Typeset`deleteGraphTag},
TagBox[GraphicsComplexBox[CompressedData["
1:eJxTTMoPSmViYGBQAmIQDQEf7BnQAHuMiLHasoU2ysJO3OfnvbEXOBGlLvR2
0X578YN7LQ+9tnco33X8euLy/Wtv7zepePTK3mGt8us52qv3a82c/JqP4ZV9
QtPxJGWPdftZ3Dg/NEu/tD9h0nbyZNSG/WXL2SbHmb6wj5iQctTOcuN+F7Ec
CXW/5/Ybovrfvdm3cX9KGgg8s/8QuEOu9fXG/cZgcNn+BZRffFn9/Mbki/Yr
oOoVkp5ubtU6bx8ANe/581v2Hyaetj8Atc9/9sbAI/+P2ztA3eM8kUFXvuyI
vQLUvf8W/eaQ/H7AXgHqn6tp75e2c+62/3Ac4l80/9uj+d8ezf/2aP63R/O/
PZr/7dH8b4/mf3uY/39A+TD/74CqV4L6PwFq3kuo/y9A7QuE+h/mHleo/2Hu
hfkf5p/rUP/D/AsAKn8GqA==
"], {
{Hue[0.6, 0.7, 0.5], Opacity[0.7], Arrowheads[0.08], ArrowBox[
BezierCurveBox[{1, {
0.5000000000000006, -0.16444074718311627`}, 2}], 0.01273], ArrowBox[
BezierCurveBox[{1, {0.5000000000000001, 0.16444074718311646`}, 2}], 0.01273]},
{Hue[0.6, 0.2, 0.8], EdgeForm[{GrayLevel[0], Opacity[0.7]}], DiskBox[1, 0.01273], DiskBox[2, 0.01273]}}],
MouseAppearanceTag["NetworkGraphics"]],
AllowKernelInitialization->False]],
DefaultBaseStyle->{"NetworkGraphics", FrontEnd`GraphicsHighlightColor -> Hue[0.8, 1., 0.6]},
FormatType->TraditionalForm,
FrameTicks->None,
ImageSize->{89.27401733398438, Automatic}]\)], "Random"]]] // MatrixForm](https://www.wolframcloud.com/obj/resourcesystem/images/127/1279fd56-2c54-49ac-81d0-8f7ed2fab1e0/1591880d001846f3.png) |
| Out[6]= |  |
A parametric k-ary tree graph:
| In[7]:= |
| Out[7]= |  |
A parametric complete k-ary tree graph:
| In[8]:= |
| Out[8]= |  |
A random directed graph:
| In[9]:= |
| Out[9]= |  |
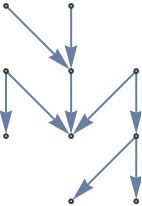
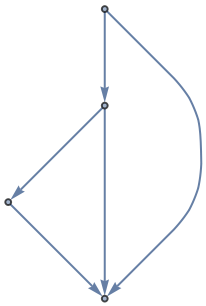
An acyclic directed graph:
| In[10]:= |
| Out[10]= |  |
Another acyclic directed graph:
| In[11]:= | ![ResourceFunction["GraphPathMatrix"][Echo[DirectedGraph[\!\(\*
GraphicsBox[
NamespaceBox["NetworkGraphics",
DynamicModuleBox[{Typeset`graph = HoldComplete[
Graph[{2, 1, 3, 4}, {{{1, 2}, {3, 2}, {4, 2}}, {{1, 3}, {3, 4}}}, {EdgeStyle -> {
Arrowheads[0.08]}}]]},
TagBox[GraphicsGroupBox[
GraphicsComplexBox[{{0., 0.43424724174389495`}, {
0.9342311127898241, 0.8686478533594477}, {
0.9340813306102785, 0.}, {1.868395490083372, 0.43417761049629644`}}, {
{Hue[0.6, 0.7, 0.5], Opacity[0.7], Arrowheads[0.08],
StyleBox[{LineBox[{1, 3}], ArrowBox[{1, 2}, 0.02153460989130551], LineBox[{3, 4}], ArrowBox[{3, 2}, 0.02153460989130551], ArrowBox[{4, 2}, 0.02153460989130551]},
FontFamily->"Arial"]},
{Hue[0.6, 0.2, 0.8], EdgeForm[{GrayLevel[0], Opacity[0.7]}],
StyleBox[{DiskBox[1, 0.02153460989130551], DiskBox[2, 0.02153460989130551], DiskBox[3, 0.02153460989130551], DiskBox[4, 0.02153460989130551]},
FontFamily->"Arial"]}}]],
MouseAppearanceTag["NetworkGraphics"]],
AllowKernelInitialization->False]],
BaseStyle->(FontFamily -> "Arial"),
DefaultBaseStyle->{"NetworkGraphics", FrontEnd`GraphicsHighlightColor -> Hue[0.8, 1., 0.6]},
FrameTicks->None,
GridLinesStyle->Directive[
GrayLevel[0.5, 0.4]],
ImageSize->{102.7890625, Automatic},
LabelStyle->{FontFamily -> "Arial"}]\), "Acyclic"]]] // MatrixForm](https://www.wolframcloud.com/obj/resourcesystem/images/127/1279fd56-2c54-49ac-81d0-8f7ed2fab1e0/32ab1c447c232357.png) |
| Out[11]= |  |
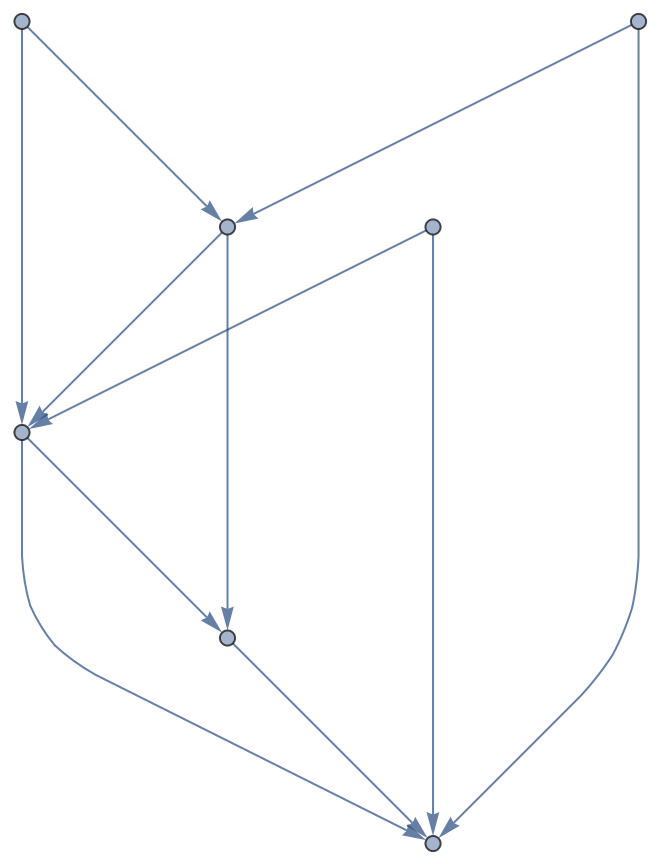
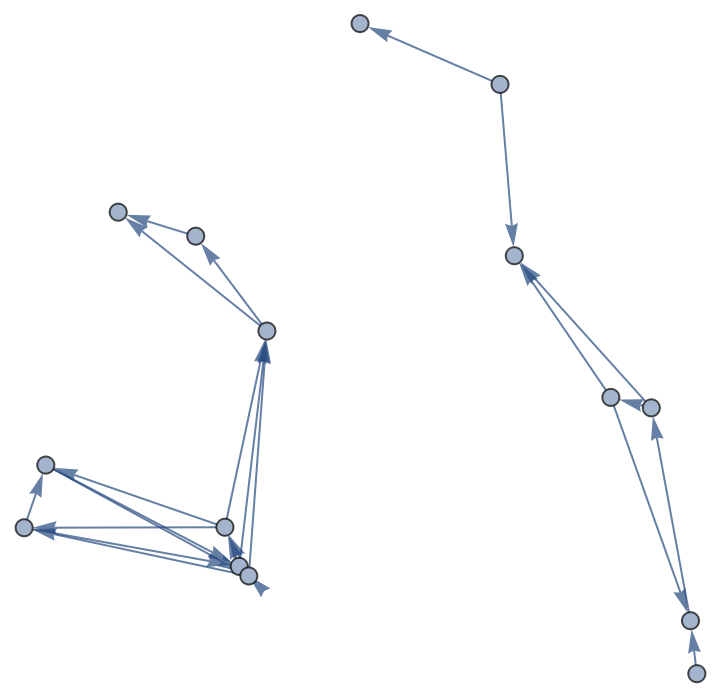
A random Bernoulli graph:
| In[12]:= | ![ResourceFunction["GraphPathMatrix"][
Echo[DirectedGraph[RandomGraph[BernoulliGraphDistribution[10, 0.3]],
"Random"]]] // MatrixForm](https://www.wolframcloud.com/obj/resourcesystem/images/127/1279fd56-2c54-49ac-81d0-8f7ed2fab1e0/3857b7cabf83fc21.png) |
| Out[12]= |  |
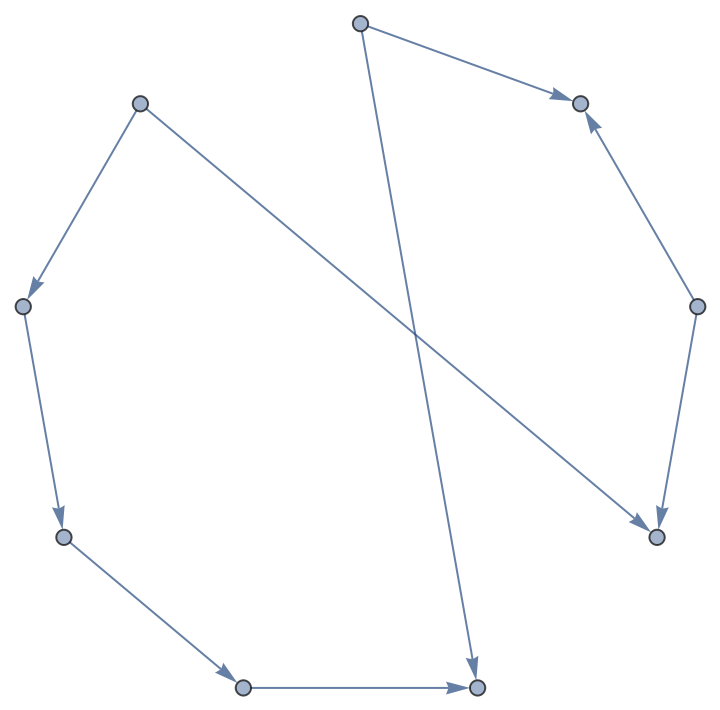
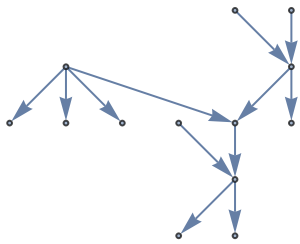
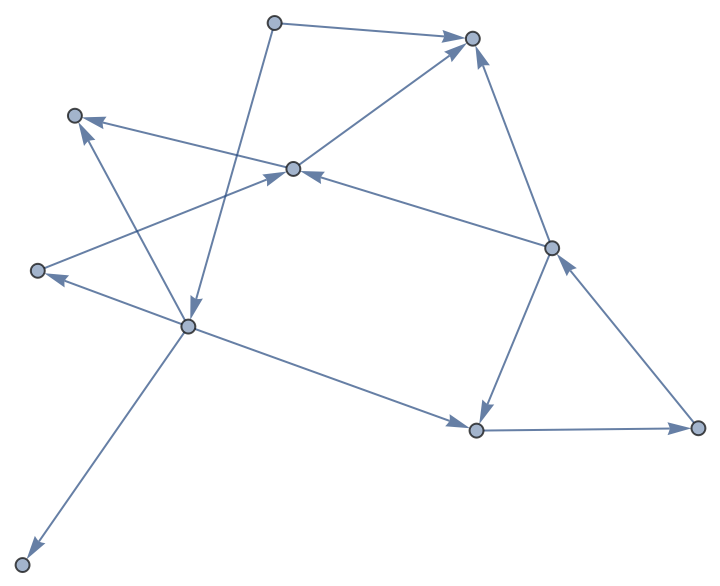
A random disconnected spatial directed graph with random orientations for the directed edges:
| In[13]:= | ![ResourceFunction["GraphPathMatrix"][
Echo[DirectedGraph[RandomGraph[SpatialGraphDistribution[15, 0.3]], "Random"]]] // MatrixForm](https://www.wolframcloud.com/obj/resourcesystem/images/127/1279fd56-2c54-49ac-81d0-8f7ed2fab1e0/3a174c0161589316.png) |
| Out[13]= |  |
Find the path matrix representation of the Petersen graph with script capital letters for the vertex names:
| In[14]:= |
| Out[14]= | 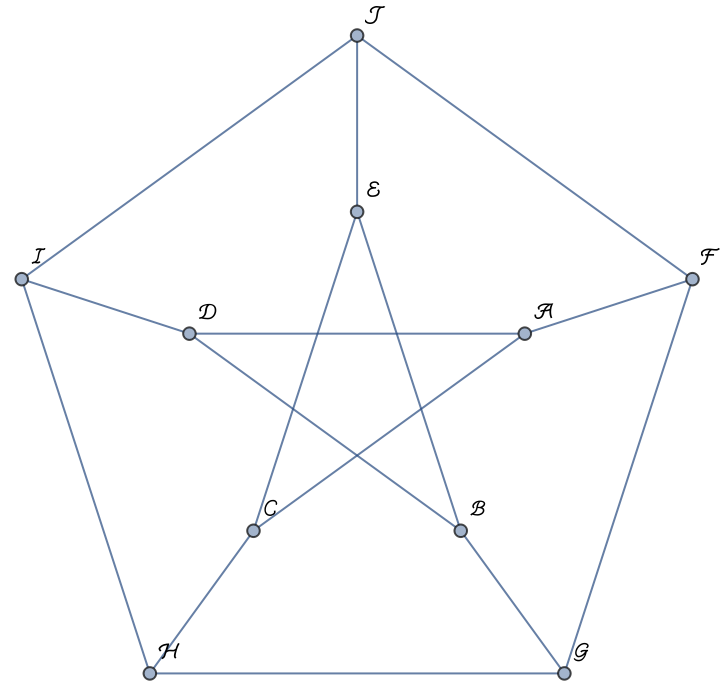 |
Find the path matrix representation of the undirected graph:
| In[15]:= |
| Out[15]= |  |
Output the matrix as a sparse array for efficiency:
| In[16]:= |
| Out[17]= |
Wolfram Language 13.2 (December 2022) or above
This work is licensed under a Creative Commons Attribution 4.0 International License