Wolfram Function Repository
Instant-use add-on functions for the Wolfram Language
Function Repository Resource:
Visualize the function evaluations done by FindMinimum
ResourceFunction["FindMinimumPlot"][f,{x,xst}] plots the steps and the points at which the function f and any of its derivatives are evaluated in FindMinimum[f,{x,xst}], superimposed on a plot of f versus x. | |
ResourceFunction["FindMinimumPlot"][f,{{x,xst},{y,yst}}] plots the steps and the points at which the bivariate function f and any of its derivatives are evaluated, superimposed on a contour plot of f as a function of x and y. | |
ResourceFunction["FindMinimumPlot"][f,range,property] returns the specified property. |
| "Result" | the result of FindMinimum |
| "Statistics" | an association showing the number of steps and evaluations of the function and its derivatives |
| "Plot" | the plot of the function and the evaluation points |
| All | association containing "Result", "Statistics" and "Plot" |
| "EvaluationStyles" | Automatic | styles used for the evaluation points |
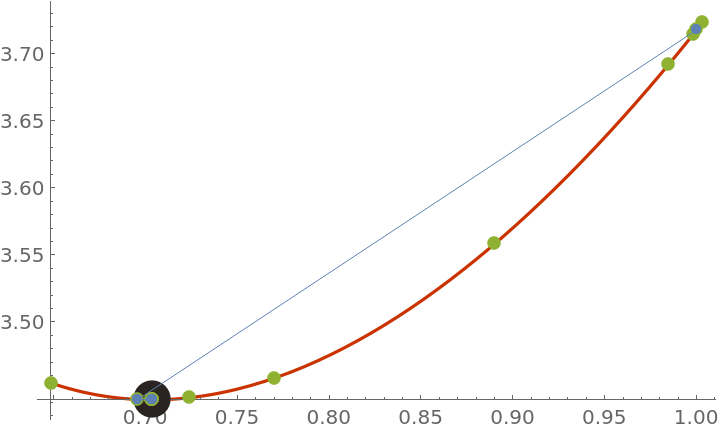
Show the steps and function evaluations used in finding a local minimum of the function exp(x)+1/x:
| In[1]:= |
|
| Out[1]= |
|
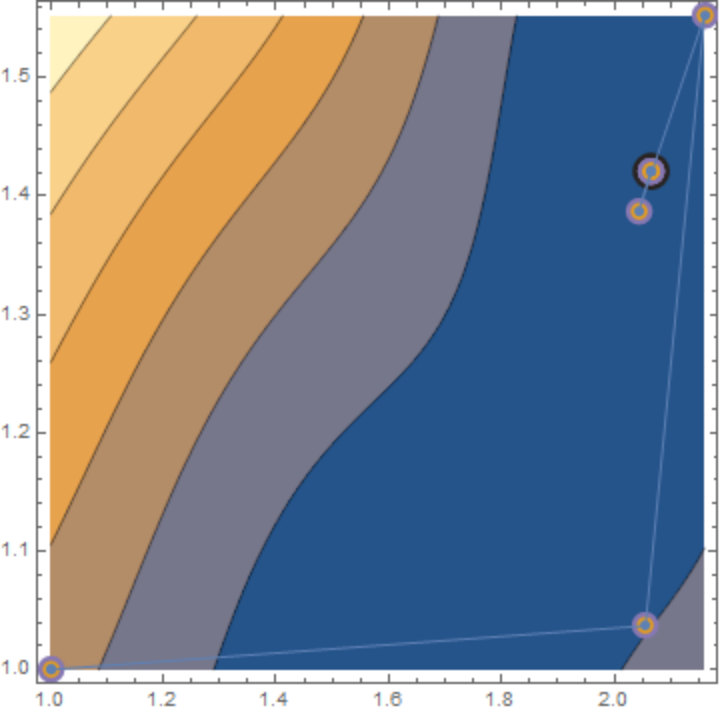
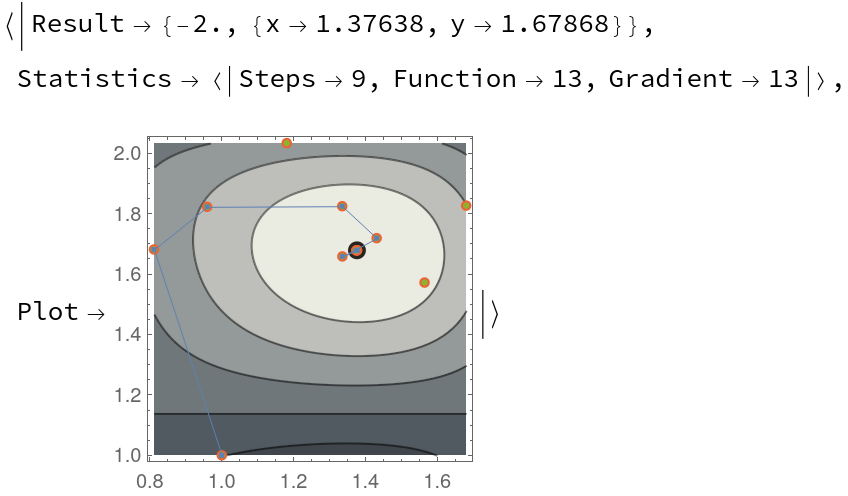
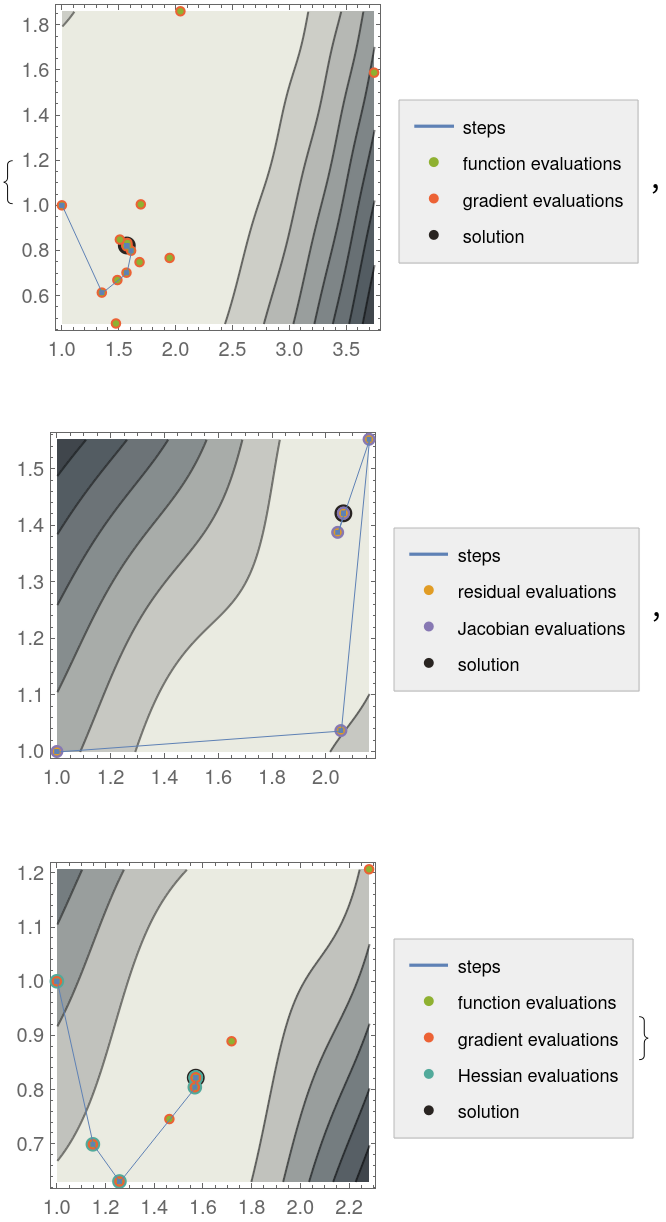
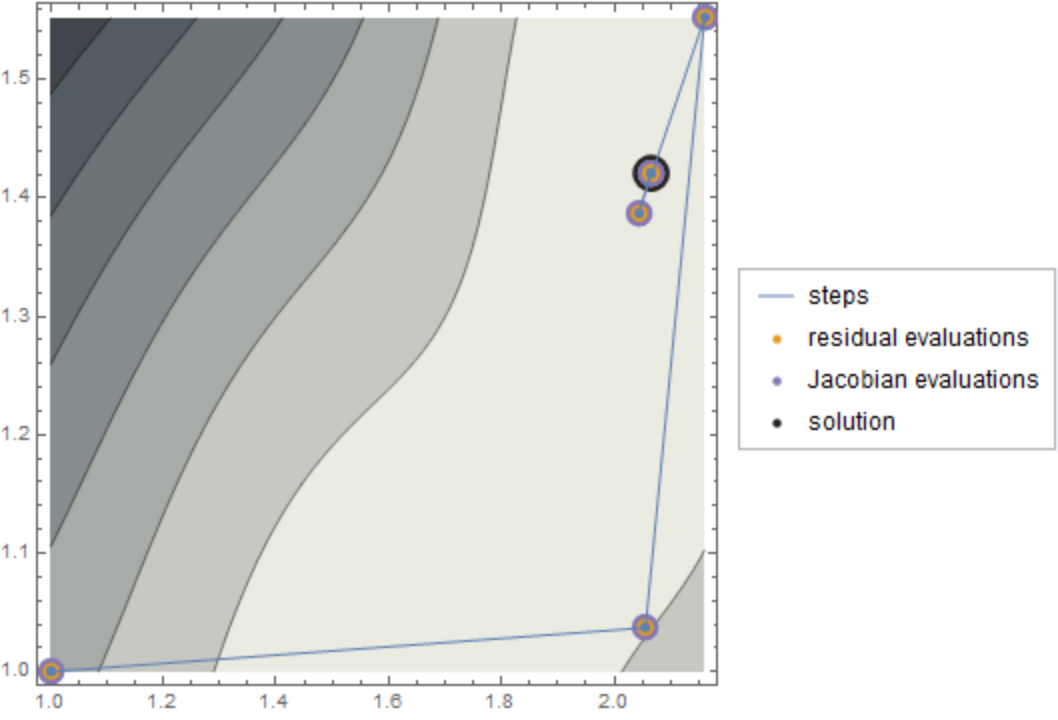
Show the steps and function evaluations used in finding a local minimum of the function cos(x2-3y)+sin(x2+y2):
| In[2]:= |
|
| Out[2]= |
|
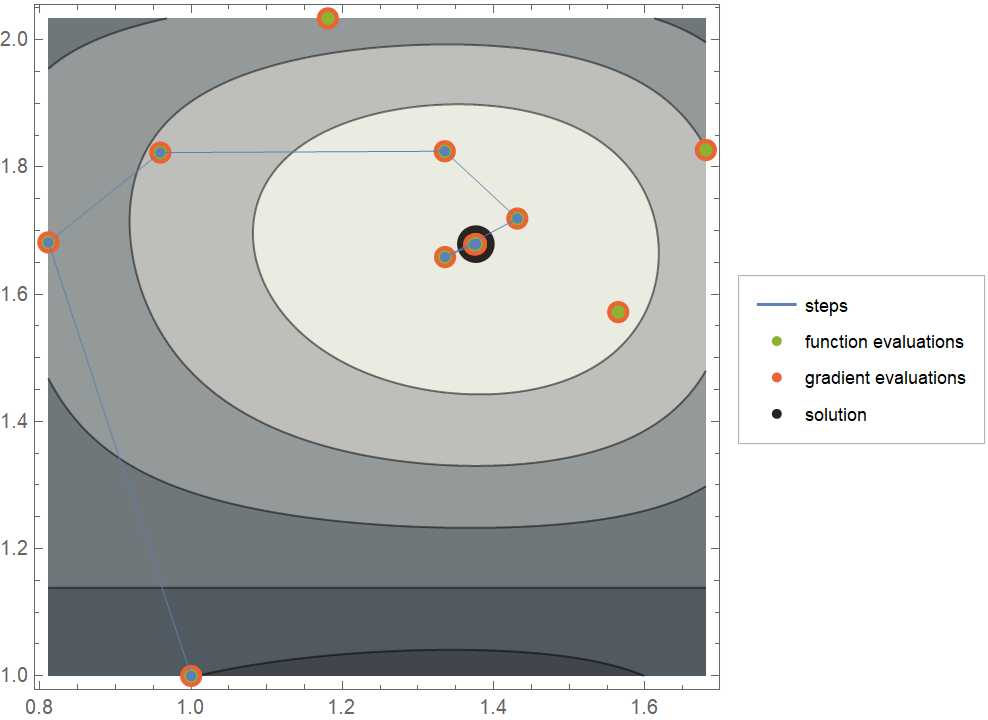
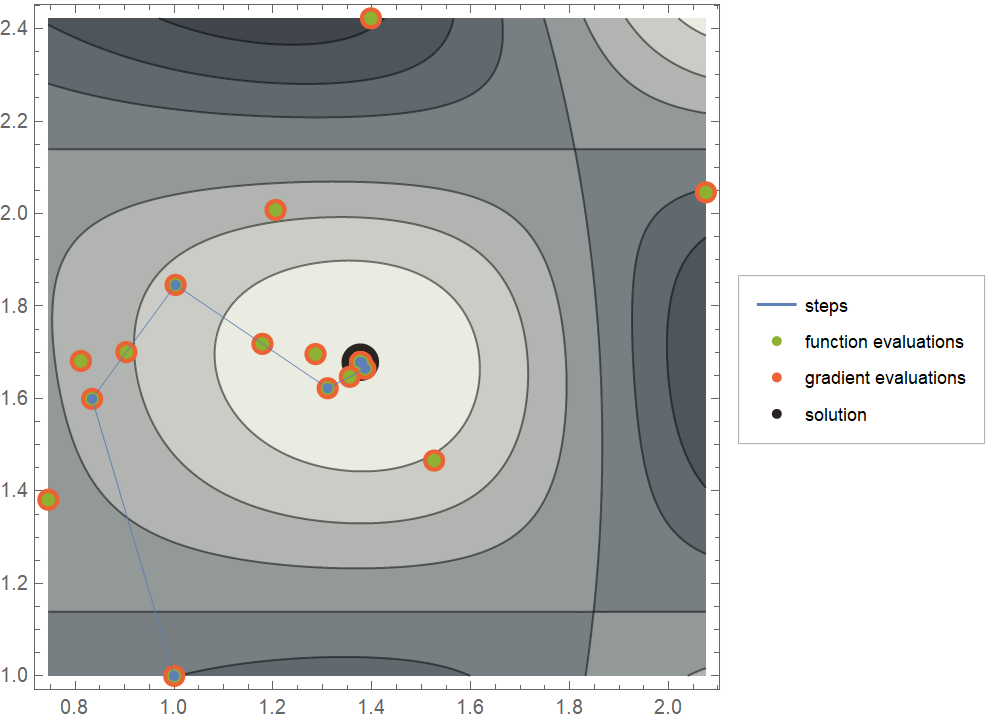
Use PlotLegends to display a legend for the evaluation points:
| In[3]:= |
|
| Out[3]= |
|
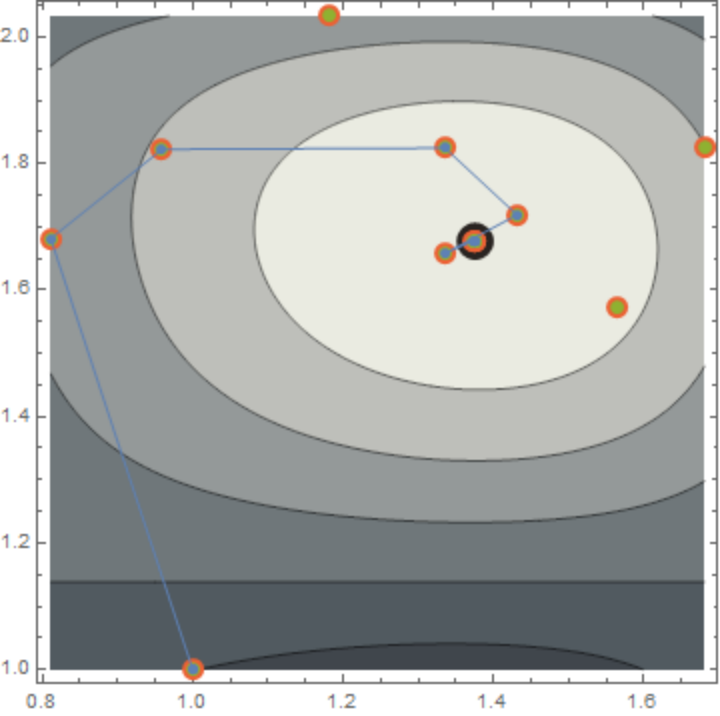
Use a different minimization method from the default:
| In[4]:= |
|
| Out[4]= |
|
Return the statistics of the evaluations done by FindMinimum:
| In[5]:= |
|
| Out[5]= |
|
Return all properties:
| In[6]:= |
|
| Out[6]= |
|
Use "EvaluationStyles" to change the style used for the evaluation points:
| In[8]:= |
![ResourceFunction["FindMinimumPlot"][
Cos[x^2 - 3 y] + Sin[x^2 + y^2], {{x, 1}, {y, 1}}, "EvaluationStyles" -> <|{"Steps" -> Directive[Blue, Thin, PointSize[0.015]], "Function" -> Directive[Green, PointSize[0.02]], "Gradient" -> Directive[Red, PointSize[0.0325]], "Hessian" -> Directive[Cyan, PointSize[0.045]], "Solution" -> PointSize[0.055]}|>, Method -> "Newton", PlotLegends -> Automatic]](https://www.wolframcloud.com/obj/resourcesystem/images/0ea/0ea03acf-24ee-4ad4-981c-d9ebdc9f030f/06358d5814d7bdee.png)
|
| Out[8]= |
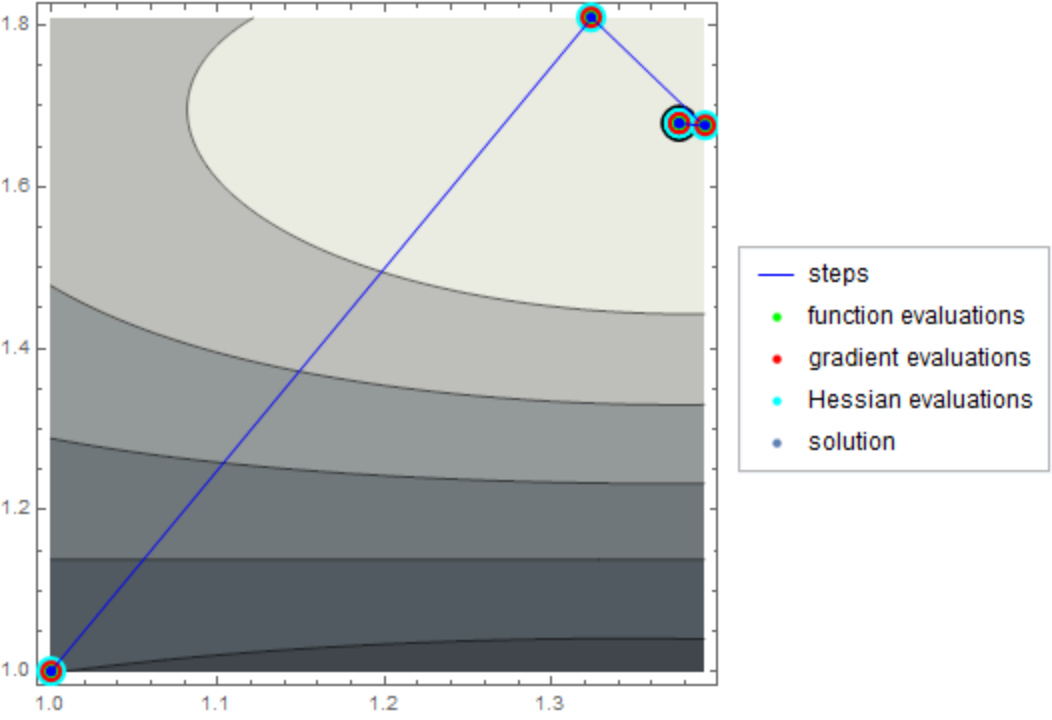
|
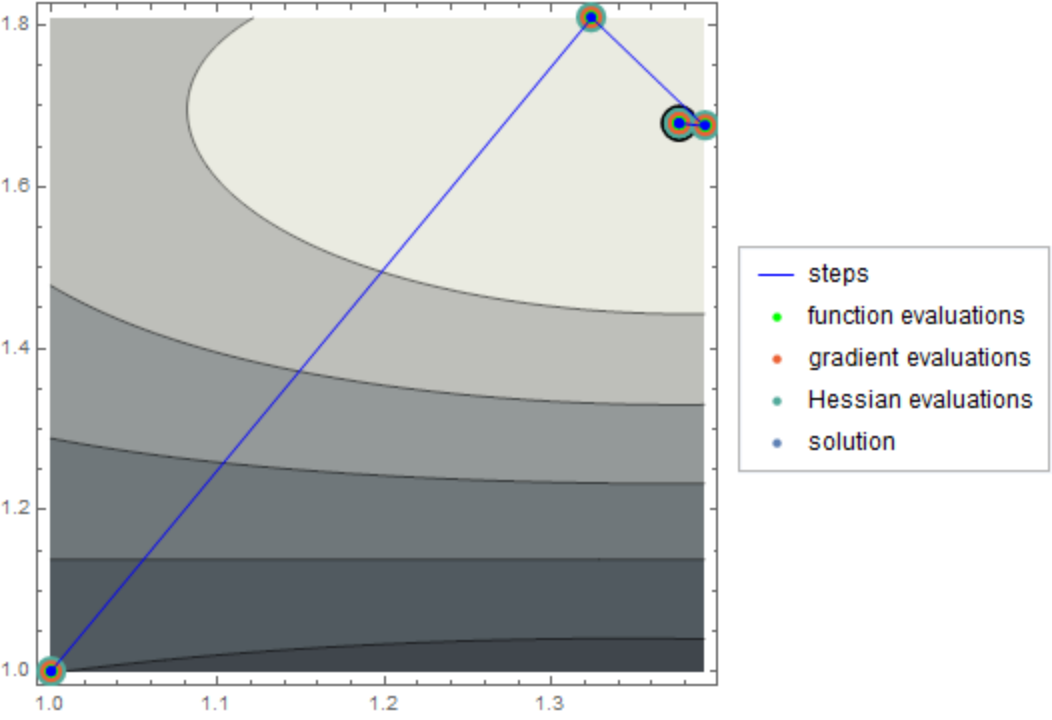
Default styles are used if a particular style is left unspecified:
| In[9]:= |
![ResourceFunction["FindMinimumPlot"][
Cos[x^2 - 3 y] + Sin[x^2 + y^2], {{x, 1}, {y, 1}}, "EvaluationStyles" -> <|{"Steps" -> Directive[Blue, Thin, PointSize[0.015]], "Function" -> Directive[Green, PointSize[0.02]], "Solution" -> PointSize[0.055]}|>, Method -> "Newton", PlotLegends -> Automatic]](https://www.wolframcloud.com/obj/resourcesystem/images/0ea/0ea03acf-24ee-4ad4-981c-d9ebdc9f030f/131f4883c875cea0.png)
|
| Out[9]= |
|
Compare different minimization methods:
| In[10]:= |
![(* Evaluate this cell to get the example input *) CloudGet["https://www.wolframcloud.com/obj/5fa87129-24b2-4ec3-a597-0259753a504f"]](https://www.wolframcloud.com/obj/resourcesystem/images/0ea/0ea03acf-24ee-4ad4-981c-d9ebdc9f030f/27b75bad2684913d.png)
|
| Out[10]= |
|
Show a legend for the evaluation points:
| In[11]:= |
|
| Out[11]= |
|
This work is licensed under a Creative Commons Attribution 4.0 International License