Wolfram Function Repository
Instant-use add-on functions for the Wolfram Language
Function Repository Resource:
Generate a graph of a specific portion of the human protein-protein interaction network for a gene
ResourceFunction["HumanProteinInteractionNetwork"][gene] creates a Graph of a specific portion of the human protein-protein interaction network given a gene or node of the network. |
| "NetworkLayers" | 1 | how many layers from the starting gene is considered |
| "ScaledGraph" | False | VertexSize of the Graph scaled based on different graph measures |
Let us find the genes interacting with A1CF:
| In[2]:= |
| Out[2]= | 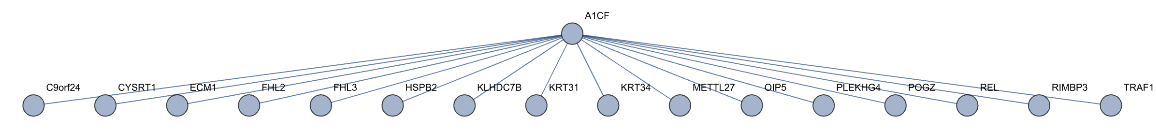 |
| In[3]:= |
| Out[3]= |
Choose the desired depth of the network:
| In[4]:= |
| Out[4]= | 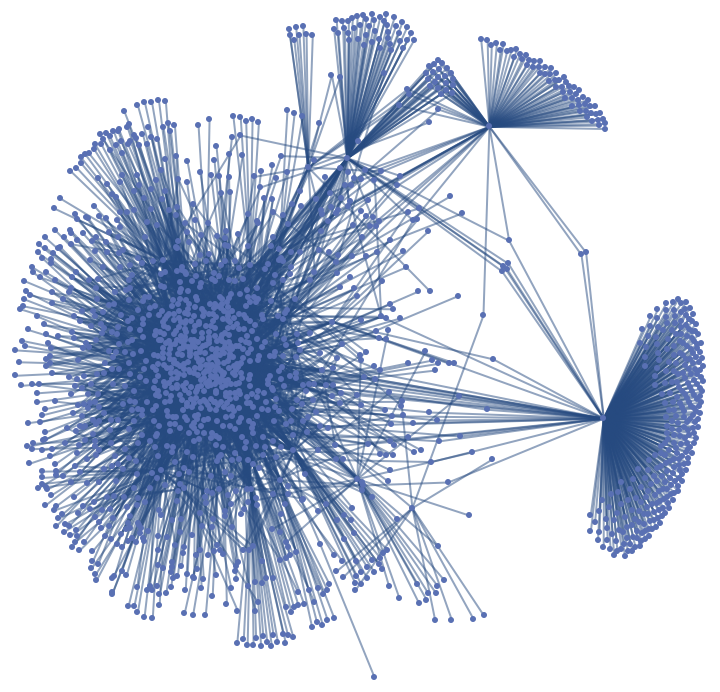 |
Choose if the VertexSize of the Graph is scaled based on its VertexDegree. When "ScaledGraph"->True we can pass other Options for ResourceFunction["VertexSizeScaledGraph"]:
| In[5]:= |
| Out[5]= | 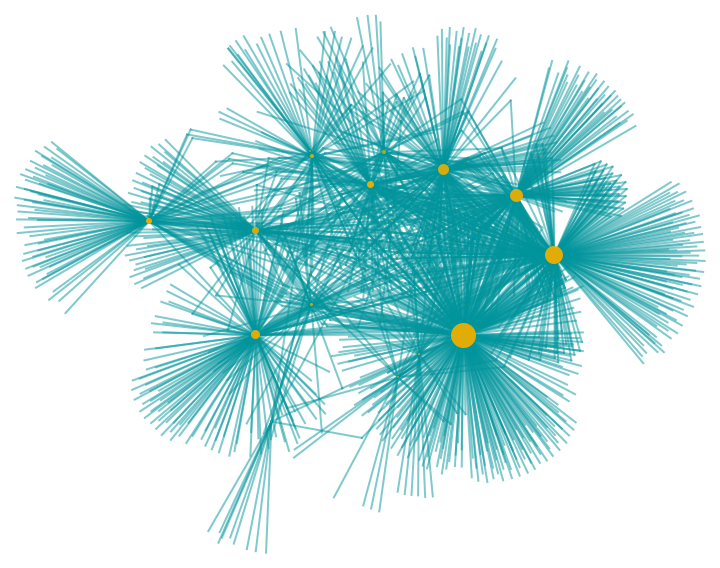 |
For a really large graph, the Graph is shown as a summary box:
| In[6]:= |
| Out[6]= |
GraphPlot can be used for visualization:
| In[7]:= |
| Out[7]= | 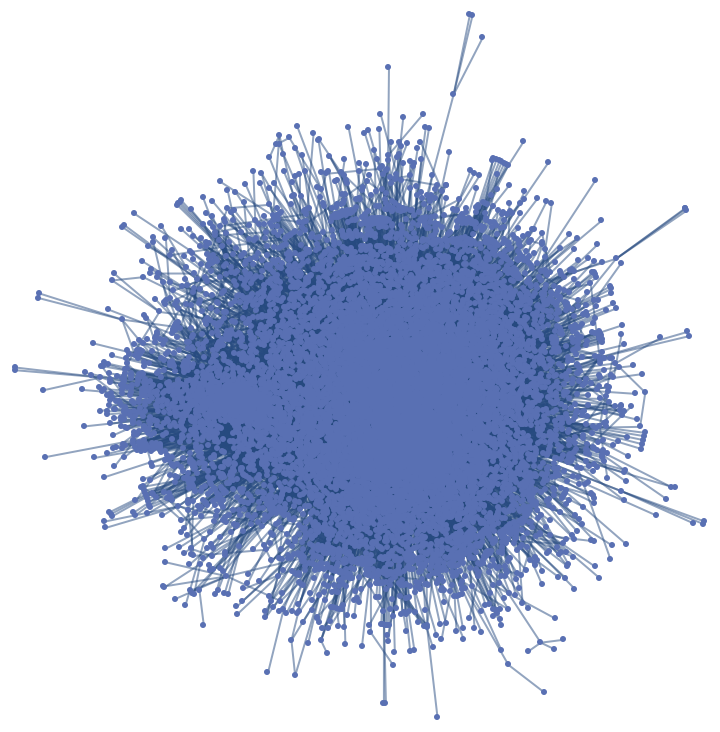 |
| In[8]:= | ![ResourceFunction["HumanProteinInteractionNetwork"]["C9orf24", "NetworkLayers" -> 2, "ScaledGraph" -> True, "MaxVertexSize" -> 40, VertexStyle -> RGBColor[0.91, 0.68, 0], EdgeStyle -> RGBColor[0, 0.58, 0.61], GraphLayout -> "BalloonEmbedding", VertexLabels -> Placed["Name", Tooltip]]](https://www.wolframcloud.com/obj/resourcesystem/images/09f/09f08b57-3f5a-4751-bbde-2f0a208547b5/5fdf1086c174be92.png) |
| Out[8]= |  |
This work is licensed under a Creative Commons Attribution 4.0 International License