Wolfram Function Repository
Instant-use add-on functions for the Wolfram Language
Function Repository Resource:
Plot a surface defined parametrically together with various types of sections of the surface
ResourceFunction["SectionParametricPlot3D"][{fx,fy,fz},{u,umin,umax},{v,vmin,vmax},opts] plots a 3D surface parametrized by u and v with sections specified by the options "XSection","YSection","ZSection","VSection" and "OSection". | |
ResourceFunction["SectionParametricPlot3D"][f,u,v,{{gx,gy},…},{t,tmin,tmax}] plots a 3D surface together with the generalized cylinders described parametrically by {{gx,gy},…} over {t,tmin,tmax}. | |
ResourceFunction["SectionParametricPlot3D"][f,u,v,{{gx,gy,gz},…},t] plots the cylinders to the z-value of gz. |
| "ColorFunctionSection" | Automatic | specifies the color function(s) for the section |
| "ColorFunctionSurface" | Automatic | specifies the color function(s) for the surface |
| "CylinderBase" | Automatic | determines the z-value to which cylinders are projected |
| "CylinderRange" | Automatic | determines the range of the cylinder |
| "CylinderStyle" | Opacity[0.5] | specifies style for the cylinder; it ignores color specifications |
| "DrawCylinder" | True | whether to draw the cylinder determining parametrically defined sections |
| "DrawPoint" | {} | a list of points to be included in the plot |
| "DrawPointStyle" | {{Red,PointSize[Large]}} | styles to be applied to the points specified with the option "DrawPoint" |
| "OSection" | {} | draws an oblique section determined by functions of the form z=f[x],z=g[y] or z=h[x,y] |
| "OSectionStyle" | {{Red,Tube[.02]}} | styles to be applied to the oblique sections |
| "PlotPointsSection" | 75 | specifies how many initial sample points to use in plotting sections |
| PlotStyle | Opacity[0.7] | graphics directive for the style for each surface |
| "SectionStyle" | {{Red,Tube[.02]}} | styles to be applied to sections defined parametrically by {gx,gy} |
| "SectionVariables" | {} | specify independent variables used to define v-sections or o-sections |
| "Surface" | True | whether to return the surface in the plot |
| "VSection" | {} | draws vertical section(s) for a function or list of functions of the form y=f[x] or x=g[y] |
| "VSectionStyle" | {{Red,Tube[.02]}} | styles to be applied to the vertical sections |
| "XSection" | {} | draws vertical sections parallel to the yz-plane determined by the value or list of values of x |
| "XSectionStyle" | {{Red,Tube[.02]}} | styles to be applied to the x-sections |
| "YSection" | {} | draws vertical sections parallel to the xz-plane determined by the value or list of values of y |
| "YSectionStyle" | {{Red,Tube[.02]}} | styles to be applied to the y-sections |
| "ZSection" | {} | draws horizontal sections parallel to the xy-plane determined by the value or list of values of z |
| "ZSectionStyle" | {{Red,Tube[.02]}} | styles to be applied to the z-sections |
Plot a paraboloid with an elliptical section:
| In[1]:= | ![ResourceFunction[
"SectionParametricPlot3D"][{r Cos[t], r Sin[t], r^2}, {t, 0, 2 \[Pi]}, {r, 0, 1}, {Cos[u]/2, Sin[u], Cos[u]^2/4 + Sin[u]^2}, {u, 0, 2 \[Pi]}]](https://www.wolframcloud.com/obj/resourcesystem/images/065/065bc4c7-66b4-41ab-9e00-32aca7703e7b/3b2db43045baefb2.png) |
| Out[1]= | 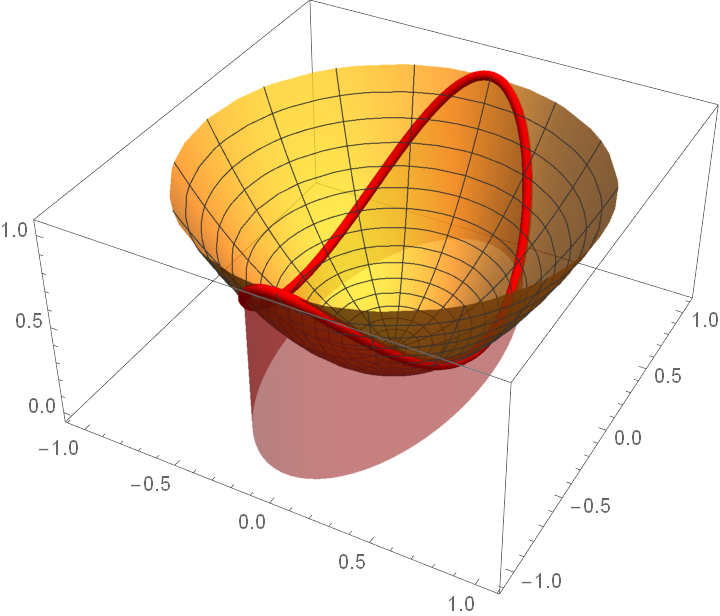 |
Plot a surface with all possible plane sections:
| In[2]:= | ![(* Evaluate this cell to get the example input *) CloudGet["https://www.wolframcloud.com/obj/40744648-2425-4b7b-b36d-9c14af1e9d85"]](https://www.wolframcloud.com/obj/resourcesystem/images/065/065bc4c7-66b4-41ab-9e00-32aca7703e7b/762d3d418531e56a.png) |
| Out[2]= | 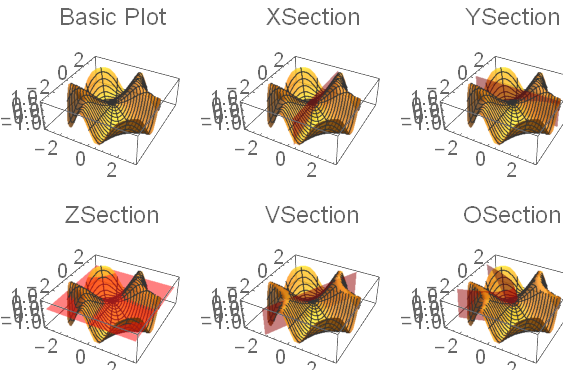 |
Plot a surface with both a plane section and a parametrically defined section:
| In[3]:= | ![ResourceFunction[
"SectionParametricPlot3D"][{r Cos[t], r Sin[t], Sin[r^2 Cos[t] Sin[t]]}, {t, 0, 2 \[Pi]}, {r, 0, 3}, {2 Cos[u], 3 Sin[u], Sin[6 Cos[u] Sin[u]]}, {u, 0, 2 \[Pi]}, "ZSection" -> 1/4]](https://www.wolframcloud.com/obj/resourcesystem/images/065/065bc4c7-66b4-41ab-9e00-32aca7703e7b/45ac0cc8edde3795.png) |
| Out[3]= | 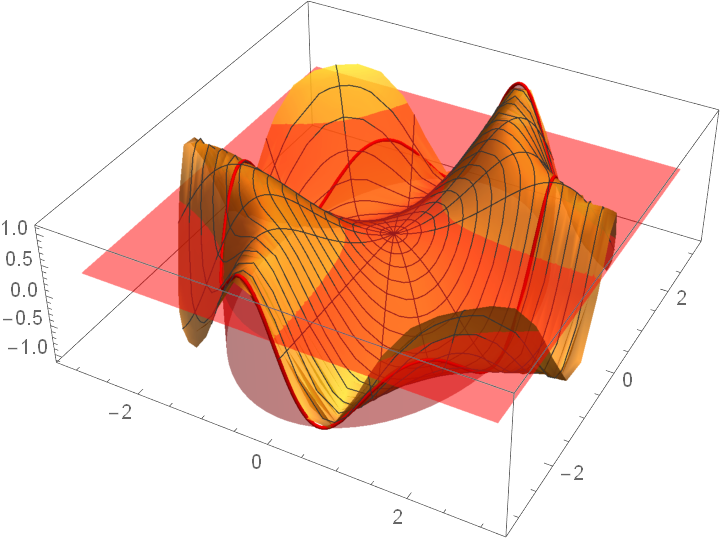 |
Plot two surfaces with their intersection illustrated with two sections:
| In[4]:= | ![ResourceFunction[
"SectionParametricPlot3D"][{{r Cos[t], r Sin[t], 1 - r^2}, {r Cos[t],
r Sin[t], r^2 Cos[2 t]}}, {r, 0, 1}, {t, 0, 2 \[Pi]}, "CylinderStyle" -> Opacity[.6], BoxRatios -> Automatic, "XSection" -> {-1/Sqrt[2], 1/Sqrt[2]}, PlotStyle -> {Opacity[.8], Opacity[1]}]](https://www.wolframcloud.com/obj/resourcesystem/images/065/065bc4c7-66b4-41ab-9e00-32aca7703e7b/5f546e6a375084fe.png) |
| Out[4]= | 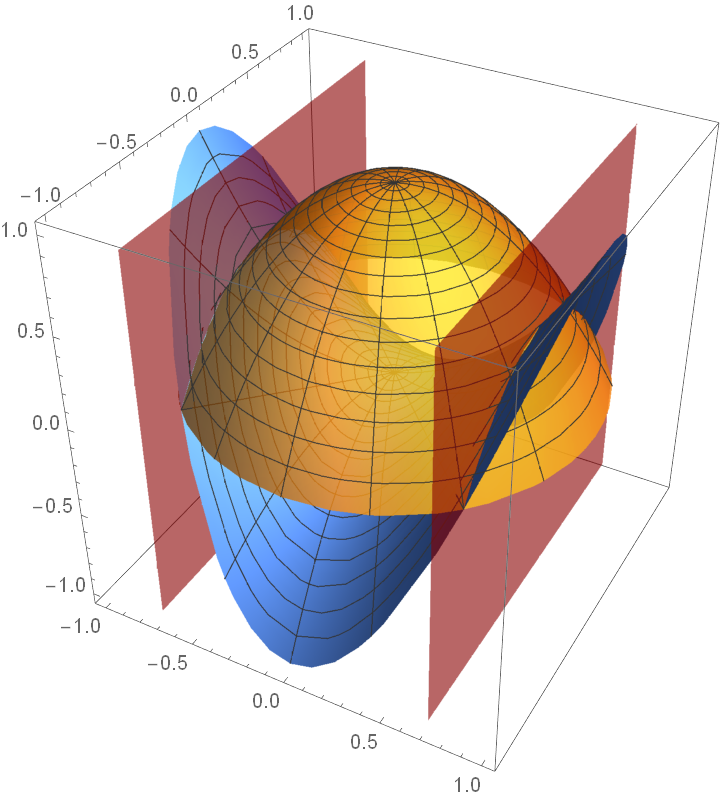 |
Define the x-sections by parametrically defined curves:
| In[5]:= | ![ResourceFunction[
"SectionParametricPlot3D"][{{r Cos[t], r Sin[t], 1 - r^2}, {r Cos[t],
r Sin[t], r^2 Cos[2 t]}}, {r, 0, 1}, {t, 0, 2 \[Pi]}, {{-1/Sqrt[2], -y, 1/2 - y^2}, {1/Sqrt[2], -y, 1/2 - y^2}}, {y, -1/Sqrt[2], 1/Sqrt[2]}, "CylinderStyle" -> Opacity[.7], BoxRatios -> Automatic, PlotStyle -> {Opacity[.8], Opacity[1]}]](https://www.wolframcloud.com/obj/resourcesystem/images/065/065bc4c7-66b4-41ab-9e00-32aca7703e7b/2eef132222adc77a.png) |
| Out[5]= | 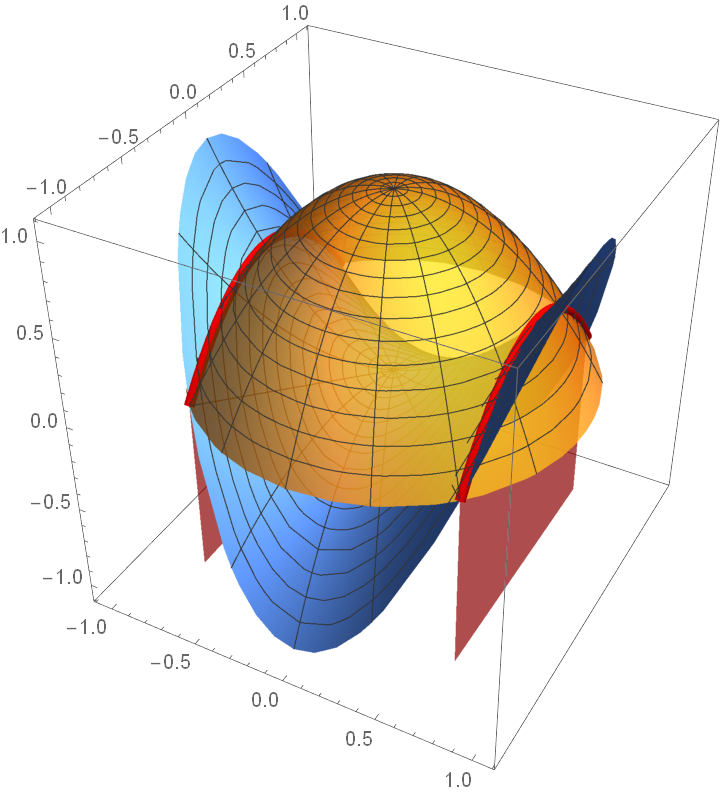 |
Illustrate the x-sections without including the cylinder used to define them:
| In[6]:= | ![ResourceFunction[
"SectionParametricPlot3D"][{{r Cos[t], r Sin[t], 1 - r^2}, {r Cos[t],
r Sin[t], r^2 Cos[2 t]}}, {r, 0, 1}, {t, 0, 2 \[Pi]}, {{-1/Sqrt[2], -y, 1/2 - y^2}, {1/Sqrt[2], -y, 1/2 - y^2}}, {y, -1/Sqrt[2], 1/Sqrt[2]}, "DrawCylinder" -> False, BoxRatios -> Automatic, PlotStyle -> {Opacity[.8], Opacity[1]}]](https://www.wolframcloud.com/obj/resourcesystem/images/065/065bc4c7-66b4-41ab-9e00-32aca7703e7b/20924b99668edfbf.png) |
| Out[6]= | 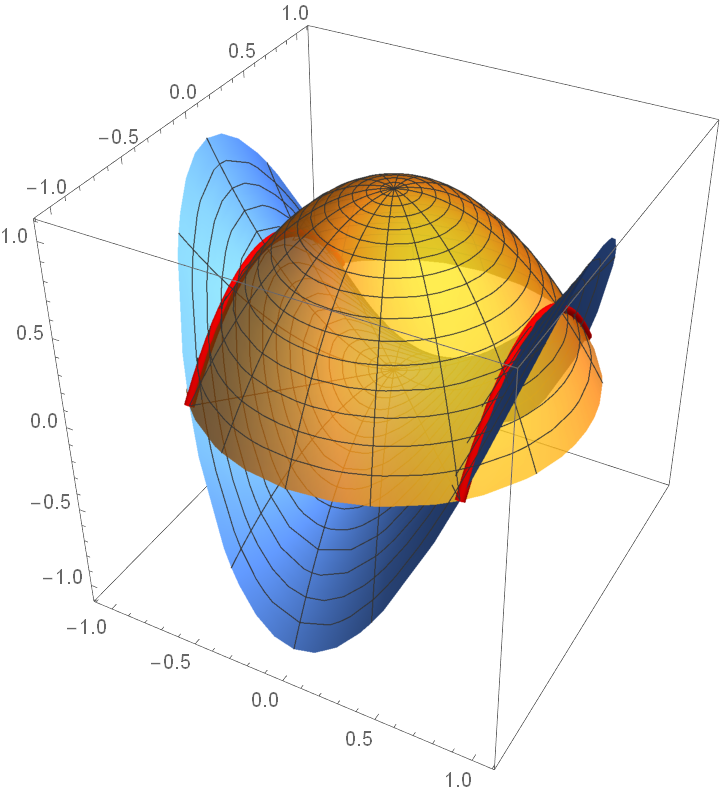 |
Set a color function for the sections:
| In[7]:= | ![ResourceFunction[
"SectionParametricPlot3D"][{r Cos[t], r Sin[t], r^2 Cos[2 t]}, {r, 0,
1}, {t, 0, 2 \[Pi]}, {{Cos[t], Sin[t], Cos[2 t]}, {1/2 Cos[t], 1/2 Sin[t], 1/4 Cos[2 t]}}, {t, 0, 2 \[Pi]}, "ColorFunctionSection" -> Function[{x, y, z, t}, GrayLevel[t]], BoxRatios -> Automatic]](https://www.wolframcloud.com/obj/resourcesystem/images/065/065bc4c7-66b4-41ab-9e00-32aca7703e7b/5ae59f4bd8af63f7.png) |
| Out[7]= | 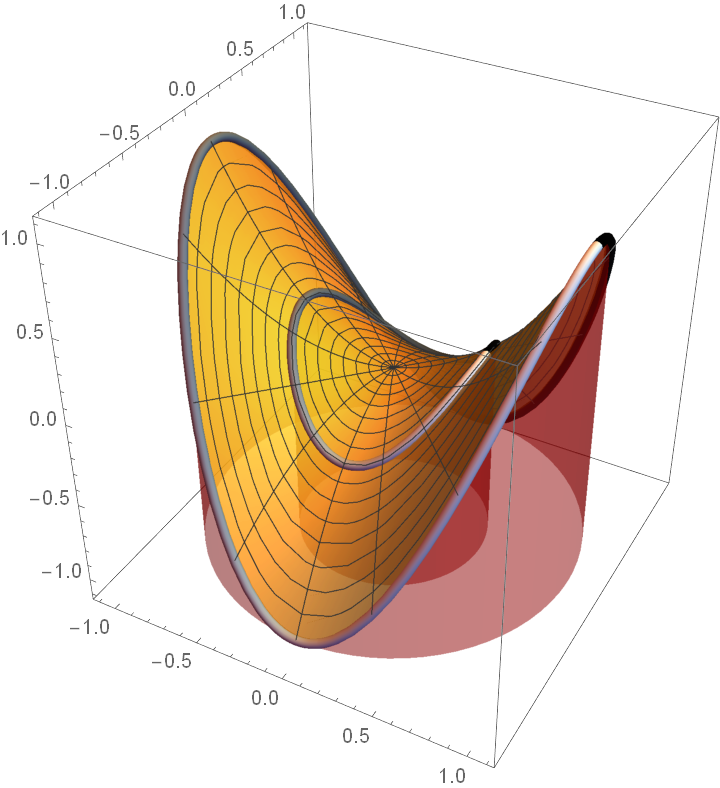 |
Set a different style for each section:
| In[8]:= | ![ResourceFunction[
"SectionParametricPlot3D"][{r Cos[t], r Sin[t], r^2 Cos[2 t]}, {r, 0,
1}, {t, 0, 2 \[Pi]}, {{Cos[t], Sin[t], Cos[2 t]}, {1/2 Cos[t], 1/2 Sin[t], 1/4 Cos[2 t]}}, {t, 0, 2 \[Pi]}, "ColorFunctionSection" -> {Function[{x, y, z, t}, Hue[t/2]], Function[{x, y, z, t}, Hue[t]]}, BoxRatios -> Automatic]](https://www.wolframcloud.com/obj/resourcesystem/images/065/065bc4c7-66b4-41ab-9e00-32aca7703e7b/0a4f3b962e8ed928.png) |
| Out[8]= |  |
Set a style for the surface:
| In[9]:= | ![ResourceFunction[
"SectionParametricPlot3D"][{r Cos[t], r Sin[t], r^2 Cos[2 t]}, {r, 0,
1}, {t, 0, 2 \[Pi]}, {{Cos[t], Sin[t], Cos[2 t]}, {1/2 Cos[t], 1/2 Sin[t], 1/4 Cos[2 t]}}, {t, 0, 2 \[Pi]}, "ColorFunctionSurface" -> Function[{x, y, z}, Hue[z]]]](https://www.wolframcloud.com/obj/resourcesystem/images/065/065bc4c7-66b4-41ab-9e00-32aca7703e7b/5958e38a6502f3cd.png) |
| Out[9]= | 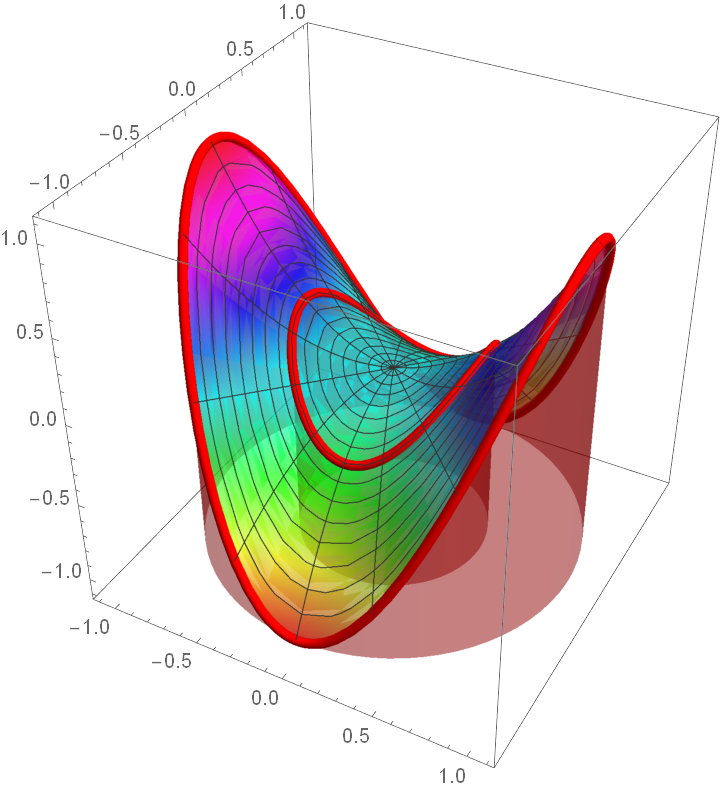 |
Set a color function for both the surface and the sections:
| In[10]:= | ![ResourceFunction[
"SectionParametricPlot3D"][{r Cos[t], r Sin[t], r^2 Cos[2 t]}, {r, 0,
1}, {t, 0, 2 \[Pi]}, {{Cos[t], Sin[t], Cos[2 t]}, {1/2 Cos[t], 1/2 Sin[t], 1/4 Cos[2 t]}}, {t, 0, 2 \[Pi]},
"ColorFunctionSurface" -> Function[{x, y, z}, Hue[z]], "ColorFunctionSection" -> Function[{x, y, z}, GrayLevel[z]]]](https://www.wolframcloud.com/obj/resourcesystem/images/065/065bc4c7-66b4-41ab-9e00-32aca7703e7b/6635e28d17662b6a.png) |
| Out[10]= | 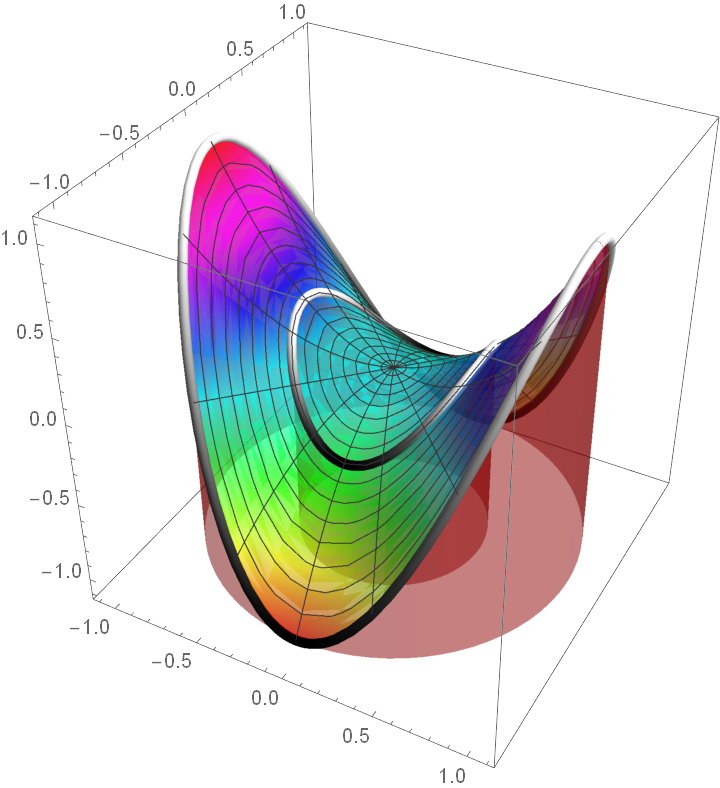 |
Set where to place the base of the cylinder:
| In[11]:= | ![ResourceFunction[
"SectionParametricPlot3D"][{r Cos[t], r Sin[t], Sin[r^2 Cos[t] Sin[t]]}, {t, 0, 2 \[Pi]}, {r, 0, 3}, {2 Cos[u], 3 Sin[u], Sin[6 Cos[u] Sin[u]]}, {u, 0, 2 \[Pi]}, "CylinderBase" -> -2, BoxRatios -> Automatic]](https://www.wolframcloud.com/obj/resourcesystem/images/065/065bc4c7-66b4-41ab-9e00-32aca7703e7b/22e1f38290342219.png) |
| Out[11]= | 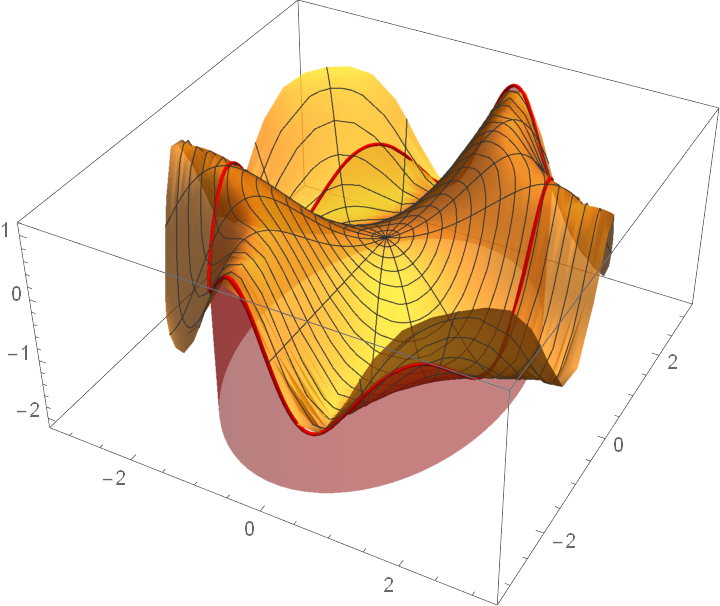 |
Set the cylinder to be drawn from the top of the bounding box down to the surface:
| In[12]:= | ![ResourceFunction[
"SectionParametricPlot3D"][{r Cos[t], r Sin[t], Sin[r^2 Cos[t] Sin[t]]}, {t, 0, 2 \[Pi]}, {r, 0, 3}, {2 Cos[u], 3 Sin[u], Sin[6 Cos[u] Sin[u]]}, {u, 0, 2 \[Pi]}, BoxRatios -> Automatic, "CylinderRange" -> Reverse]](https://www.wolframcloud.com/obj/resourcesystem/images/065/065bc4c7-66b4-41ab-9e00-32aca7703e7b/387f6ca4ba5d6ae8.png) |
| Out[12]= | 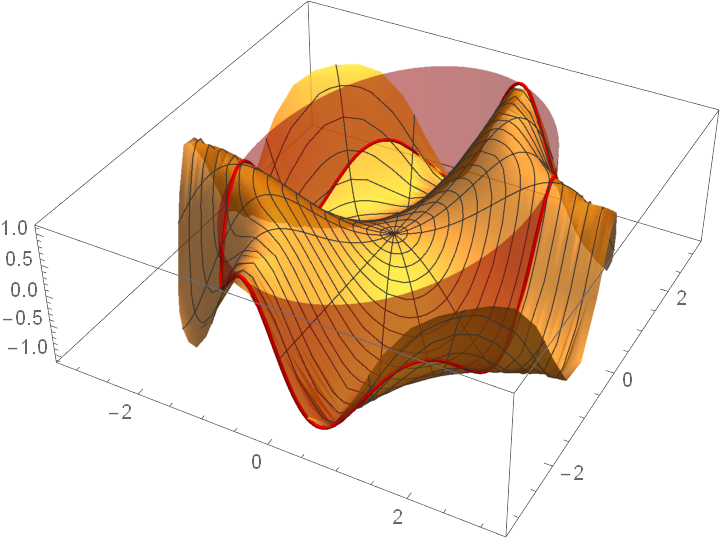 |
Draw the cylinder both above and below the surface:
| In[13]:= | ![ResourceFunction[
"SectionParametricPlot3D"][{r Cos[t], r Sin[t], Sin[r^2 Cos[t] Sin[t]]}, {t, 0, 2 \[Pi]}, {r, 0, 3}, {2 Cos[u], 3 Sin[u], Sin[6 Cos[u] Sin[u]]}, {u, 0, 2 \[Pi]}, BoxRatios -> Automatic, "CylinderRange" -> {-2, 2}]](https://www.wolframcloud.com/obj/resourcesystem/images/065/065bc4c7-66b4-41ab-9e00-32aca7703e7b/7a672ee699d89a98.png) |
| Out[13]= | 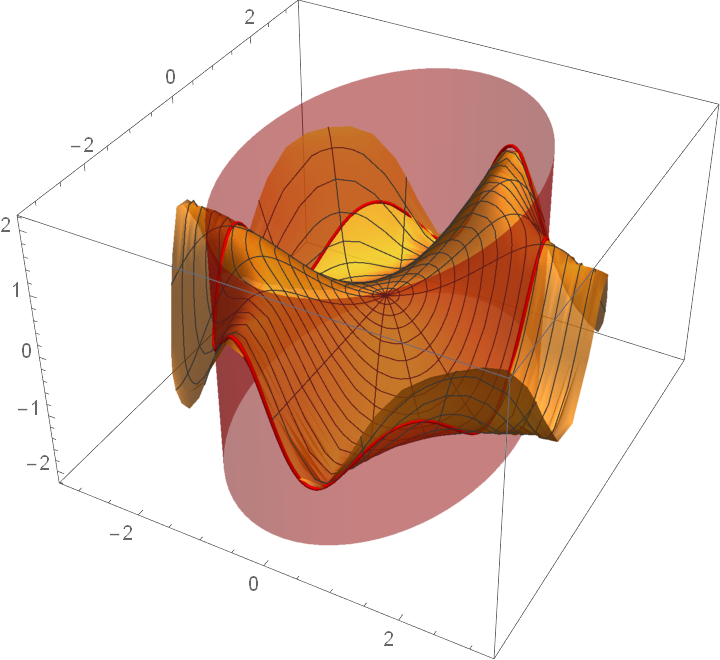 |
Draw the cylinder to full height:
| In[14]:= | ![ResourceFunction[
"SectionParametricPlot3D"][{r Cos[t], r Sin[t], Sin[r^2 Cos[t] Sin[t]]}, {t, 0, 2 \[Pi]}, {r, 0, 3}, {2 Cos[u], 3 Sin[u], Sin[6 Cos[u] Sin[u]]}, {u, 0, 2 \[Pi]}, "CylinderBase" -> -2, BoxRatios -> Automatic, "CylinderRange" -> All]](https://www.wolframcloud.com/obj/resourcesystem/images/065/065bc4c7-66b4-41ab-9e00-32aca7703e7b/3346b1e586f684f5.png) |
| Out[14]= | 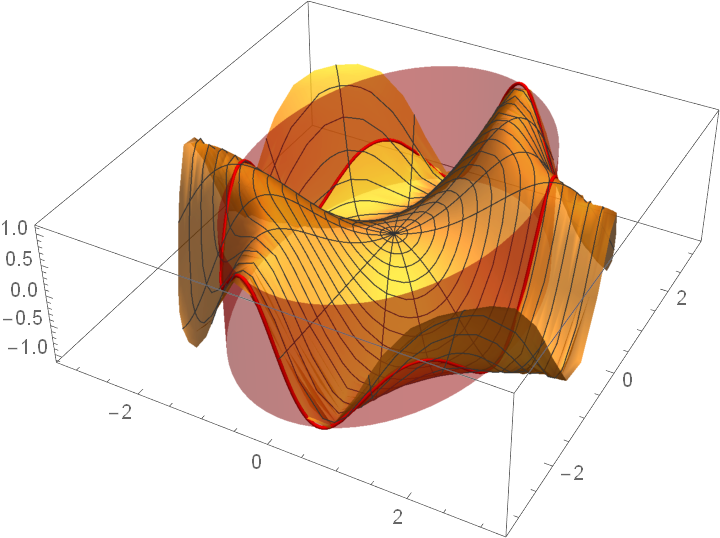 |
Draw a cylinder from a base of −2 to the surface (this is the same as setting CylinderBase→−2):
| In[15]:= | ![ResourceFunction[
"SectionParametricPlot3D"][{r Cos[t], r Sin[t], Sin[r^2 Cos[t] Sin[t]]}, {t, 0, 2 \[Pi]}, {r, 0, 3}, {2 Cos[u], 3 Sin[u], Sin[6 Cos[u] Sin[u]]}, {u, 0, 2 \[Pi]}, BoxRatios -> Automatic, "CylinderRange" -> {-2, Automatic}]](https://www.wolframcloud.com/obj/resourcesystem/images/065/065bc4c7-66b4-41ab-9e00-32aca7703e7b/0e823e64f260de87.png) |
| Out[15]= |  |
CylinderRange takes precedence over CylinderBase:
| In[16]:= |
| Out[16]= | 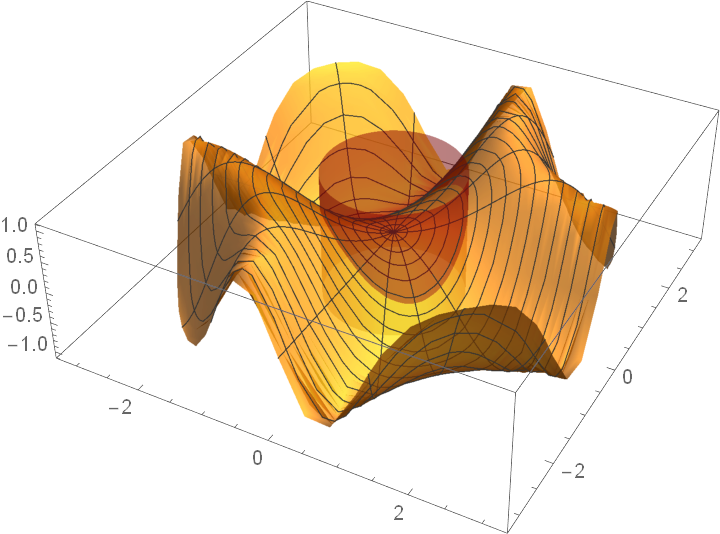 |
| In[17]:= | ![ResourceFunction[
"SectionParametricPlot3D"][{r Cos[t], r Sin[t], Sin[r^2 Cos[t] Sin[t]]}, {t, 0, 2 \[Pi]}, {r, 0, 3}, {2 Cos[u], 3 Sin[u], Sin[6 Cos[u] Sin[u]]}, {u, 0, 2 \[Pi]}, "CylinderRange" -> All, "CylinderBase" -> -2, BoxRatios -> Automatic]](https://www.wolframcloud.com/obj/resourcesystem/images/065/065bc4c7-66b4-41ab-9e00-32aca7703e7b/3b2d70763b9a7a4e.png) |
| Out[17]= |  |
Apply a style to the cylinder:
| In[18]:= |
| Out[18]= | 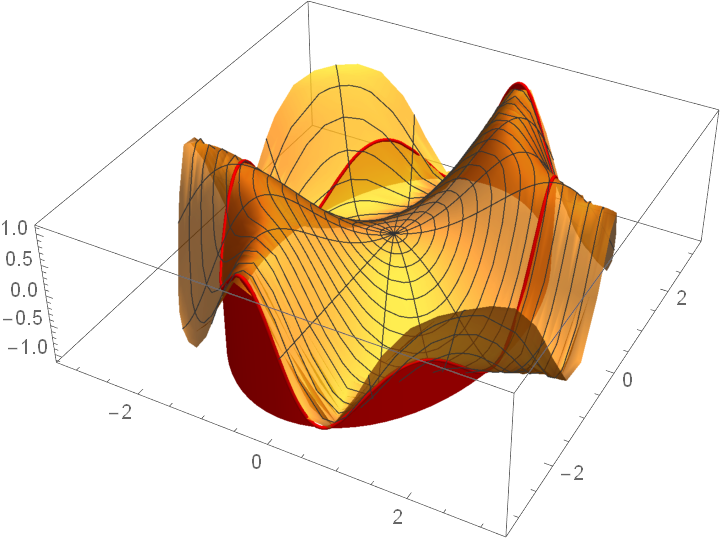 |
Suppress the plot of the cylinder:
| In[19]:= |
| Out[19]= | 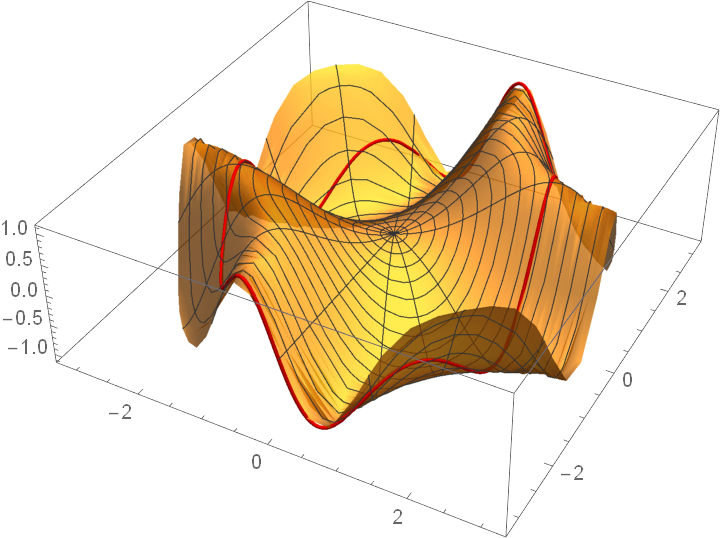 |
When "DrawPoint" contains one or more 2-tuples, then the point determined by these 2-tuples is found by substituting these parameter values into the definition of the function:
| In[20]:= | ![{r Cos[t], r Sin[t], Sin[r^2 Cos[t] Sin[t]]} /. ResourceFunction[
"PointsToRules"][{{0, 1}, {\[Pi]/2, 1}, {\[Pi], 1}, {3 \[Pi]/2, 1}}, {t, r}]](https://www.wolframcloud.com/obj/resourcesystem/images/065/065bc4c7-66b4-41ab-9e00-32aca7703e7b/1c7ab0102e576515.png) |
| Out[20]= |
Points given by 3-tuples have their usual meaning as (x,y,z)-coordinates:
| In[21]:= | ![ResourceFunction[
"SectionParametricPlot3D"][{r Cos[t], r Sin[t], Sin[r^2 Cos[t] Sin[t]]}, {t, 0, 2 \[Pi]}, {r, 0, 3}, {2 Cos[u], 3 Sin[u], Sin[6 Cos[u] Sin[u]]}, {u, 0, 2 \[Pi]}, "DrawPoint" -> {{0, 1}, {\[Pi]/2, 1}, {\[Pi], 1}, {3 \[Pi]/2, 1}, {1,
1, 3}}, "DrawPointStyle" -> {{PointSize[.05], Red}, {PointSize[.05], Orange}, {PointSize[.06], Green}, {PointSize[.06], Blue}, {PointSize[.08], Magenta}}]](https://www.wolframcloud.com/obj/resourcesystem/images/065/065bc4c7-66b4-41ab-9e00-32aca7703e7b/5098ae84bc593872.png) |
| Out[21]= | 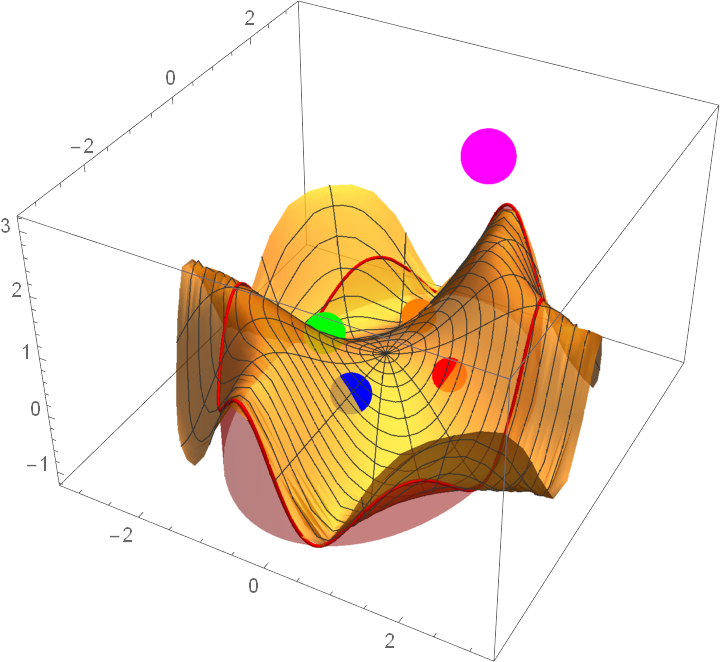 |
Cutting the cone with a plane not passing through the vertex of the cone and not parallel to an axis of the cone will give an ellipse. Note that the variables used to specify the plane must be given in a list:
| In[22]:= | ![ResourceFunction[
"SectionParametricPlot3D"][{r Cos[t], r Sin[t], r}, {t, 0, 2 \[Pi]}, {r, 0, 3}, "OSection" -> {(3 y)/4 + .5}, "SectionVariables" -> {x, y}, "DrawPoint" -> {1, 0}]](https://www.wolframcloud.com/obj/resourcesystem/images/065/065bc4c7-66b4-41ab-9e00-32aca7703e7b/730df719c5e6e0c1.png) |
| Out[22]= | 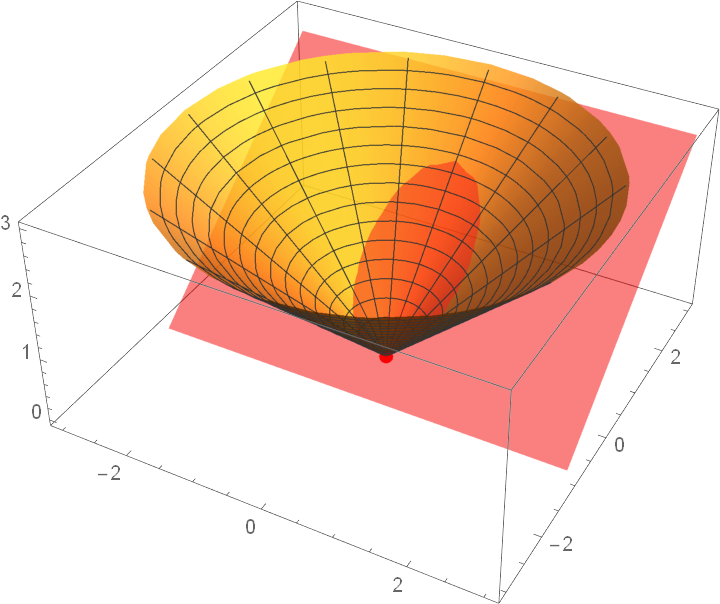 |
When the plane is parallel to the side of the cone, a parabola is generated:
| In[23]:= |
| Out[23]= | 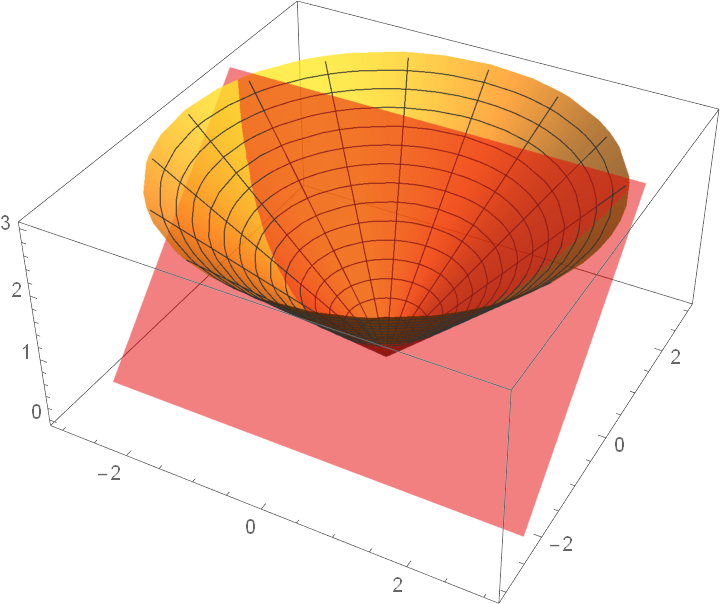 |
Add styles:
| In[24]:= |
| Out[24]= | 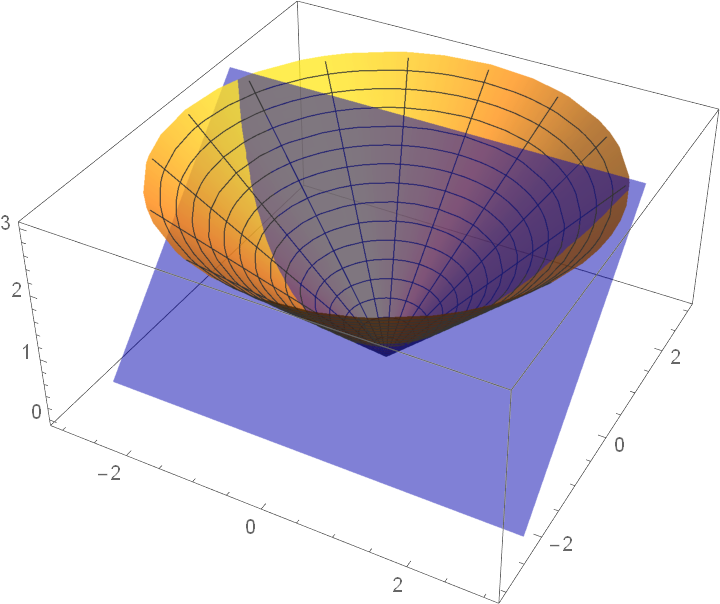 |
Change the number of points used to plot the section(s). Since the Wolfram Language’s plotting commands use adaptive procedures to determine how many points to actually plot, this feature must be turned off by setting the option MaxRecursion:
| In[25]:= | ![ResourceFunction[
"SectionParametricPlot3D"][{r Cos[t], r Sin[t], r^2 Cos[2 t]}, {r, 0,
1}, {t, 0, 2 \[Pi]}, {1/(1 + t^2) Cos[5 t], 1/(1 + t^2) Sin[5 t]}, {t, 0, 2 \[Pi]}, Mesh -> None, "PlotPointsSection" -> 25, MaxRecursion -> 0]](https://www.wolframcloud.com/obj/resourcesystem/images/065/065bc4c7-66b4-41ab-9e00-32aca7703e7b/4ba2dbbb8d0745c7.png) |
| Out[25]= | 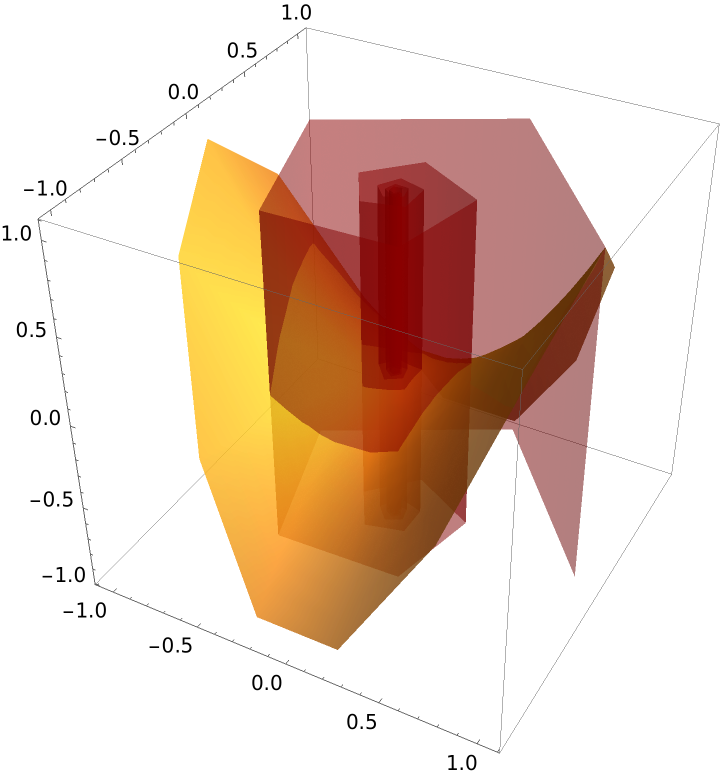 |
Apply a style to the surface:
| In[26]:= |
| Out[26]= | 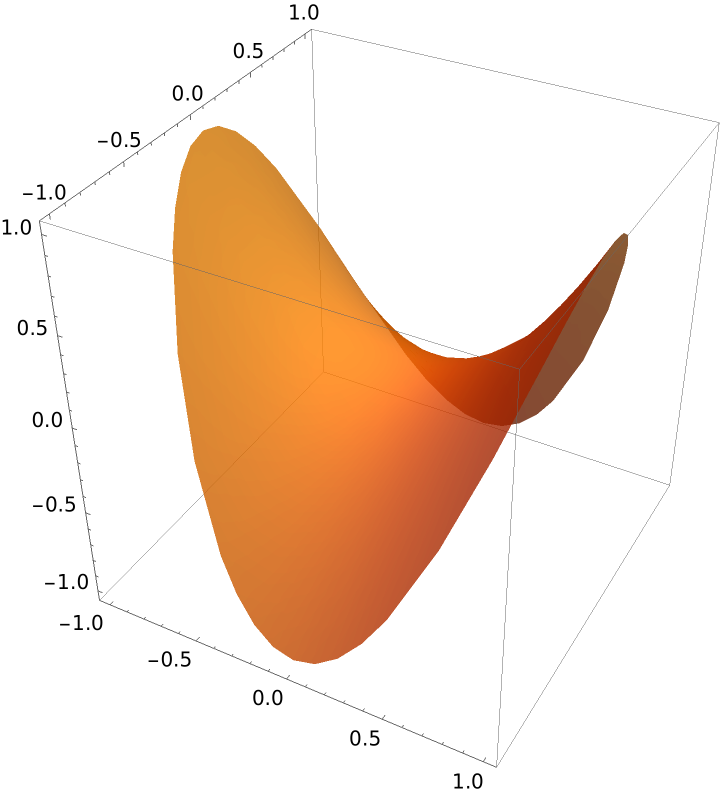 |
Apply styles to the section:
| In[27]:= |
| Out[27]= | 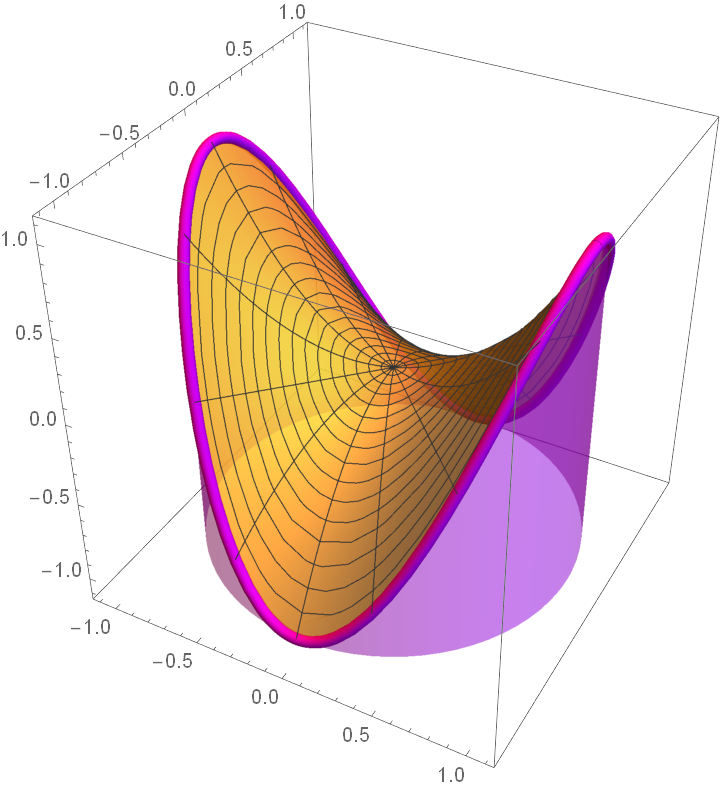 |
Suppress the plot of the surface:
| In[28]:= | ![GraphicsRow[{ResourceFunction[
"SectionParametricPlot3D"][{r Cos[t], r Sin[t], Sin[r^2 Cos[t] Sin[t]]}, {t, 0, 2 \[Pi]}, {r, 0, 3}, {2 Cos[t], Sin[t], Sin[2 Cos[t] Sin[t]]}, {t, 0, 2 \[Pi]}, "CylinderStyle" -> Opacity[1]], ResourceFunction[
"SectionParametricPlot3D"][{r Cos[t], r Sin[t], Sin[r^2 Cos[t] Sin[t]]}, {t, 0, 2 \[Pi]}, {r, 0, 3}, {2 Cos[t], Sin[t], Sin[2 Cos[t] Sin[t]]}, {t, 0, 2 \[Pi]}, "CylinderStyle" -> Opacity[1], "Surface" -> False]}, ImageSize -> Full]](https://www.wolframcloud.com/obj/resourcesystem/images/065/065bc4c7-66b4-41ab-9e00-32aca7703e7b/44ad33df97dd3c7d.png) |
| Out[28]= | 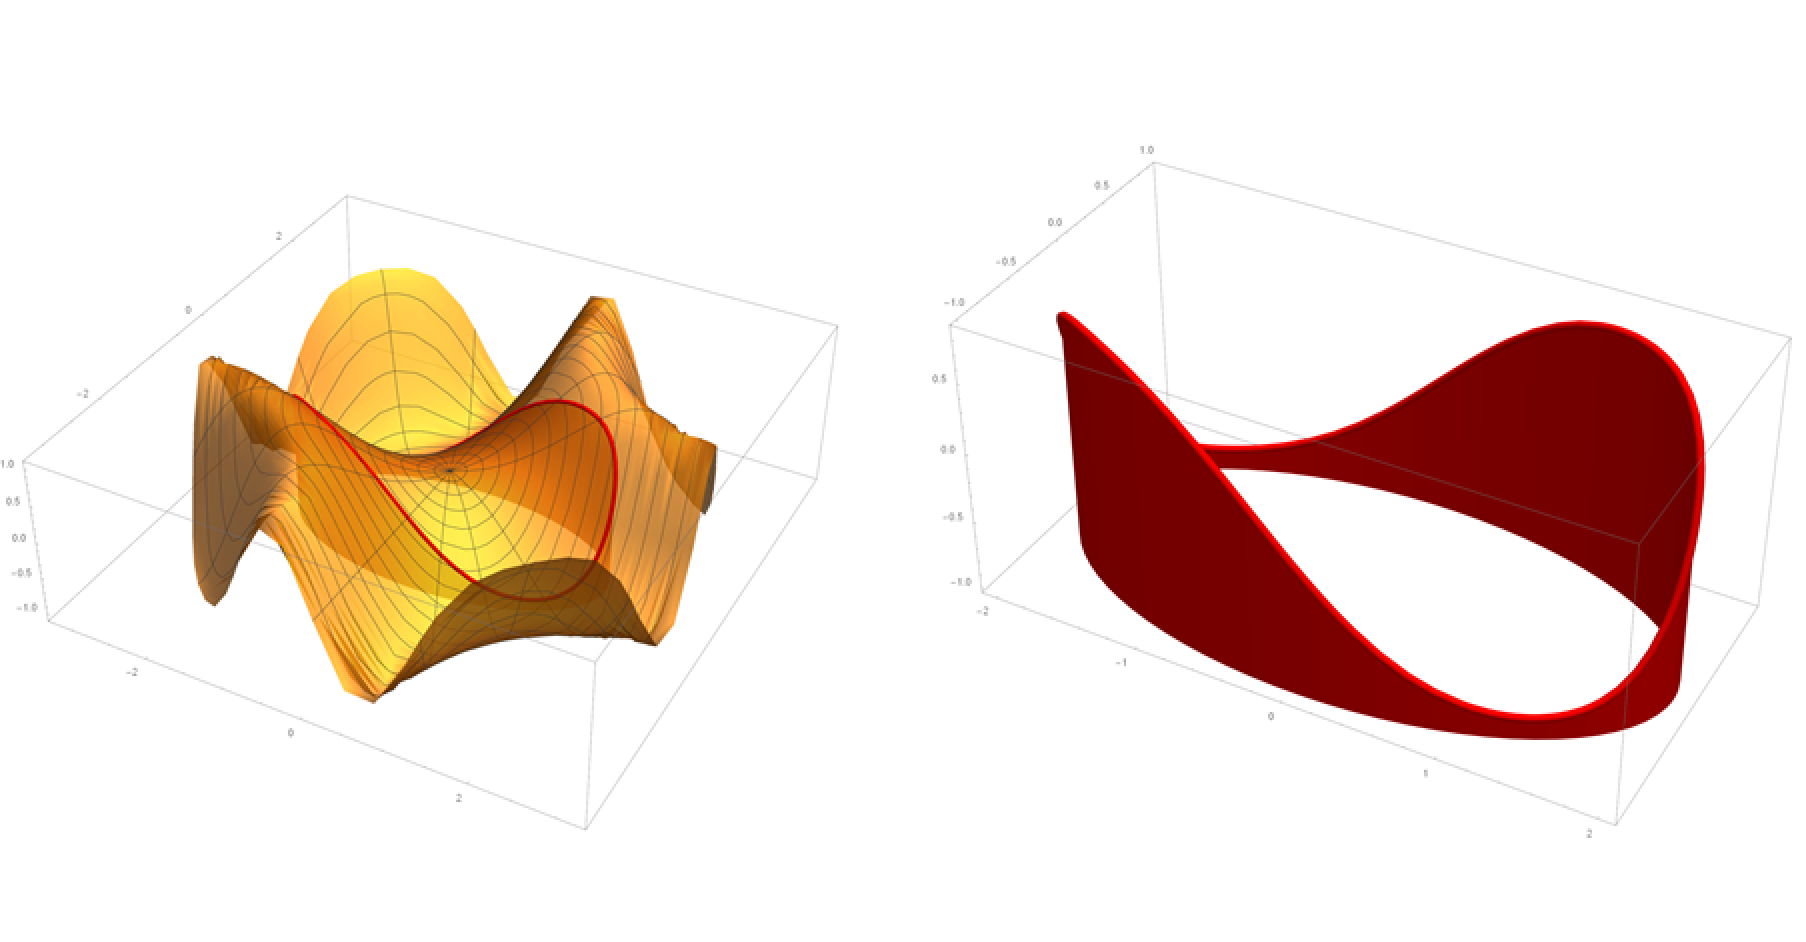 |
Add vertical sections (remember that sections’ variables must be specified):
| In[29]:= |
| Out[29]= | 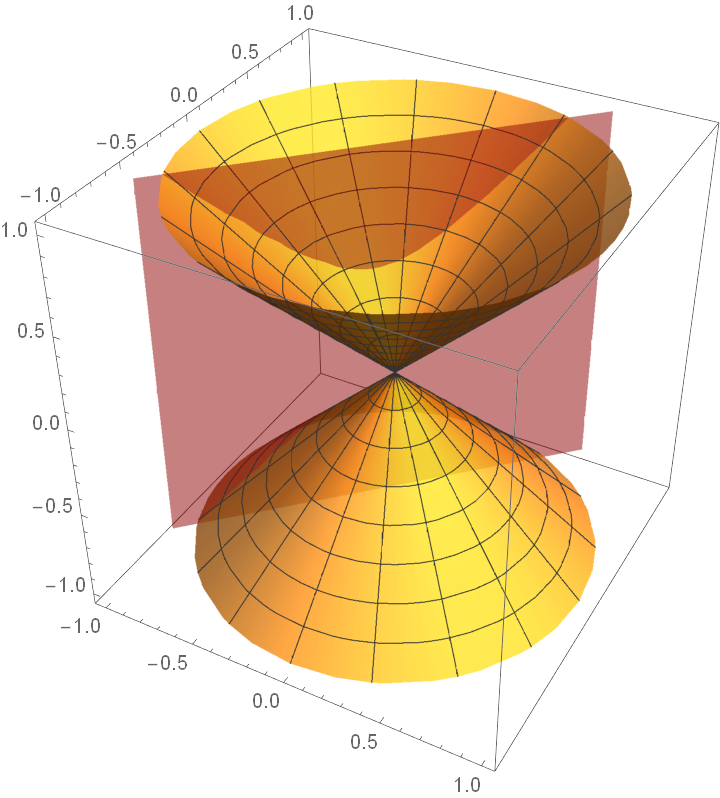 |
VSections can be any function of x or y:
| In[30]:= |
| Out[30]= | 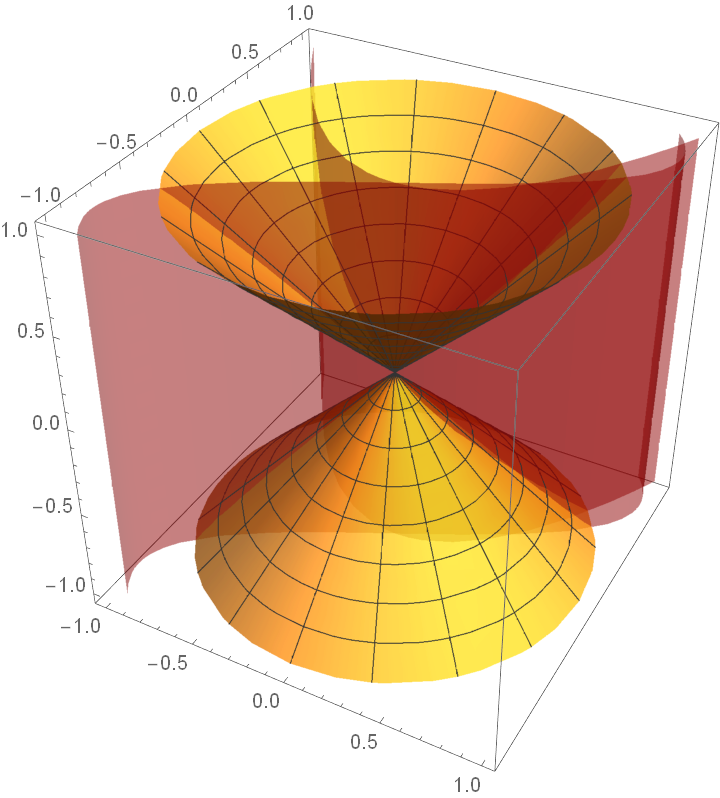 |
Set style for the sections:
| In[31]:= | ![ResourceFunction[
"SectionParametricPlot3D"][{r Cos[t], r Sin[t], r}, {t, 0, 2 \[Pi]}, {r, -1, 1}, "VSection" -> {x == Sin[2 y], y == x^2}, "SectionVariables" -> {x, y}, "CylinderStyle" -> Opacity[.5], "VSectionStyle" -> {Red, Blue}]](https://www.wolframcloud.com/obj/resourcesystem/images/065/065bc4c7-66b4-41ab-9e00-32aca7703e7b/2aa7682026dfe70b.png) |
| Out[31]= | 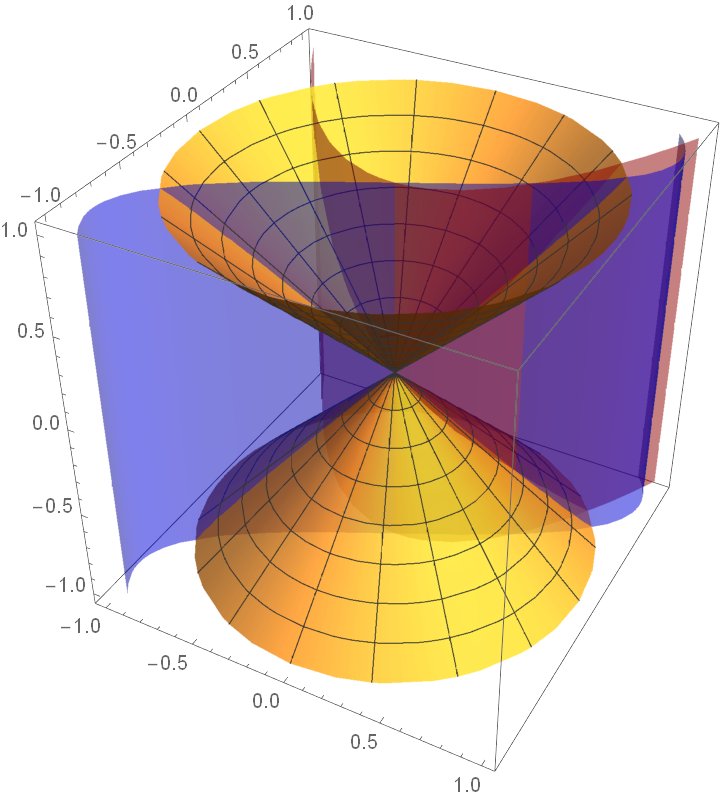 |
The intersection of planes of the form x=a with a cone generate either hyperbolas or lines:
| In[32]:= |
| Out[32]= | 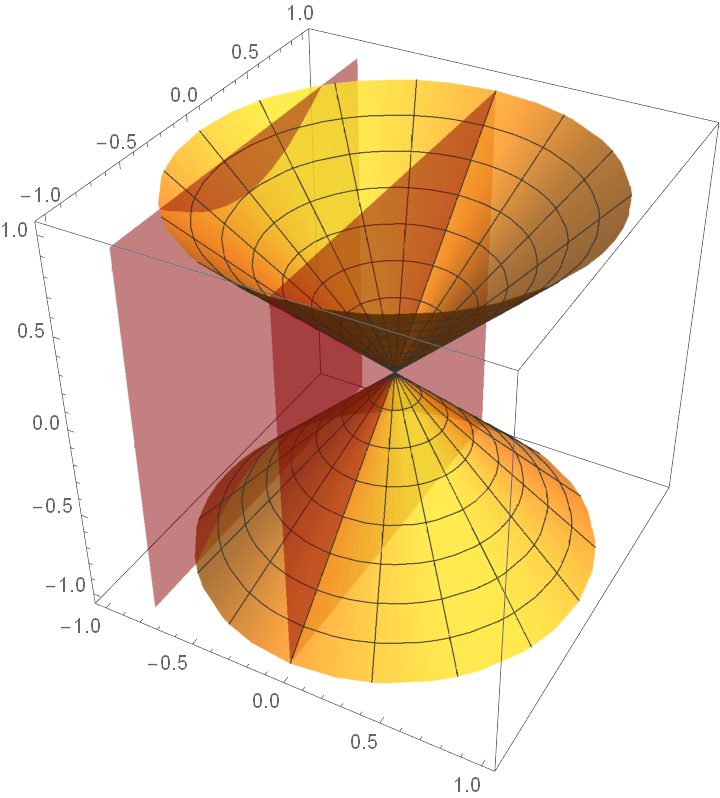 |
Assign a style to the XSection:
| In[33]:= | ![ResourceFunction[
"SectionParametricPlot3D"][{r Cos[t], r Sin[t], r}, {t, 0, 2 \[Pi]}, {r, -1, 1}, "XSection" -> {-(3/4), 0}, "XSectionStyle" -> {Blue, Purple}]](https://www.wolframcloud.com/obj/resourcesystem/images/065/065bc4c7-66b4-41ab-9e00-32aca7703e7b/1bacc52b92f565fe.png) |
| Out[33]= | 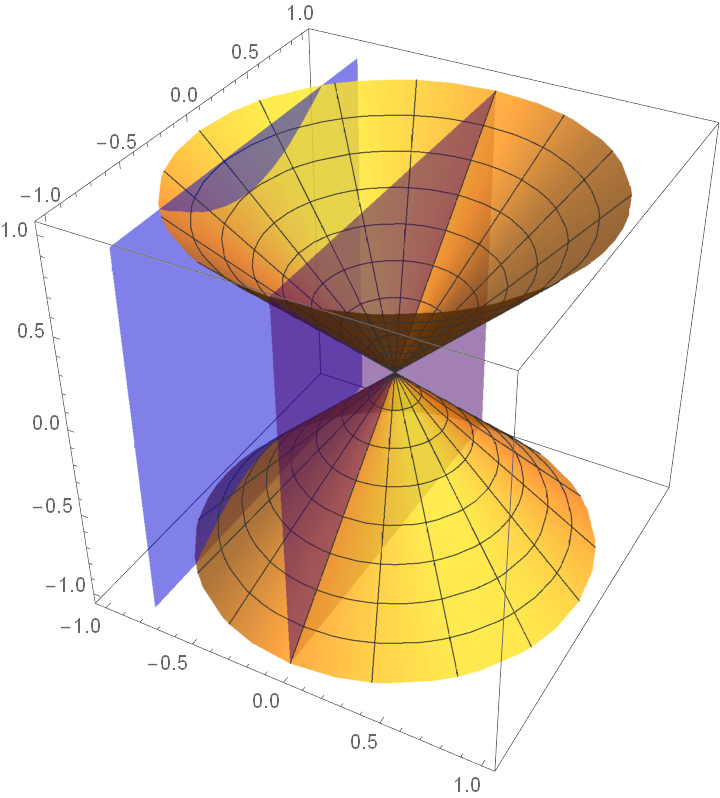 |
Add a YSection:
| In[34]:= |
| Out[34]= | 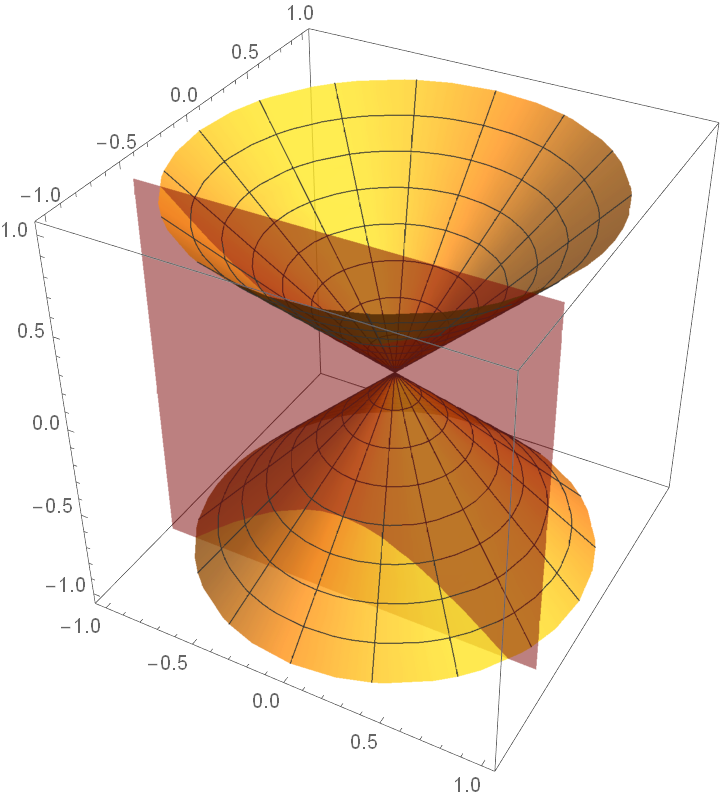 |
Set a style for the YSection:
| In[35]:= | ![ResourceFunction[
"SectionParametricPlot3D"][{r Cos[t], r Sin[t], r}, {t, 0, 2 \[Pi]}, {r, -1, 1}, "YSection" -> -(1/2), "YSectionStyle" -> Pink]](https://www.wolframcloud.com/obj/resourcesystem/images/065/065bc4c7-66b4-41ab-9e00-32aca7703e7b/21d43edd96923fc5.png) |
| Out[35]= | 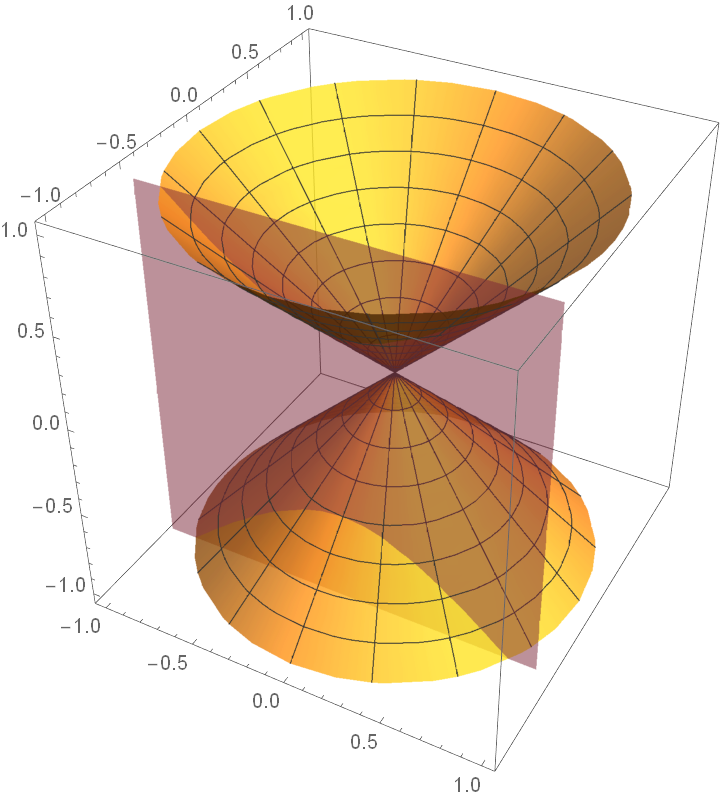 |
Add ZSections:
| In[36]:= |
| Out[36]= | 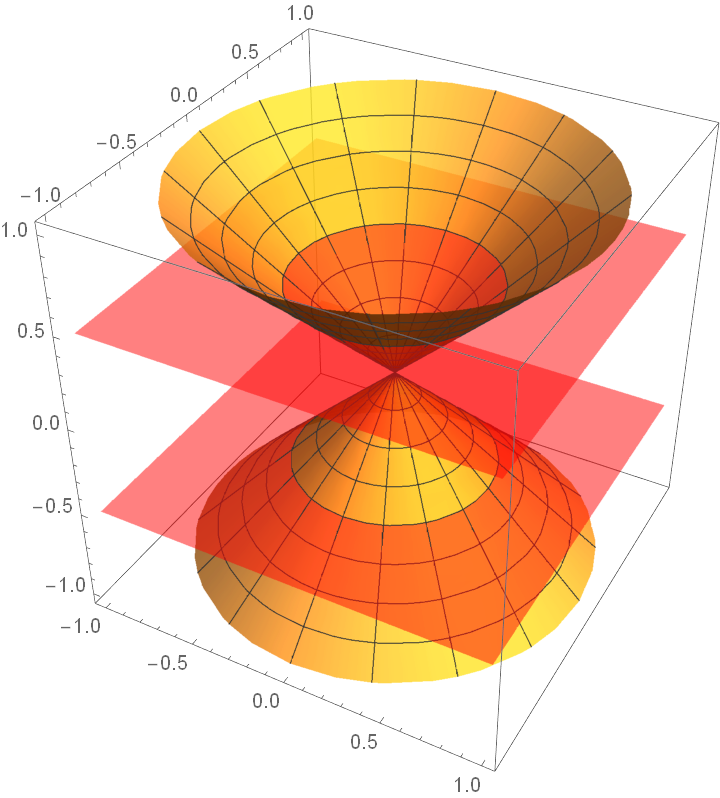 |
Set a style for the ZSections:
| In[37]:= |
| Out[37]= | 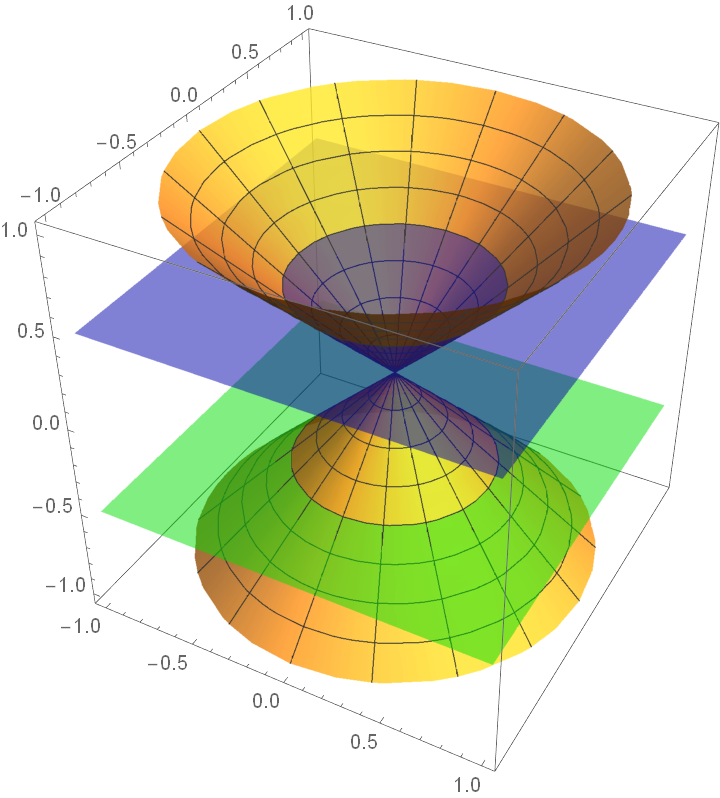 |
This work is licensed under a Creative Commons Attribution 4.0 International License