Random Graph Generators (4)
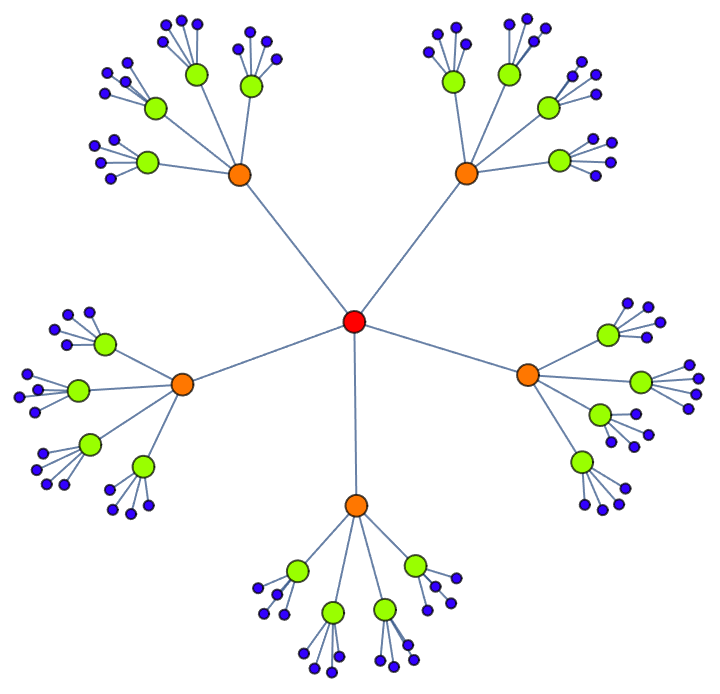
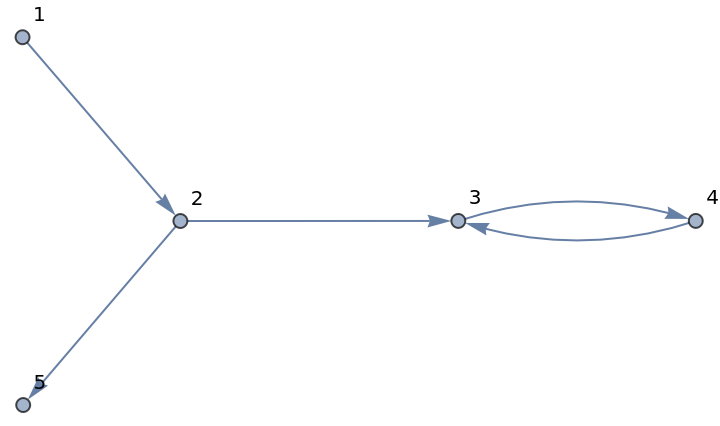
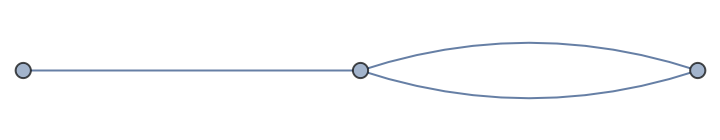
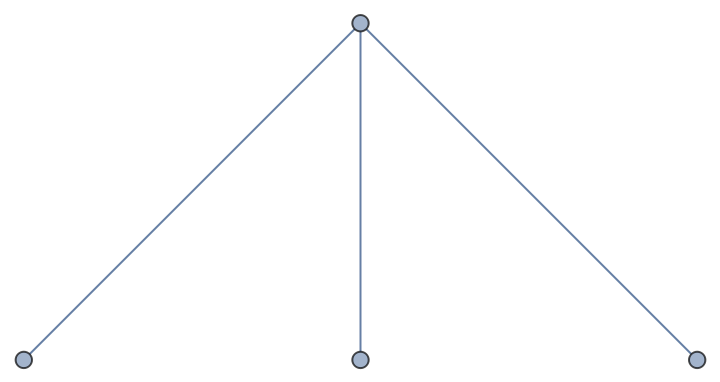
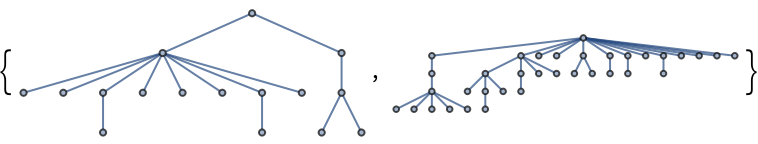
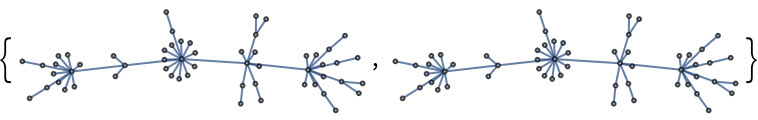
Construct a pseudorandom lobster graph:
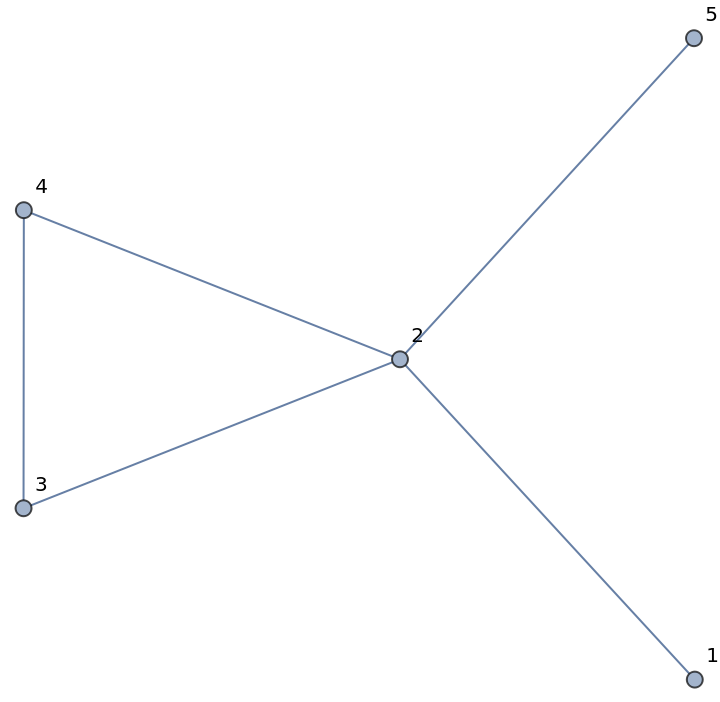
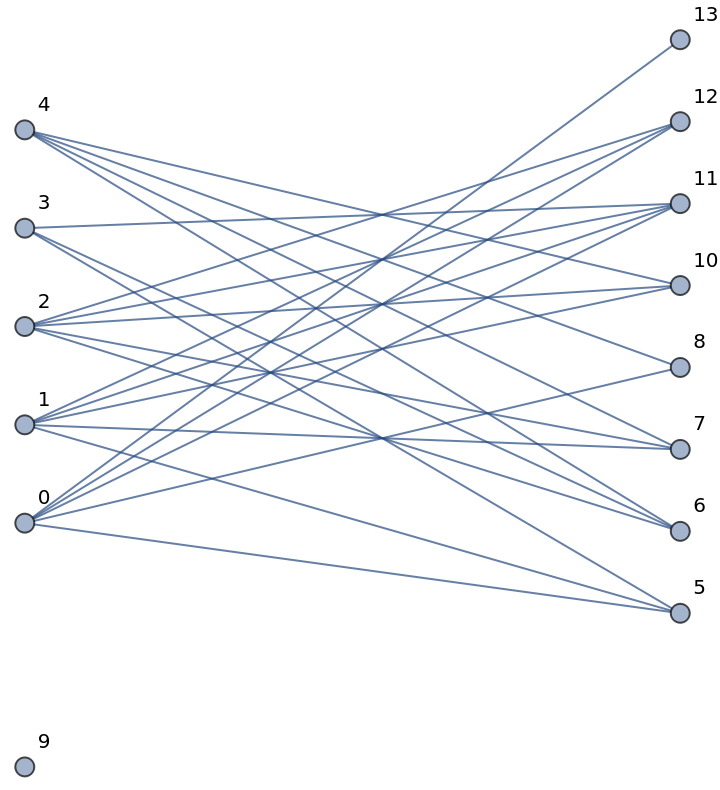
Create a pseudorandom bipartite graph from two given degree sequences:
Generate a random binomial bipartite graph (a bipartite Erdős-Rényi graph):
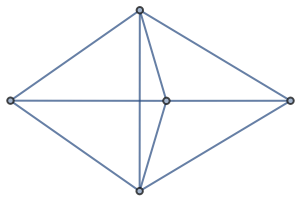
Generate a random graph using the built-in Wolfram Language function:
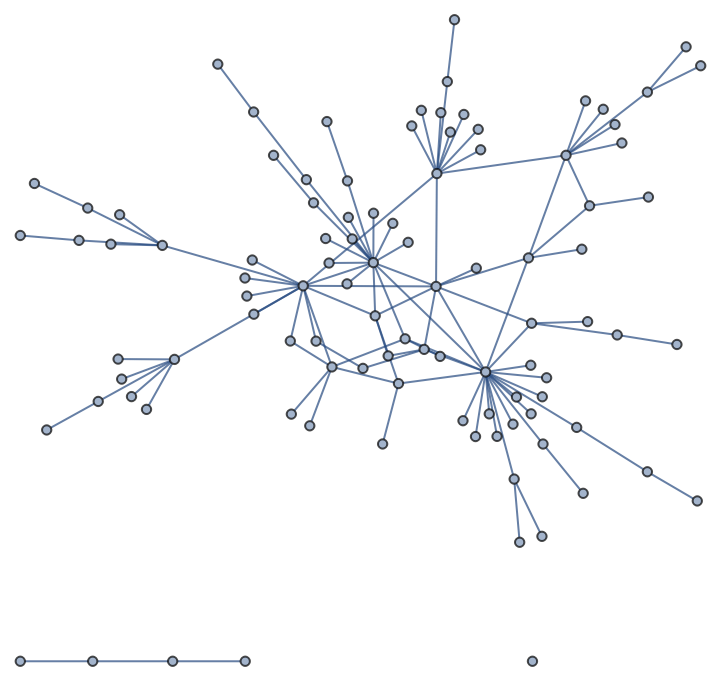
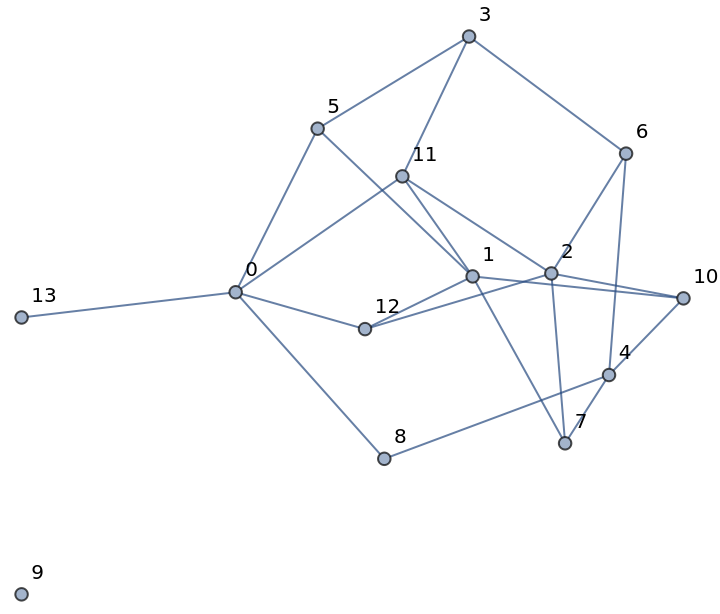
Construct an artificial Lancichinetti–Fortunato–Radicchi benchmark network resembling real-world networks:
Algorithms (5)
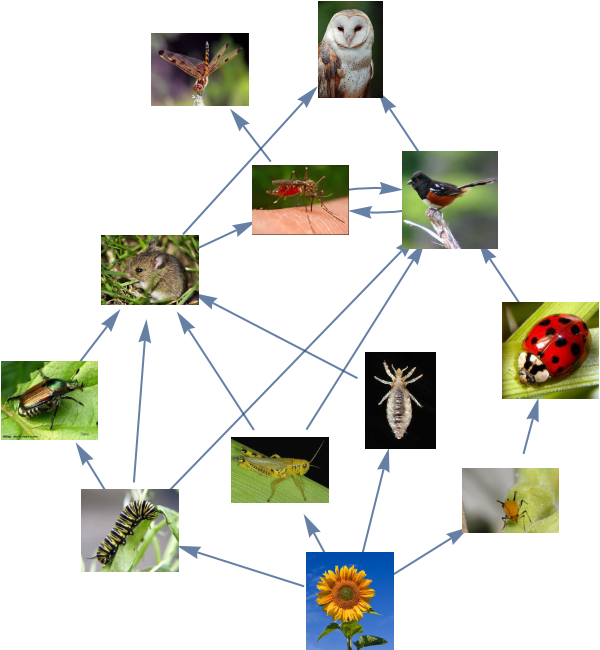
Find trophic levels of a food web:
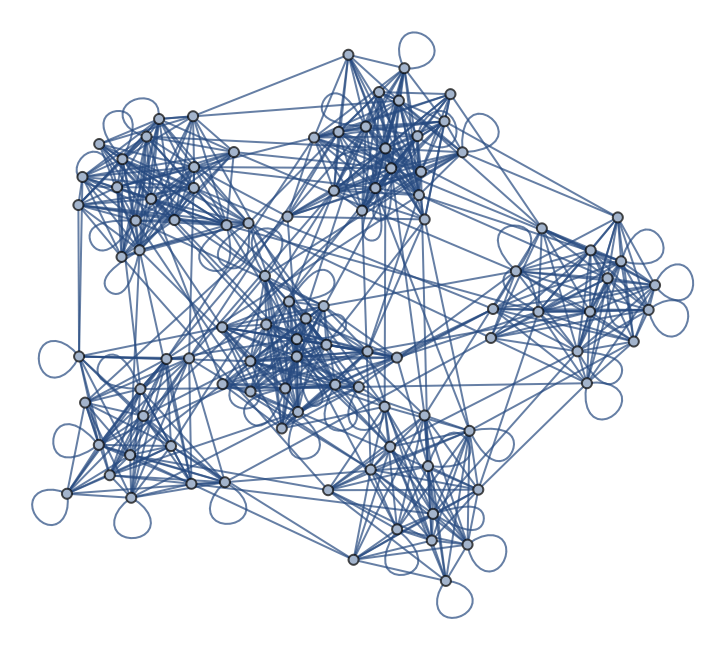
Analyze the Human Disease Network using the current-flow betweenness centrality and find vertices that lay on many paths, not necessarily on many shortest paths:
Select the first connected graph in indicating the common genetic origin of diseases in the Human Disease Network:
Compute the current-flow betweenness centrality:
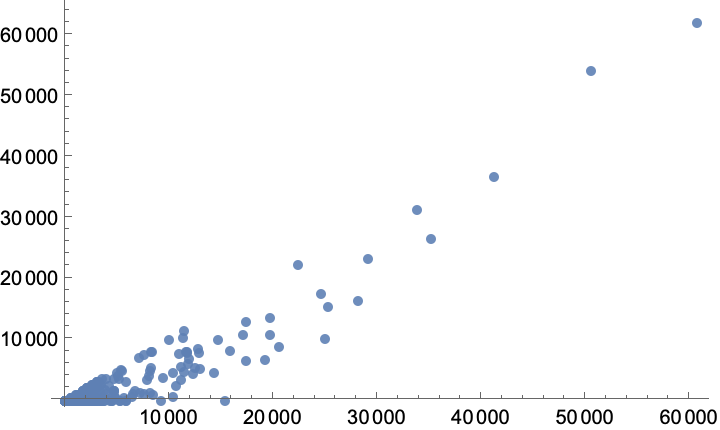
For comparison, compute the shortest-path betweenness centrality:
The two measures are very highly (but not perfectly) correlated:
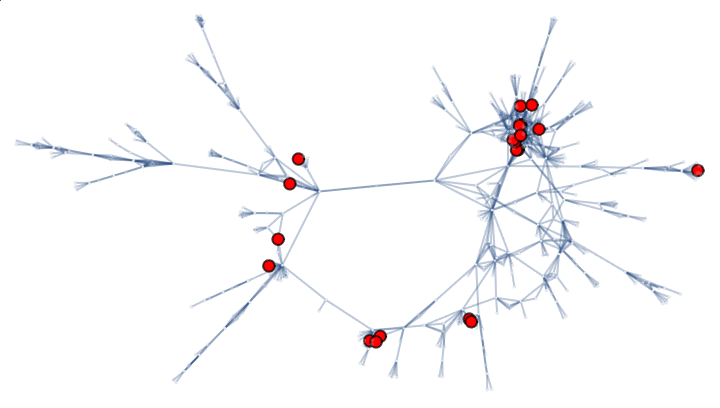
Pick vertices for which the current-flow betweenness centrality is more than 10 times higher than the shortest-path betweenness centrality. These would be missed by the shortest-path-based methods as mutations do not necessarily follow the shortest paths:
Highlight the missed vertices:
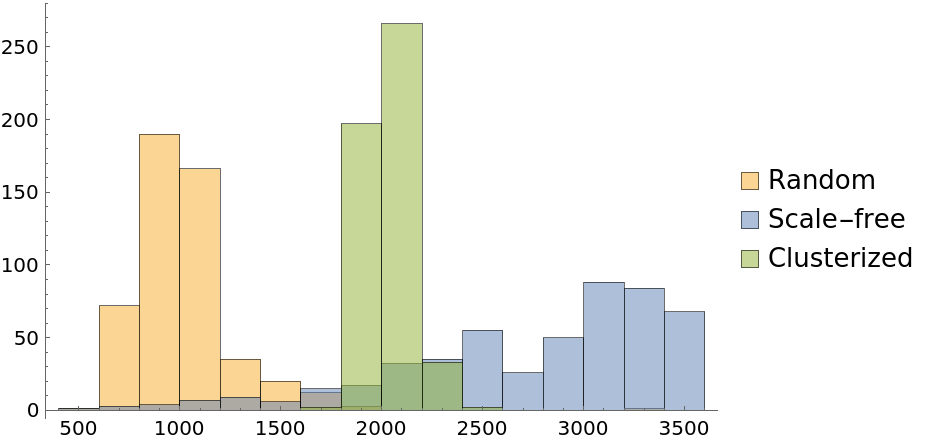
Analyze the global characteristics of a random, scale-free and clusterized graphs, using the second order centrality that provides graph signatures:
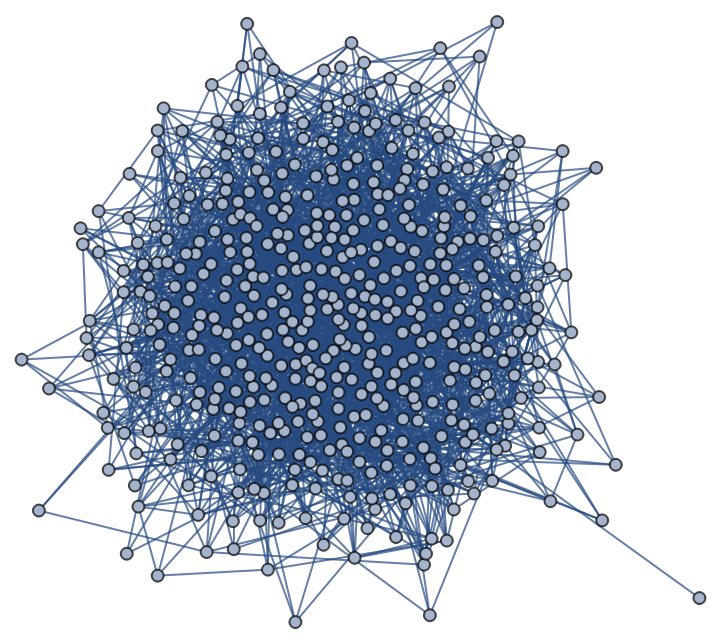
Create e a random graph:
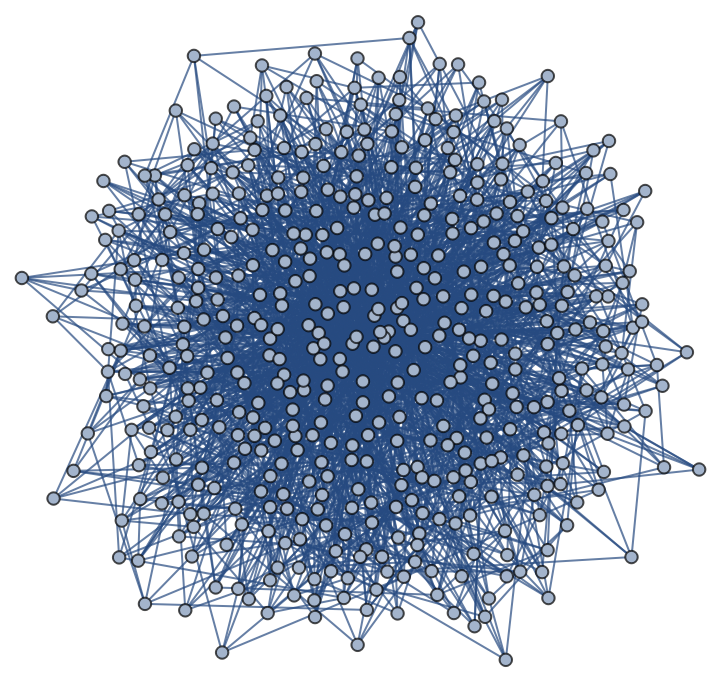
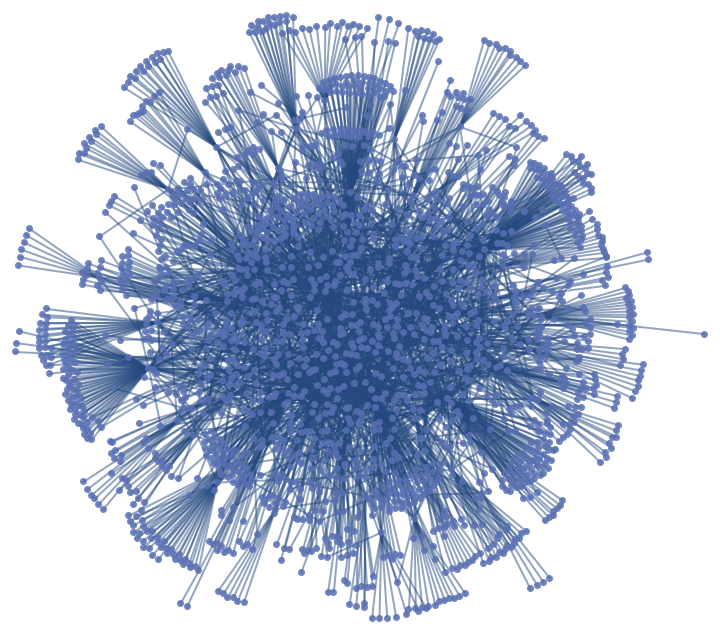
A scale-free graph:
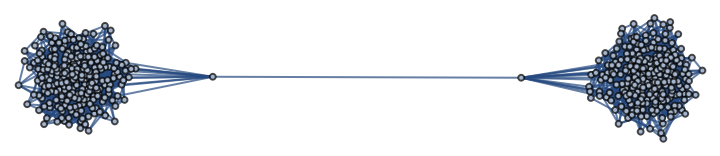
And a clusterized, barbell-type graph constructed from two random graphs joined by an edge:
Compute second order centralities:
The random graph exhibits the lowest values of second order centrality, consistent with the expected low diameter and low clustering coefficient of random graphs. Then follows the scale-free graph showing higher centrality values due to hubs being part of many shortest paths, while most of other vertices having a far inferior global importance. Finally, the clusterized graph shows a distribution with values about three times larger than ones of a single random graph due to the obvious difficulty of the random walk progression in the structure:
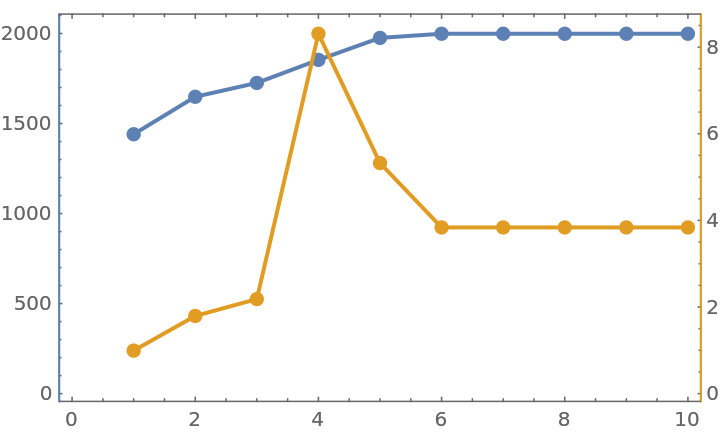
Demonstrate a percolation transition in the average distance between nodes in the largest cluster of the internet at the Autonomous System (AS) level:
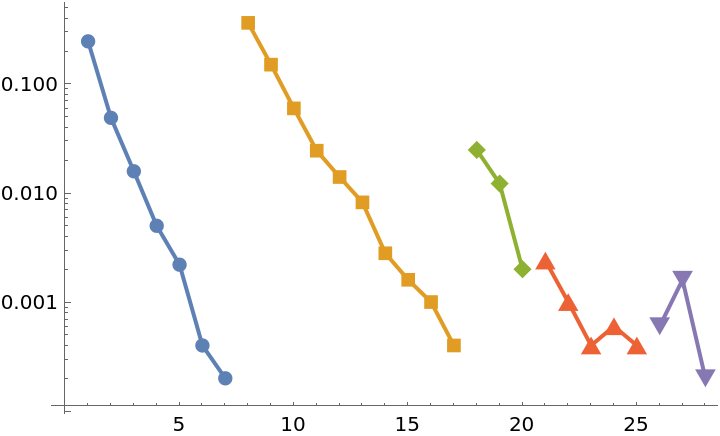
Compute k-crusts for the first several values of k:
The size of the crust, that is, the total number of nodes that belong to the crust:
The mean distance between nodes in the largest cluster of each crust:
The mean distance peaks indicating the percolation transition:
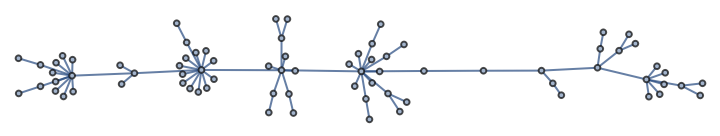
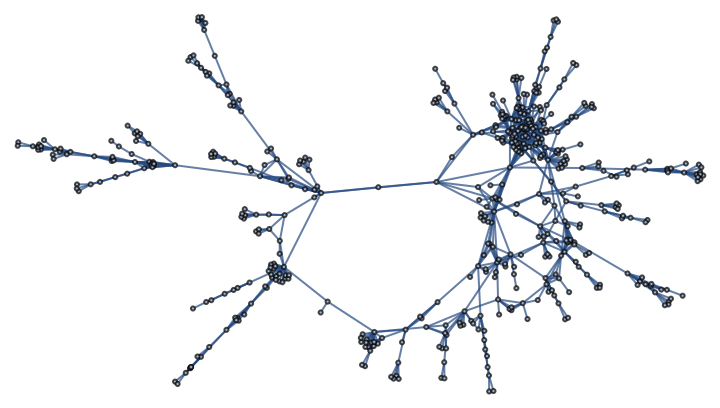
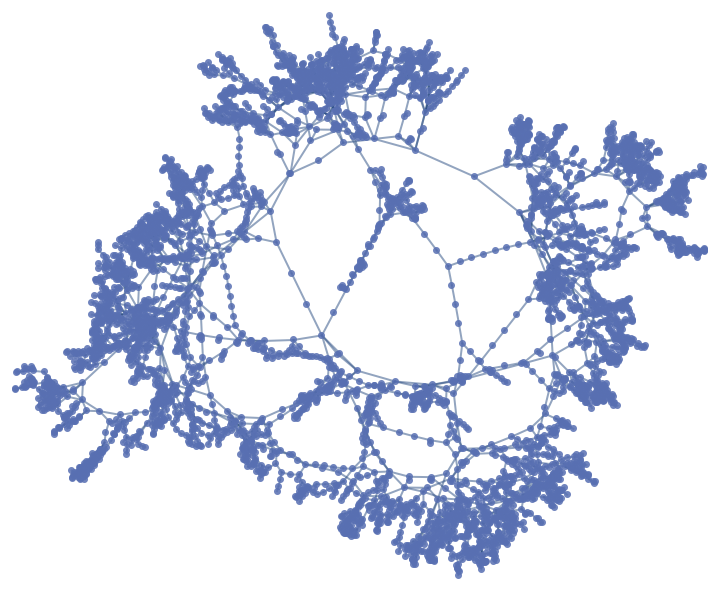
Analyze the structure of a power grid network:
The exponential decay of the power grid's onion spectrum is a signature of its tree-like structure, where most loops are short and link nearby nodes: