Wolfram Language Paclet Repository

Community-contributed installable additions to the Wolfram Language

Primary Navigation

    • Cloud & Deployment
    • Core Language & Structure
    • Data Manipulation & Analysis
    • Engineering Data & Computation
    • External Interfaces & Connections
    • Financial Data & Computation
    • Geographic Data & Computation
    • Geometry
    • Graphs & Networks
    • Higher Mathematical Computation
    • Images
    • Knowledge Representation & Natural Language
    • Machine Learning
    • Notebook Documents & Presentation
    • Scientific and Medical Data & Computation
    • Social, Cultural & Linguistic Data
    • Strings & Text
    • Symbolic & Numeric Computation
    • System Operation & Setup
    • Time-Related Computation
    • User Interface Construction
    • Visualization & Graphics
    • Random Paclet
    • Alphabetical List
  • Using Paclets
    • Get Started
    • Download Definition Notebook
  • Learn More about Wolfram Language

QuantileRegression

Guides

  • Quantile regression

Tech Notes

  • Quantile regression 3D examples
  • Quantile regression over weather time series
  • Unit tests

Symbols

  • NURBSBasis
  • QuantileEnvelope
  • QuantileEnvelopeRegion
  • QuantileRegressionFit
  • QuantileRegression
AntonAntonov`QuantileRegression`
QuantileEnvelopeRegion
​
QuantileEnvelopeRegion
[data_?
MatrixQ
,q_?
NumberQ
,ndir_Integer]
experimental implementation of 2D or 3D quantile envelope region finding.
​
Examples  
(1)
Basic Examples  
(1)
Generate data:
In[1]:=
SeedRandom[22];​​npoints=2000;​​data={RandomReal[{0,2Pi},npoints],RandomReal[{-Pi,Pi},npoints],RandomVariate[PoissonDistribution[4.8],npoints]};​​data=MapThread[#3*{Cos[#1]Cos[#2],Sin[#1]Cos[#2],Sin[#2]}&,data];
Plot the data:
In[2]:=
Block[{qs=12},qs=Map[Quantile[#,Range[0,1,1/(qs-1)]]&,Transpose[data]];​​grData=ListPointPlot3D[data,PlotRangeAll,PlotTheme"Detailed",FaceGrids{{{0,0,-1},Most[qs]},{{0,1,0},qs〚{1,3}〛},{{-1,0,0},Rest[qs]}},ImageSizeLarge]]
Out[2]=
Find the implicit region of Quantile regression envelope for probability
0.9
:
In[3]:=
ir=
QuantileEnvelopeRegion
[data,0.9,20];
Approximate the boundary of the region:
In[4]:=
s=BoundaryDiscretizeRegion[ir,PerformanceGoal"Speed",BoxRatios{1,1,1/2}]
Out[4]=
Show the data and the envelope together:
In[5]:=
Show[{grData,s}]
Out[5]=
Find the points inside the envelope:
In[6]:=
inPoints=Select[data,#∈ir&];​​​​​​Length[inPoints]/Length[data]//N
Out[6]=
0.3775
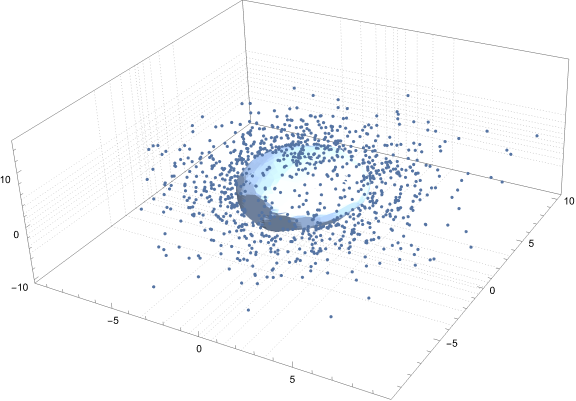
It can be seen that the algorithm produces a region that contains a much smaller number of points than the requested probability (0.9 above.) This property (shortcoming) of the algorithm is discussed in the article "Quantile tomography: using quantiles with multivariate data" by Linglong Kong, Ivan Mizera (2013, arXiv:0805.0056v2).
SeeAlso
QuantileEnvelope
RelatedGuides
▪
Quantile regression
""

© 2025 Wolfram. All rights reserved.

  • Legal & Privacy Policy
  • Contact Us
  • WolframAlpha.com
  • WolframCloud.com