Wolfram Language
Paclet Repository
Community-contributed installable additions to the Wolfram Language
Primary Navigation
Categories
Cloud & Deployment
Core Language & Structure
Data Manipulation & Analysis
Engineering Data & Computation
External Interfaces & Connections
Financial Data & Computation
Geographic Data & Computation
Geometry
Graphs & Networks
Higher Mathematical Computation
Images
Knowledge Representation & Natural Language
Machine Learning
Notebook Documents & Presentation
Scientific and Medical Data & Computation
Social, Cultural & Linguistic Data
Strings & Text
Symbolic & Numeric Computation
System Operation & Setup
Time-Related Computation
User Interface Construction
Visualization & Graphics
Random Paclet
Alphabetical List
Using Paclets
Create a Paclet
Get Started
Download Definition Notebook
Learn More about
Wolfram Language
ChemistryFunctions
Guides
Wolfram Chemistry Functions
Symbols
AtomSelector3D
AtomSelector
BohrModelPlot
ChemicalFormulaQ
ChemicalReactionQ
ConstitutionalIsomersQ
DiastereomersQ
EmbeddedMoleculeQ
EmpiricalFormula
EmptyMoleculeQ
EnantiomersQ
EpimersQ
FormatMoleculesAsGraphics
HydrocarbonQ
ImportComputationalChemistryData
IonCounts
MoleculeDelete
MoleculeGridPlot3D
MoleculeGridPlot
MoleculeJoin
MoleculeManipulate3D
MoleculeManipulate
MoleculeMirrorPlot3D
MoleculePatternQ
MoleculePlotOptions
MoleculeScaffold
MoleculeSubstructureMatches
PatternReactionQ
PeriodicTablePlot
RandomMolecule
RingMoleculeQ
RingPattern
SmilesPlot
StereoisomersQ
WolframChemistry`ChemistryFunctions`
M
o
l
e
c
u
l
e
G
r
i
d
P
l
o
t
M
o
l
e
c
u
l
e
G
r
i
d
P
l
o
t
[
{
{
m
o
l
1
1
,
m
o
l
1
2
,
…
}
,
…
}
]
g
e
n
e
r
a
t
e
s
a
g
r
a
p
h
i
c
i
n
w
h
i
c
h
t
h
e
m
o
l
i
j
a
r
e
l
a
i
d
o
u
t
i
n
a
t
w
o
-
d
i
m
e
n
s
i
o
n
a
l
g
r
i
d
.
M
o
l
e
c
u
l
e
G
r
i
d
P
l
o
t
[
m
o
l
s
,
p
a
t
t
]
h
i
g
h
l
i
g
h
t
s
a
l
l
o
c
c
u
r
r
e
n
c
e
s
o
f
t
h
e
g
i
v
e
n
p
a
t
t
e
r
n
i
n
t
h
e
m
o
l
e
c
u
l
e
p
l
o
t
s
.
D
e
t
a
i
l
s
a
n
d
O
p
t
i
o
n
s
Examples
(
2
)
Basic Examples
(
1
)
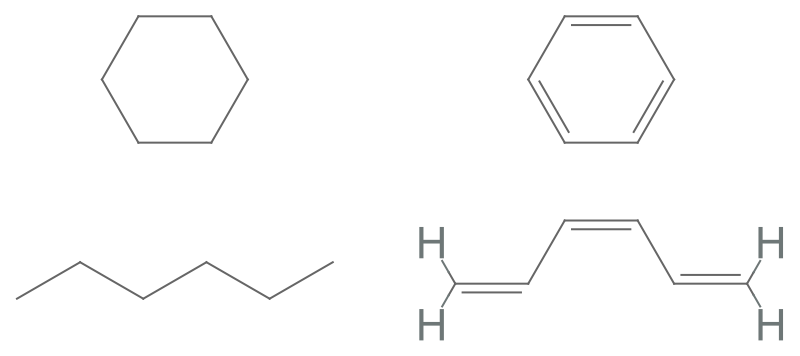
Plot a grid of molecules:
I
n
[
1
]
:
=
M
o
l
e
c
u
l
e
G
r
i
d
P
l
o
t
[
{
{
M
o
l
e
c
u
l
e
[
"
c
y
c
l
o
h
e
x
a
n
e
"
]
,
M
o
l
e
c
u
l
e
[
"
b
e
n
z
e
n
e
"
]
}
,
{
M
o
l
e
c
u
l
e
[
"
h
e
x
a
n
e
"
]
,
M
o
l
e
c
u
l
e
[
"
(
3
Z
)
-
h
e
x
a
-
1
,
3
,
5
-
t
r
i
e
n
e
"
]
}
}
]
O
u
t
[
1
]
=
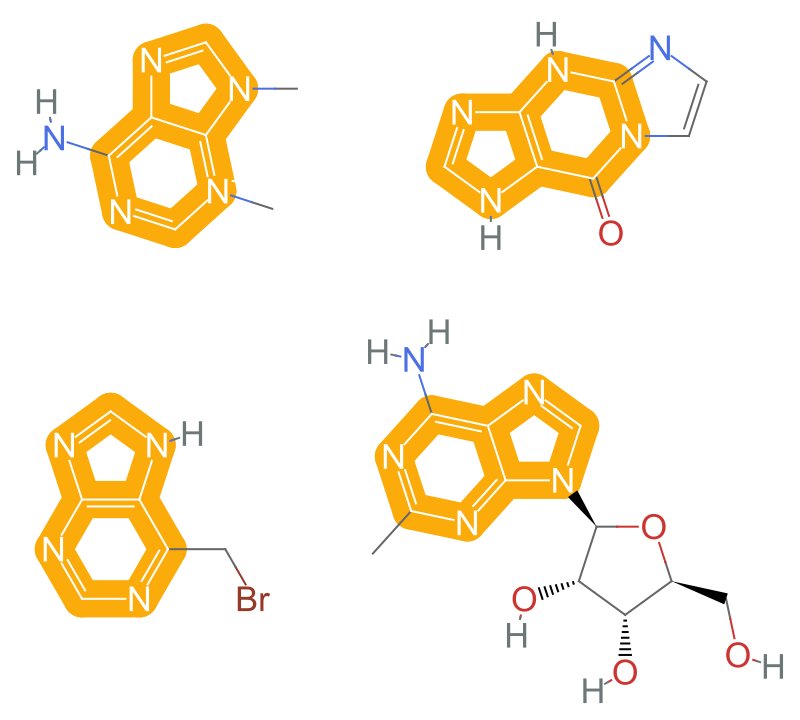
Plot a grid of molecules highlighting a given pattern:
I
n
[
2
]
:
=
M
o
l
e
c
u
l
e
G
r
i
d
P
l
o
t
{
{
M
o
l
e
c
u
l
e
[
"
C
n
1
c
n
c
2
c
(
N
)
n
c
[
n
+
]
(
C
)
c
2
1
"
]
,
M
o
l
e
c
u
l
e
[
"
O
=
c
1
c
2
[
n
H
]
c
n
c
2
[
n
H
]
c
2
n
c
c
n
1
2
"
]
}
,
{
M
o
l
e
c
u
l
e
[
"
B
r
C
c
1
n
c
n
c
2
n
c
[
n
H
]
c
1
2
"
]
,
M
o
l
e
c
u
l
e
[
"
C
c
1
n
c
(
N
)
c
2
n
c
n
(
[
C
@
H
]
3
O
[
C
@
@
H
]
(
C
O
)
[
C
@
H
]
(
O
)
[
C
@
@
H
]
3
O
)
c
2
n
1
"
]
}
}
,
M
o
l
e
c
u
l
e
P
a
t
t
e
r
n
A
t
o
m
s
:
9
B
o
n
d
s
:
1
0
O
u
t
[
2
]
=
O
p
t
i
o
n
s
(
1
)
S
e
e
A
l
s
o
M
o
l
e
c
u
l
e
P
l
o
t
▪
G
r
a
p
h
i
c
s
G
r
i
d
▪
M
o
l
e
c
u
l
e
G
r
i
d
P
l
o
t
3
D
R
e
l
a
t
e
d
G
u
i
d
e
s
▪
W
o
l
f
r
a
m
C
h
e
m
i
s
t
r
y
F
u
n
c
t
i
o
n
s
"
"